A universal methodology for reliable predicting the non steroidal anti inflammatory drug solubility in supercritical carbon dioxide

Page created by Jacob Rojas
 
CONTINUE READING
A universal methodology for reliable predicting the non steroidal anti inflammatory drug solubility in supercritical carbon dioxide
www.nature.com/scientificreports

                OPEN             A universal methodology
                                 for reliable predicting
                                 the non‑steroidal
                                 anti‑inflammatory drug solubility
                                 in supercritical carbon dioxide
                                 Tahereh Rezaei1*, Vesal Nazarpour2, Nahal Shahini3, Soufia Bahmani3, Amir Shahkar4,
                                 Mohammadreza Abdihaji5, Sina Ahmadi6 & Farzad Tat Shahdost7

                                 Understanding the drug solubility behavior is likely the first essential requirement for designing
                                 the supercritical technology for pharmaceutical processing. Therefore, this study utilizes different
                                 machine learning scenarios to simulate the solubility of twelve non-steroidal anti-inflammatory
                                 drugs (NSAIDs) in the supercritical carbon dioxide ­(SCCO2). The considered NSAIDs are Fenoprofen,
                                 Flurbiprofen, Ibuprofen, Ketoprofen, Loxoprofen, Nabumetone, Naproxen, Nimesulide,
                                 Phenylbutazone, Piroxicam, Salicylamide, and Tolmetin. Physical characteristics of the drugs
                                 (molecular weight and melting temperature), operating conditions (pressure and temperature), and
                                 solvent property ­(SCCO2 density) are effectively used to estimate the drug solubility. Monitoring and
                                 comparing the prediction accuracy of twelve intelligent paradigms from three categories (artificial
                                 neural networks, support vector regression, and hybrid neuro-fuzzy) approves that adaptive neuro-
                                 fuzzy inference is the best tool for the considered task. The hybrid optimization strategy adjusts the
                                 cluster radius of the subtractive clustering membership function to 0.6111. This model estimates 254
                                 laboratory-measured solubility data with the AAPRE = 3.13%, MSE = 2.58 × ­10–9, and ­R2 = 0.99919.
                                 The leverage technique confirms that outliers may poison less than four percent of the experimental
                                 data. In addition, the proposed hybrid paradigm is more reliable than the equations of state and
                                 available correlations in the literature. Experimental measurements, model predictions, and relevancy
                                 analyses justified that the drug solubility in ­SCCO2 increases by increasing temperature and pressure.
                                 The results show that Ibuprofen and Naproxen are the most soluble and insoluble drugs in ­SCCO2,
                                 respectively.

                                  Separation scenarios, including f­luidization1, liquid–liquid e­ xtraction 2, ­a dsorption 3,4, ­c rystallization 5,
                                  ­ embrane6,7, and microfluid a­ bsorption8, are continuously engaged in different industrial processes. Moreover,
                                  m
                                  the processes operated with the supercritical fluids have a wide range of applications in diverse fields, including
                                 ­extraction9, ­reaction10, food i­ ndustry11, nanoparticle d­ ecoration12, nanosheet f­ abrication13, tissue e­ ngineering14,
                                  and pharmaceutical p  ­ rocessing15. ­Water16, ­propane17, and carbon dioxide (­ CO2)18 are among materials potentially
                                  used as the supercritical medium. The unique characteristics, such as mild critical temperature (31.1 °C) and
                                  pressure (73.8 bar)19, provide carbon dioxide with diverse applications as a supercritical ­solvent20. Furthermore,
                                  carbon dioxide in the supercritical state is a low-cost and low viscous solvent with high diffusivity and solvating
                                  ­ability21.

                                 1
                                  Neuroscience Research Center, Shiraz University of Medical Sciences, Shiraz, Iran. 2Department of Biomedical
                                 Engineering, Mashhad Branch, Islamic Azad University, Mashhad, Iran. 3Department of Computer Engineering,
                                 Amirkabir University of Technology, Tehran 15875‑4413, Iran. 4Department of Transportation Engineering,
                                 Karadeniz Technical University, 61080 Trabzon, Turkey. 5Department of Biology, The Center for Genomics and
                                 Bioinformatics, Indiana University, Bloomington, IN, USA. 6Department of Computer Engineering, West Tehran
                                 Branch, Islamic Azad University, Tehran, Iran. 7Department of Electrical Engineering, Garmsar Branch, Islamic Azad
                                 University, Semnan, Iran. *email: drtrezaei@yahoo.com

Scientific Reports |   (2022) 12:1043                 | https://doi.org/10.1038/s41598-022-04942-4                                                          1

                                                                                                                                                       Vol.:(0123456789)
www.nature.com/scientificreports/

                                            CO2 (1) + drug (2)   Temperature range (K)   Pressure range (MPa)   Solubility range (mole fraction)   No. of data
                                            Fenoprofen22         308.00–338.00           12.00–40.00            0.000020–0.004200                  32
                                            Flurbiprofen23       303.00–323.00            8.90–24.50            0.000017–0.000197                  27
                                            Ibuprofen24          313.15–313.15           12.12–23.1             0.002100–0.007700                   9
                                            Ketoprofen25         312.50–331.50           10.00–22.00            0.000013–0.000155                  10
                                            Loxoprofen26         308.00–338.00           12.00–40.00            0.000014–0.001280                  32
                                            Nabumetone27         308.20–328.20           10.00–22.00            0.000039–0.002680                  21
                                            Naproxen24           313.15–313.15           12.11–27.98            0.000010–0.000042                   9
                                            Nimesulide25         313.10–333.10           13.00–22.00            0.000019–0.000099                   8
                                            Phenylbutazone27     308.20–328.20           10.00–22.00            0.000020–0.002650                  21
                                            Piroxicam25,28       308.15–338.15           13.00–40.00            0.000012–0.000512                  37
                                            Salicylamide27       308.20–328.20           10.10–22.00            0.000028–0.000210                  21
                                            Tolmetin15           308.00–338.00           12.00–40.00            0.000019–0.002590                  32

                                            Table 1.  Available laboratory measurements for solubility of anti-inflammatory drugs in supercritical C
                                                                                                                                                   ­ O 2.

                                                   Application and interest in using the supercritical C     ­ O2 ­(SCCO2) for pharmaceutical processing have
                                             been sharply increased ­recently15,22–28. Understanding the drug solubility in ­SCCO2 is the central informa-
                                             tion for designing the supercritical-based pharmaceutical ­technology29. The ­size26, ­shape26, surface ­structure22,
                                             ­morphology22, and crystallization p    ­ rocess26 of synthesized solid drugs are determined by their solubility in the
                                              supercritical fluid. In addition, the economic success of the supercritical technology highly depends on reliable
                                              insight about the solid (drug) solubility in supercritical s­ olvents23.
                                                   Therefore, some researchers focused on laboratory measurements of solid drug solubility in supercritical
                                            ­CO215,22–28. However, experimental determination of pharmaceutical solubility in S­ CCO2 is complex, expensive,
                                             and time-consuming23,30. In addition, it is not possible to measure equilibrium solubility in all ranges of desired
                                              operating ­conditions26,30.
                                                   Hence, several e­ mpirical31,32 and thermodynamic-based23,33 correlations have been proposed to calculate the
                                             solid drug solubility in the ­CO2 at the supercritical state. Traditionally equations of state are the most utilized
                                              thermodynamic-based correlations for predicting the phase equilibria of drugs/SCCO234–36. Unfortunately, these
                                              thermodynamic-based methods have at least one temperature-dependent interaction parameter that must be
                                              adjusted ­appropriately23. Surprisingly, there is no general thermodynamic-based method for effectively moni-
                                             toring the solubility of several solid drugs in S­ CCO223. Furthermore, it is claimed that equations of state often
                                             provide high levels of ­uncertainty34 and sometimes wholly ­fail35. On the other hand, available empirical correla-
                                             tions have usually been developed for estimating the solubility of a specific solid drug in supercritical ­CO2, and
                                              it is impossible to find which correlation is better to ­use22.
                                                   The non-steroidal anti-inflammatory drugs (NSAID) are often prescribed to reduce pain/fever/inflamma-
                                              tion and prevent blood c­ lots26. The current research intends to propose a universal intelligent model to predict
                                             the solubility of twelve NSAIDs (Fenoprofen, Flurbiprofen, Ibuprofen, Ketoprofen, Loxoprofen, Nabumetone,
                                             Naproxen, Nimesulide, Phenylbutazone, Piroxicam, Salicylamide, and Tolmetin) in S­ CCO2. For doing so, 2150
                                              intelligent paradigms from three different categories (i.e., artificial neural networks, hybrid neuro-fuzzy, and
                                              support vector regression) have been constructed, and their accuracy monitored. The ANFIS model with the
                                              subtractive clustering membership function and cluster radius of 0.6111 presents the most reliable prediction
                                              results. This straightforward model can accurately predict the solubility of 12 NSAIDs in supercritical ­CO2 in
                                             wide ranges of operating pressures and temperatures. To the best of our knowledge, it is the most generalized
                                             approach developed for phase equilibria modeling of NSAIDs/SCCO2 up to now.

                                            Material and methods
                                            The collected drug solubility data, their sources, and ranges of experimental measurements have been reported in
                                            this section. Furthermore, the current section has concisely introduced the applied machine learning methods.

                                            Experimental data for anti‑inflammatory drug solubility in ­SCCO2.                      Development, as well as vali-
                                            dation stages of all machine learning techniques, require an experimentally measured databank about the given
                                            problems. Therefore, in the current research, the information of 254 experiments related to the anti-inflam-
                                            matory drug solubility in supercritical C  ­ O2 has been gathered from eight trusted l­iterature15,22–28. A complete
                                            description of these experiments, including their range of operating pressures and temperatures, the observed
                                            solubility levels, and numbers of available data for all anti-inflammatory drug/SCCO2 systems, have been intro-
                                            duced in Table 1. It is also necessary to highlight that subscript 1 and 2 are associated with the anti-inflammatory
                                            drug and supercritical carbon dioxide, respectively.
                                               Since the solubility of all anti-inflammatory drugs in supercritical ­CO2 is planned to be estimated by a single
                                            model, it is necessary to include the drugs’ inherent characteristics in the modeling stage, too. Table 2 shows the
                                            molecular weight and melting temperature of the considered anti-inflammatory drugs. It is better to note that
                                            each anti-inflammatory drug has its unique values for these properties. Therefore, the molecular weight and
                                            melting temperature can be incorporated in the model’s entry to differentiate among different anti-inflammatory
                                            drugs.

          Scientific Reports |   (2022) 12:1043 |                 https://doi.org/10.1038/s41598-022-04942-4                                                      2

Vol:.(1234567890)
www.nature.com/scientificreports/

                                       Anti-inflammatory drug                     Molecular weight (g/mole)    Melting temperature (K)
                                       Fenoprofen                                 244.27                       386.15
                                       Flurbiprofen                               206.00                       347.65
                                       Ibuprofen                                  254.29                       367.65
                                       Ketoprofen                                 246.10                       383.00
                                       Loxoprofen                                 228.30                       353.15
                                       Nabumetone                                 230.00                       430.65
                                       Naproxen                                   308.31                       421.65
                                       Nimesulide                                 308.30                       378.58
                                       Phenylbutazone                             331.30                       469.15
                                       Piroxicam                                  137.10                       413.58
                                       Salicylamide                               257.29                       429.00
                                       Tolmetin                                   244.27                       386.15

                                  Table 2.  Physical properties of the considered anti-inflammatory drugs.

                                                                     Spearman
                                                    0.4              Pearson
                                                                     Kendall
                                 Relevancy factor

                                                    0.2

                                                      0

                                                    -0.2

                                                    -0.4
                                                                                                re

                                                                                                            re
                                                                                 re
                                                                t

                                                                                                                            ity
                                                                gh

                                                                                            tu

                                                                                                          su
                                                                                tu

                                                                                                                        ns
                                                            ei

                                                                                           ra
                                                                             ra

                                                                                                        es

                                                                                                                        de
                                                           w

                                                                                           pe
                                                                            pe

                                                                                                       Pr
                                                           ar

                                                                                       m
                                                                         m

                                                                                                                  CO
                                                                                                                        2
                                                       ul

                                                                                      Te
                                                                        te
                                                     ec

                                                                                                                 SC
                                                                        g
                                                    ol

                                                                     tin
                                                M

                                                                 el
                                                                M

                                  Figure 1.  The value of Spearman, Pearson, and Kendall factors for relevancy between drug solubility and the
                                  corresponding influential variables.

                                                                                                            ­ atabase37 and utilize them as model’s
                                     Although it is possible to extract some features from the experimental d
                                  entry, the current research aims to relate anti-inflammatory drug solubility in S­ CCO2 ( y2 ) to the molecular
                                  weight ( Mw2), melting temperature (Tm2), operating pressure (P), temperature (T), and S­ CCO2 density (ρ1).
                                  The mathematical statement of this expression is shown by Eq. (1).
                                                                                                     y2 = fML (Mw2 , Tm2 , T, P, ρ1 )                (1)
                                     Three trustful relevancy analysis approaches, namely Spearman, Pearson, and Kendal, have been utilized to
                                  check whether the selected independent variables are appropriate features for the model d    ­ evelopment38. These
                                  techniques show the relevancy level between a pair of dependent-independent variables by a coefficient in the
                                  range of minus one to plus ­one39. The negative coefficients indicate indirect dependency, positive ones show a
                                  direct relationship, and zero coefficient value is associated with no r­ elevancy39.
                                     Figure 1 presents the observed coefficients of Spearman, Pearson, and Kendall techniques for interrelations of
                                  the anti-inflammatory drug solubility in S­ CCO2 with the selected independent variables. This analysis approves
                                  that increasing the molecular weight and melting temperature of anti-inflammatory drugs reduces their dissolu-
                                  tion in the supercritical ­CO2. On the other hand, raising pressure, temperature, and solvent density enhance drug
                                  solubility in the S­ CCO2. Furthermore, molecular weight and pressure have the weakest indirect and strongest
                                  direct influences on the drug solubility in the S­ CCO2, respectively. The performed relevancy analysis results can
                                  be considered a justification for the appropriate selection of the independent variables.

                                  Computational methodologies. Machine learning methods have been extensively engaged in
                                  ­approximation40,41, ­interpretation42, action ­recognition43, and ­classification44,45 porpuses. This study focuses on
                                  five artificial neural networks (ANN), four hybrid neuro-fuzzy types, and three kinds of support vector regres-
                                  sion (SVR) to simulate anti-inflammatory drug solubility in supercritical ­CO2. The considered ANN models are
                                  multilayer perceptron neural network (MLPNN)46,47, cascade feedforward neural network (CFFNN)48, recur-

Scientific Reports |   (2022) 12:1043 |                                      https://doi.org/10.1038/s41598-022-04942-4                                3

                                                                                                                                                  Vol.:(0123456789)
www.nature.com/scientificreports/

                                            AI model      Fixed parameters                                     Deciding parameters              No. of models
                                                          Two neuronic layers
                                                                                                               1–10 Hidden neurons
                                            MLPNN         Levenberg–Marquardt optimization scenario                                             300
                                                                                                               Weights and biases
                                                          Tangent and logarithm sigmoid activation function
                                                          Two neuronic layers
                                                                                                               1–9 Hidden neurons
                                            CFFNN         Levenberg–Marquardt optimization scenario                                             180
                                                                                                               Weights and biases
                                                          Tangent and logarithm sigmoid activation functions
                                                          Two neuronic layers
                                                                                                               1–6 Hidden neurons
                                            RNN           Scaled Conjugate Gradient optimization scenario                                       120
                                                                                                               Weights and biases
                                                          Tangent and logarithm sigmoid activation functions
                                                          Two neuronic layers                                  1 × ­10–6 < Spread factor < 10
                                            GRNN                                                                                                200
                                                          Gaussian and linear activation functions             Weights and biases
                                                                                                               1–10 Hidden neurons
                                                          Two neuronic layers
                                            RBFNN                                                              1 × ­10–6 < Spread factor < 10   250
                                                          Gaussian and linear activation functions
                                                                                                               Weights and biases
                                                          Subtractive clustering membership function           0.5 < Radius of cluster < 1
                                            ANFIS2-H                                                                                            200
                                                          Hybrid optimization scenario                         Membership function parameters
                                                          Subtractive clustering membership function           0.5 < Radius of cluster < 1
                                            ANFIS2-BP                                                                                           200
                                                          Backpropagation optimization scenario                Membership function parameters
                                                          C-means clustering membership function               2–11 Cluster
                                            ANFIS3-H                                                                                            200
                                                          Hybrid optimization scenario                         Membership function parameters
                                                          C-means clustering membership function               2–11 cluster
                                            ANFIS3-BP                                                                                           200
                                                          Backpropagation optimization scenario                Membership function parameters
                                                                                                               Weights and biases
                                            LSSVR-L       Linear kernel function                                                                100
                                                                                                               Linear kernel parameter
                                                                                                               Weights and biases
                                            LSSVR-P       Polynomial kernel function                                                            100
                                                                                                               Polynomial kernel parameters
                                                                                                               Weights and biases
                                            LSSVR-G       Gaussian kernel function                                                              100
                                                                                                               Gaussian kernel parameters

                                            Table 3.  Complete information about 2150 constructed computational techniques by the trial-and-error
                                            procedure.

                                            rent neural network (RNN)49,50, general regression neural network (GRNN)48, and radial basis function neural
                                            networks (RBFNN)51. The efficiency of the support vector regression with the linear kernel (LSSVR-L)52, polyno-
                                            mial kernel (LSSVR-P)52, and Gaussian kernel (LSSVR-G)53 are also evaluated over the considered purpose. The
                                            neuro-fuzzy models with the subtractive clustering membership function trained by the hybrid (ANFIS2-H)
                                            and backpropagation (ANFIS2-BP) algorithms have also been applied in the current ­study54. The last intelligent
                                            tools used in the present research are the neuro-fuzzy models with the C-means clustering membership function
                                            trained by hybrid (ANFIS3-H) and backpropagation (ANFIS3-BP) optimization ­strategies55.
                                                It should be mentioned that these paradigms can be viewed as advanced regression-based tools. Therefore,
                                            they have all limitations of the conventional regression-based methods. Indeed, the developed intelligent schemes
                                            are only valid for the ranges of experimental data reported in Table 1. Utilizing these models for extrapolation
                                            purposes is not suggested.

                                            Results and discussions
                                            The focus of the present section is devoted to constructing different numbers of the considered intelligent
                                            paradigms through the trial-and-error tactic and determining models with the lowest deviation from experi-
                                            mental measurements. Then the model with the highest accuracy is found applying the ranking analysis. After
                                            this, several visual inspections have been directed to evaluate the selected model efficiency for estimating anti-
                                            inflammatory drugs’ solubility in supercritical C­ O2. The ability of the fabricated intelligent model to recall the
                                            physical-based behavior of the anti-inflammatory drug in the supercritical fluid (variation of drug solubility by
                                            the operating conditions) has also been inspected in the present section.

                                            Smart models’ construction. The present research employs five types of artificial neural networks
                                            (MLPNN, CFNN, RNN, GRNN, and RBFNN), three support vector regression kinds (LSSVR-L, LSSVR-P, and
                                            LSSVR-G), and four hybrid neuro-fuzzy approaches (ANFIS2-H, ANFIS2-BP, ANFIS3-H, and ANFIS3-BP) for
                                            simulating the anti-inflammatory drugs’ solubility in the supercritical ­CO2. All these intelligent tools have their
                                            own unique features required to be appropriately determined. Table 3 expresses both fixed and tunable elements
                                            of the applied machine learning methodologies in the present research. This table also indicates the range of the
                                            tunable features of the intelligent paradigms during the trial-and-error process. The last column of Table 3 shows
                                            the numbers of the constructed models for all individual smart categories. Cumulatively, 2150 intelligent estima-
                                            tors have been fabricated during the development stage.

                                            Training process. The actions followed to adjust hyperparameters of machine learning methods is known as the
                                            training ­process56. This process utilizes historical data of a given phenomenon and an optimization algorithm to
                                            perform this duty. The literature has already compared the accuracy and computation time of some well-known

          Scientific Reports |   (2022) 12:1043 |                 https://doi.org/10.1038/s41598-022-04942-4                                                    4

Vol:.(1234567890)
www.nature.com/scientificreports/

                                  Model         Best feature                      Group             AAPRE%         MAE               RAE%     RRSE%    MSE               R2
                                                                                                                                –5                                  –8
                                                                                  Training stage      9.03         6.66 × ­10          8.25    11.9    2.49 × ­10        0.99574
                                  MLPNN         Nine hidden neurons
                                                                                  Testing stage      18.34         1.10 × ­10–4       21.00    27.8    3.19 × ­10–8      0.96206
                                                                                  Training stage     13.31         6.07 × ­10–5        8.01     9.4    1.40 × ­10–8      0.99574
                                  CFFNN         Seven hidden neurons
                                                                                  Testing stage      17.68         1.02 × ­10–4       12.91    17.0    4.20 × ­10–8      0.98940
                                                                                  Training stage     35.91         1.59 × ­10–4       24.17    33.5    1.36 × ­10–7      0.94773
                                  RNN           Five hidden neurons
                                                                                  Testing stage      35.63         3.24 × ­10–4       25.76    32.7    3.56 × ­10–7      0.94759
                                                216 Hidden neurons                Training stage      0.00         0.00                0.00     0.0    0.00              1.00000
                                  GRNN
                                                Spread factor = 0.00013           Testing stage      26.05         9.45 × ­10–5       26.94    33.0    2.17 × ­10–8      0.97892
                                                Ten hidden neurons                Training stage     84.99         4.24 × ­10–4       56.50    77.6    8.41 × ­10–7      0.66882
                                  RBFNN
                                                Spread factor = 0.4167            Testing stage      84.12         4.87 × ­10–4       57.97    77.2    1.51 × ­10–6      0.74943
                                                                                  Training stage      3.04         1.99 × ­10–5        2.48     4.2    2.87 × ­10–9      0.99915
                                  ANFIS2-H      Cluster radius = 0.6111
                                                                                  Testing stage       3.69         1.49 × ­10–5        2.82     2.9    9.6 × ­10–10      0.99963
                                                                                  Training stage     10.43         8.66 × ­10–5       10.92    14.8    3.50 × ­10–8      0.98975
                                  ANFIS2-BP     Cluster radius = 0.5556
                                                                                  Testing stage      47.79         1.73 × ­10–4       29.44    24.6    8.21 × ­10–8      0.96944
                                                                                  Training stage     10.50         5.88 × ­10–5        8.59    11.1    1.47 × ­10–8      0.99390
                                  ANFIS3-H      Eight clusters
                                                                                  Testing stage      13.34         1.09 × ­10–4        8.98    10.4    3.80 × ­10–8      0.99553
                                                                                  Training stage     25.16         2.15 × ­10–4       29.13    45.0    2.81 × ­10–7      0.89418
                                  ANFIS3-BP     Nine clusters
                                                                                  Testing stage      47.29         1.96 × ­10–4       21.51    31.7    2.60 × ­10–7      0.95163
                                                                                  Training stage    121.19         7.16 × ­10–4      101.00   158.2    3.63 × ­10–6      0.14052
                                  LSSVR-L       γ = 2.247
                                                                                  Testing stage      78.95         7.66 × ­10–4       75.69   103.4    2.28 × ­10–6      0.64925

                                                              3   2
                                                                                  Training stage     41.35         5.26 × ­10–4       67.53   186.0    5.88 × ­10–6      0.88485
                                  LSSVR-P       γ = 4.58 × ­10 , σ = [0.5004 3]
                                                                                  Testing stage      59.27         2.73 × ­10–4       40.91    55.5    2.51 × ­10–7      0.85235
                                                                                  Training stage     14.16         8.45 × ­10–5       11.93    18.4    4.59 × ­10–8      0.99148
                                  LSSVR-G       γ = 436.9, σ2 = 0.7322
                                                                                  Testing stage      41.23         2.43 × ­10–4       22.65    35.2    3.42 × ­10–7      0.96612

                                  Table 4.  The best-selected property for the employed intelligent models and their related prediction accuracy.

                                  training algorithms engaged in the training stage of machine learning ­methods56. The training stage begins
                                  with randomly generated hyperparameters. The estimated targets have been obtained by entering independent
                                  variables into an intelligent estimator. The deviation between the calculated and actual values of the dependent
                                  variable is considered an objective function of the optimization algorithm. Indeed, the optimization algorithm
                                  continuously updates the hyperparameters of the machine learning method to minimize the objective function
                                  or at least reduce it as much as possible. The training stage finishes when the maximum number of iterations is
                                  reached or the objective function converges to the prespecified v­ alue57.
                                      A trained machine learning method is then possible to employ for estimating the target variable in unknown
                                  situations. All trained intelligent tools only require the independent variables to do their duty.
                                      It can be understood from Table 3 that the radial basis function and general regression neural networks, and
                                  support vector regression benefit from the Gaussian f­ unction58. Indeed, the first two models have the Gaussian-
                                  shape activation function, but the latest uses the Gaussian as the kernel function.

                                  Smart models’ selection. In order to find the best structure of each smart method, it is necessary to quan-
                                  tize the prediction errors of the engineered models using appropriate statistical criteria. Those models provided
                                  the lowest prediction errors finally selected as the best ones. In this way, it is also possible to determine the most
                                  appropriate structural features. Table 4 presents the final twelve smart paradigms (one model per category) with
                                  the slightest prediction errors. This table also displays the prediction errors of these selected models in terms of
                                  six uncertainty criteria (AAPRE%, MAE, RAE%, RRSE%, MSE, and R           ­ 2). The calculated uncertainties have been
                                  separately reported for the training and testing categories. Equations (2) to (7) express that only laboratory-
                                  measured ( y2exp) and calculated ( y2cal ) drug solubility, numbers of data (N), and the average value of solubilities
                                     exp
                                  ( y2 ) are needed to quantize these accuracy ­criteria38,59.
                                                                                  N                    2 N 
                                                                                                                        exp 2
                                                                                                                          
                                                                       R2 = −           y2exp − y2cal     /    y2exp − y2     +1                                                   (2)
                                                                                                         r                               r
                                                                                  r=1                        r=1

                                                                                              N                N 
                                                                                                                                                  
                                                                                                                           
                                                                                                                         exp 
                                                                                              
                                                                                                y2 − y2cal  /
                                                                                                 exp              exp
                                                                      RAE% = 100 ×                                y2 − y2                                                        (3)
                                                                                                            
                                                                                                                    r                          r
                                                                                              r=1                         r=1

Scientific Reports |   (2022) 12:1043 |                     https://doi.org/10.1038/s41598-022-04942-4                                                                              5

                                                                                                                                                                              Vol.:(0123456789)
www.nature.com/scientificreports/

                                                           12
                                                                     Training subdivision
                                                           11        Testing subdivision
                                                                     Training + Testing
                                                           10
                                                           9
                                                           8

                                           Ranking order
                                                            7
                                                           6
                                                           5
                                                           4
                                                           3
                                                            2
                                                            1

                                                                                        AN 3 -H

                                                                                          LS P

                                                                                                   G
                                                                                NN

                                                                                         AN BP
                                                                             N

                                                                                        AN 2-H
                                                                NN

                                                                                         AN N
                                                                     NN

                                                                                          LS P

                                                                                          LS L
                                                                                                 R-

                                                                                                 R-
                                                                                                -B

                                                                                                R-
                                                                          RN

                                                                                                 N

                                                                                                 -
                                                                              GR
                                                            LP

                                                                                       F

                                                                                               S

                                                                                               S
                                                                    F

                                                                                              S2

                                                                                             SV

                                                                                             SV
                                                                                              S3

                                                                                             SV
                                                                                    RB
                                                                 CF

                                                                                            FI

                                                                                            FI
                                                                                           FI
                                                           M

                                                                                           FI
                                                                                     Computational model

                                            Figure 2.  Ranking orders of the selected intelligent strategies in the learning and testing steps as well as over the
                                            whole of the datasets (testing + training).

                                                                                                             N 
                                                                                                                            2
                                                                                                     MSE =      y2exp − y2cal /N                               (4)
                                                                                                                                 r
                                                                                                              r=1

                                                                                                                 N 
                                                                                                                              
                                                                                                                   y2 − y2cal  /N
                                                                                                                    exp
                                                                                                     MAE =                                                     (5)
                                                                                                                               
                                                                                                                                 r
                                                                                                                 r=1

                                                                                                                       N 
                                                                                                                                            
                                                                                                                          y2 − y2cal /y2exp
                                                                                                                           exp
                                                                                            AAPRE% = (100/N) ×                                                 (6)
                                                                                                                                      
                                                                                                                                              r
                                                                                                                       r=1

                                                                                                    
                                                                                                     N                N 
                                                                                                                                 exp 2
                                                                                                      exp      2               
                                                                                                                            exp
                                                                                      RRSE% = 100 ×    y2 − y2cal r /     y2 − y2     .                       (7)
                                                                                                                                                  r
                                                                                                           r=1                   r=1

                                            Ranking analysis for finding the highest accurate smart model. The previous two sections applied
                                             a coupling technique based on the trial-and-error process and accuracy tracking to find the best topology of
                                             each smart machine. Indeed, twelve models with the highest accuracy have been extracted from 2150 fabricated
                                             approaches.
                                                The ranking technique is directed to find the most accurate estimator among these twelve smart methods. The
                                             outcome of performing the ranking technique on the reported results in Table 4 has been plotted in Fig. 2. Indeed,
                                             AARPE%, MAE, RAE%, RRSE%, and R          ­ 2 with the same weight have been utilized for conducting this ranking
                                             analysis. The GRNN and ANFIS2-H are the first ranked during the training and testing stages, respectively. On
                                             the other hand, the worst model is the LSSVR-L, with the twelve ranking places for training and testing. The
                                             GRNN fails to extend its excellent ability in the training step to the testing phase (it places at the fifth ranking).
                                             This finding may indicate the overfitting of the GRNN with the 216 hidden neurons and spread index of 1.3 × ­10–4.
                                             The ANFIS2-H efficiency in the testing stage is better than its performance in the training stage (second and first
                                             rankings in the training and testing phases). Figure 2 also indicates the performance of the selected intelligent
                                             approaches for the combination of the testing and training datasets.
                                                It can be easily realized that the hybrid neuro-fuzzy model trained by the hybrid optimization methodol-
                                             ogy (ANFIS2-H) has the highest accuracy among 2150 initially constructed models. As Tables 3 and 4 report,
                                             this hybrid neuro-fuzzy tool has the Subtractive clustering membership function, and its adjusted cluster
                                             radius is 0.6111. This optimized topology machine provides AAPRE = 3.13%, MAE = 1.92 × ­10–5, RAE = 2.51%,
                                             RRSE = 4.06%, MSE = 2.58 × ­10–9, and ­R2 = 0.99919 for simulating twelve anti-inflammatory drugs’ solubility in
                                            ­SCCO2.

                                            Performance evaluation. This section concentrates on different graphical inspections to visually inves-
                                             tigate the proposed ANFIS2-H’s performance. The cross-plot for calculated and actual drug solubilities in the
                                            ­SCCO2 have been separately depicted for the development (training) and validation (testing) stages in Fig. 3. The
                                             legend of Fig. 3 shows that the red hexagonal symbols show training subdivision, while the blue squared symbols

          Scientific Reports |   (2022) 12:1043 |                                https://doi.org/10.1038/s41598-022-04942-4                                      6

Vol:.(1234567890)
www.nature.com/scientificreports/

                                                              10 -3
                                                                       Training subdivision
                                                         7             Testing subdivision
                                                                       y exp
                                                                         2
                                                                             =ycal
                                                                               2

                                                         6

                                       (mole fraction)
                                                         5

                                                         4

                                                         3
                                 y cal
                                   2
                                                         2

                                                         1

                                                                       1          2        3    4       5                  6          7
                                                                                         exp                                               10 -3
                                                                                       y 2 (mole fraction)

                                   Figure 3.  The calculated versus experimental values of the anti-inflammatory drug solubility in supercritical
                                  ­CO2.

                                                              10 -3
                                                         6
                                                                                                                            Experimental
                                                                                                                            Model prediction
                                                         5
                                       (mole fraction)

                                                         4

                                                         3

                                                         2
                                 y ave
                                   2

                                                         1

                                                         0
                                                                             n

                                                                                                                                     e
                                                                      en

                                                                                           en

                                                                                                                                          in
                                                             en

                                                                                                                e
                                                                                  en

                                                                                                  e

                                                                                                                      e
                                                                                                       en

                                                                                                                           m

                                                                                                                                 id
                                                                                                            id
                                                                           fe

                                                                                                on

                                                                                                                    on

                                                                                                                                         et
                                                                                                                           ca
                                                                  of

                                                                                       of
                                                         of

                                                                                 of

                                                                                                      ox

                                                                                                                                m
                                                                                                            ul
                                                                           ro

                                                                                                                                      lm
                                                                                              et

                                                                                                                 az

                                                                                                                         xi
                                                                  pr

                                                                                      pr
                                                         pr

                                                                                pr

                                                                                                           es

                                                                                                                               yla
                                                                                                   pr
                                                                       up

                                                                                              m

                                                                                                                      ro
                                                                                                                 ut

                                                                                                                                     To
                                                              bi

                                                                                      xo
                                                  no

                                                                             to

                                                                                                        m
                                                                                                  Na

                                                                                                                           lic
                                                                                           bu
                                                                      Ib

                                                                                                                      Pi
                                                                                                            ylb
                                                             ur

                                                                           Ke

                                                                                                       Ni
                                                                                  Lo
                                            Fe

                                                                                                                           Sa
                                                                                       Na
                                                             Fl

                                                                                                            en
                                                                                                        Ph

                                                                                      Anti-inflammatory drug

                                  Figure 4.  Average values of the laboratory-measured and calculated drug solubility in the considered
                                  supercritical system.

                                  are associated with the testing phase. Revisit the reported results in Table 4 clears that the regression coefficients
                                  for the development and validation stages are 0.99915 and 0.99963, respectively. It is clear that the constructed
                                  ANFIS2-H approach accurately estimated both databases, i.e., training and testing subdivisions.
                                      Average values of solubility of the concerned anti-inflammatory drugs in the supercritical C     ­ O2 for experi-
                                  mental measurements and ANFIS2-H predictions have been illustrated in Fig. 4. This figure can readily approve
                                  a satisfactory agreement between actual measurements and the proposed model predictions. Moreover, it can be
                                  seen that Ibuprofen and Naproxen are the most soluble and low soluble anti-inflammatory drugs in the ­SCCO2.
                                  Nabumetone and Phenylbutazone with an almost equal average solubility level are the subsequent high soluble
                                  drugs in the considered supercritical fluid.
                                      The capability of the generated ANFIS2-H with the optimized topology for estimating the phase equilibria of
                                  all possible drug/SCCO2 systems has been depicted in Fig. 5. This figure exhibits the model’s capability in terms of
                                  AAPRE%. It can be seen that the drug/SCCO2 phase equilibria are simulated with the AAPRE ranges from 1.04%
                                  (Phenylbutazone) to 6.05% (Nabumetone). As mentioned earlier, an overall AAPRE of the developed ANFIS2-H
                                  for predicting 254 solubility datasets is 3.13%. It should be noted that an AAPRE of lower than 10% is an accept-
                                  able accuracy from the modeling perspective. Meanwhile, the highest observed uncertainty for predicting the
                                  Nabumetone solubility in supercritical carbon dioxide may be associated with either accompanied measurement
                                  error in experimental data or ANFIS2-H inability to estimate the Nabumetone/SCCO2 equilibrium accurately.

Scientific Reports |   (2022) 12:1043 |                                          https://doi.org/10.1038/s41598-022-04942-4                             7

                                                                                                                                                   Vol.:(0123456789)
www.nature.com/scientificreports/

                                                                7

                                                                                                              6.05
                                                                6

                                                                5
                                                                                                                                               4.21
                                                                                                4.01

                                           AAPRE (%)
                                                                4                                                                       3.86

                                                                3                 3.00                                                                2.91
                                                                                                       2.76
                                                                          2.34           2.29                        2.19 2.07
                                                                2

                                                                                                                                 1.04
                                                                1

                                                                0

                                                                        to en

                                                                        To de
                                                                         up n

                                                                         m n

                                                                                    in
                                                                                     n

                                                                         ut e
                                                                       xo en

                                                                      Na one

                                                                Ph im en

                                                                      Pi one

                                                                                   m
                                                                    ylb lid
                                                                                   e

                                                                      bu fe
                                                                     ur ofe

                                                                                et
                                                                   Sa xica
                                                                    Ke rof
                                                                              of

                                                                                 i
                                                                    Lo rof

                                                                     N ox

                                                                              m
                                                                  Na pro

                                                                  en esu

                                                                            lm
                                                                             et

                                                                            az
                                                                           pr
                                                                           pr

                                                                          yla
                                                                          pr
                                                                           p

                                                                         ro
                                                                        bi
                                                                       no

                                                                      lic
                                                                      Ib
                                                           Fe

                                                                   Fl

                                                                                                  Anti-inflammatory drug

                                            Figure 5.  The ANFIS2-H uncertainty in terms of AAPRE for estimating the phase equilibria of all drug/SCCO2
                                            systems.

                                                                          10 -3
                                                                4.5
                                                                                  P=40 MPa
                                                                                  P=32 MPa
                                                                    4             P=24 MPa
                                                                                  P=16 MPa
                                                                3.5               P=12 MPa
                                                                                  Model prediction
                                                                    3
                                           y2 (mole fraction)

                                                                2.5

                                                                    2

                                                                1.5

                                                                    1

                                                                0.5

                                                                    0
                                                                    305           310           315       320          325        330          335           340
                                                                                                        Temperature (K)

                                            Figure 6.  Phase behavior of the Fenoprofen/SCCO2 binary system in different operating conditions.

                                            Investigating the physical‑based ability of the ANFIS2‑H.                     The solubility of anti-inflammatory
                                            drugs in the given supercritical fluid is affected by the operating conditions, i.e., pressure and temperature.
                                            This physical-based behavior is investigated from experimental and modeling perspectives. Indeed, this section
                                            explores the ability of the designed NAFIS2-H model for correct tracing this type of behavior.
                                                The variation of Fenoprofen solubility in the supercritical ­CO2 by the isobaric temperature alteration has
                                            been shown in Fig. 6. This figure states that the ANFIS2-H successfully understands and persuades the physi-
                                            cal behavior of the Fenoprofen/SCCO2 system at different operating conditions. Moreover, this figure explains
                                            that the Fenoprofen solubility in the concerned supercritical fluid increases by increasing pressure as well as
                                            temperature. The positive effect of the temperature on the drug solubility improves by increasing the pressure.
                                            It can be claimed that the highest amount of solubility in the S­ CCO2 is achievable at the maximum allowable
                                            pressure and temperature.
                                                It is worth noting that all other anti-inflammatory drugs also show a similar response to the alteration of the
                                            pressure/temperature. These experimental and modeling discoveries fully agree with the previously anticipated
                                            results by the relevancy analysis (“Experimental data for anti-inflammatory drug solubility in ­SCCO2” Section).
                                                Endothermic drugs’ dissolution in the supercritical carbon dioxide may be responsible for the increasing
                                            effect of the temperature. On the other hand, increasing the pressure increases the mass driving force to transfer
                                            the drug’s molecules to the supercritical phase. Increasing the density of the supercritical fluid by increasing the
                                            pressure may be seen as another responsible for this observation.
                                                The influence of isothermal pressure alteration on the Tolmetin dissolution in carbon dioxide in the super-
                                            critical state has been exhibited in Fig. 7. Excellent compatibility between laboratory-measured data points and

          Scientific Reports |   (2022) 12:1043 |                                           https://doi.org/10.1038/s41598-022-04942-4                             8

Vol:.(1234567890)
www.nature.com/scientificreports/

                                                              10 -3
                                                        3
                                                                      T=308 K
                                                                      T=318 K
                                                                      T=328 K
                                                       2.5            T=338 K
                                                                      Model prediction

                                 y 2 (mole fraction)
                                                        2

                                                       1.5

                                                         1

                                                       0.5

                                                        0
                                                         10              15         20         25         30   35          40
                                                                                         Pressure (MPa)

                                  Figure 7.  Experimental and modeling tracking of the pressure–temperature phase behavior of the Tolmetin/
                                  SCCO2 system.

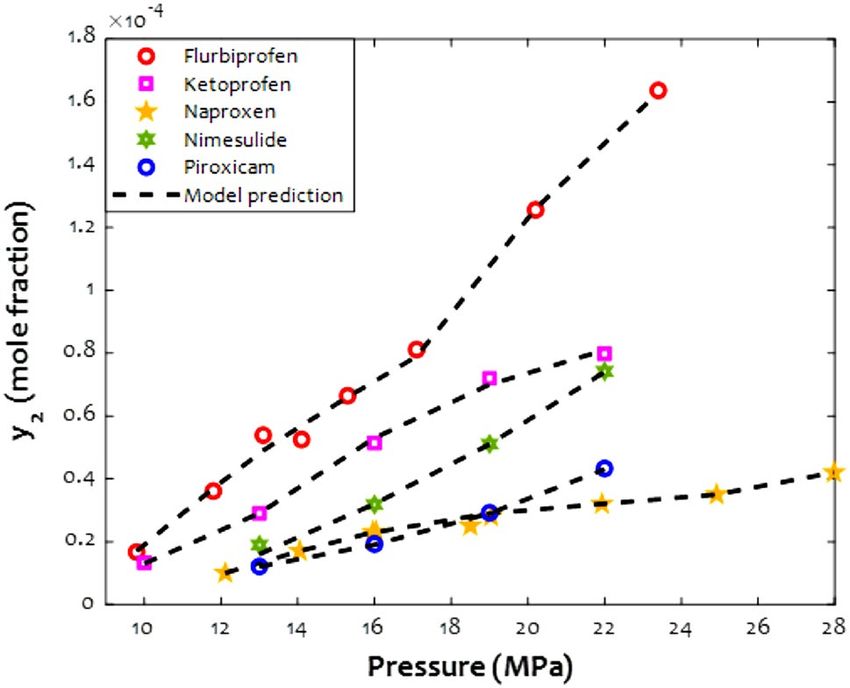
                                  Figure 8.  The way that anti-inflammatory drug solubility in supercritical ­CO2 changes by the pressure
                                  (T = 313.15 K).

                                   ANFIS2-H predictions is observable from this figure. Like the previous analysis, the Tolmetin solubility in the
                                  ­SCCO2 continuously intensifies by raising pressure or temperature. It can also be observed that the effect of
                                   pressure on the drug solubility at high temperatures is stronger than the lower ones.
                                       As previously stated, the drug type also affects the magnitude of the solubility in supercritical C     ­ O2. The
                                   ­y2-pressure profiles of several anti-inflammatory drugs in the presence of ­CO2 in the supercritical state have been
                                   presented in Fig. 8. This figure shows outstanding compatibility between laboratory-measured information and
                                   those results calculated by the designed ANFIS2-H machine. Indeed, the proposed estimator easily distinguishes/
                                   discriminates the solubility of different anti-inflammatory drugs in the S­ CCO2. This figure easily justifies the
                                   gradual increase of the anti-inflammatory drugs’ solubility by equilibrium pressure.

                                  Analyzing data validity.         Machine learning strategies gain their knowledge from the historical behavior
                                  of a concerning phenomenon (here, anti-inflammatory drug solubility in ­CO2 at supercritical state). Experi-
                                  mentations have the highest importance level to provide machine learning strategies with such insights. On
                                  the other hand, the laboratory-measured or real-field historical data is inevitably poisoned by ­outliers60. The
                                  measurement error, instrument’ wrong calibration, and environmental side effects on the experimentation are
                                  the primary sources of the ­outlier52. If the outlier information highly poisons an experimental databank used for
                                  model development, the reliability of the constructed approach is under question. Hence, the leverage tactic is
                                  suggested to inspect the validity of the experimental ­data56. This tactic plots the standard residual (SR) against

Scientific Reports |   (2022) 12:1043 |                                       https://doi.org/10.1038/s41598-022-04942-4                              9

                                                                                                                                                 Vol.:(0123456789)
www.nature.com/scientificreports/

                                                                                                                   Valid data
                                                                    6                                              Suspect data
                                                                                                                   Critical Leverage
                                                                                                                   Upper suspect bound
                                                                    4                                              Lower suspect bound

                                           Standardized residuals
                                                                    2

                                                                    0

                                                                    -2

                                                                    -4

                                                                    -6

                                                                         0.02   0.04       0.06       0.08          0.1        0.12
                                                                                            Hat index

                                             Figure 9.  Analyzing the laboratory-measured solubility data for identifying valid and suspect information.

                                             the Hat index (H) to find valid as well as suspect information. Equations (8) to (11) define the formula of these
                                             variables.
                                                                                                                             N 
                                                                                                                                             
                                                                                                    RE ave = (1/N) ×            y2exp − y2cal                 (8)
                                                                                                                                                  r
                                                                                                                             r=1

                                                                                                       
                                                                                                        N                       2
                                                                                                         exp
                                                                                                                                                              (9)
                                                                                                                       
                                                                                                  SD =      y2 − y2cal r − RE ave /N
                                                                                                             r=1

                                                                                                     SRr = REr /SD             r = 1, 2, ..., N              (10)
                                                                                                 
                                                                                       H = ξ ξ T ξ ξ −1 ξ is the matrix of independent variables.            (11)

                                                 here, REave and SD represent the average value of the residual error and standard deviation, respectively.
                                                 The consequence of applying the leverage tactic on the gathered database for anti-inflammatory drug-SCCO2
                                             systems has been published in Fig. 9. Only one segment of Fig. 9 is valid, and all other five parts are suspect. This
                                             tactic confirms that 244 out of 254 experiments are valid, and the outlier may poison only less than four percent
                                             of the historical datasets. The accomplished analysis in this stage reveals that the collected databased used for
                                             model construction is mainly valid. Thus, the proposed ANFIS2-H is solely allowed to be used for estimating
                                             anti-inflammatory drug solubility in supercritical C­ O2 from molecular weight, melting temperature, pressure,
                                             solvent density, and temperature.

                                             Conclusion
                                             This study systematically compared the prediction accuracy of 2150 intelligent estimators from three different
                                             categories (artificial neural networks, hybrid neuro-fuzzy, and support vector regression) to estimate anti-inflam-
                                             matory drug solubility in supercritical ­CO2. The conducted comparisons approved that the adaptive neuro-fuzzy
                                             inference system with the subtractive clustering membership function (ANFIS2-H) has the highest accuracy
                                             for the considered objective. The cluster radius of this ANFIS2-H model adjusted by the hybrid optimiza-
                                             tion algorithm is 0.6111. The ANFIS2-H model estimated 254 laboratory-measured solubility data with the
                                             AAPRE = 3.13%, MSE = 2.58 × ­10–9, and R   ­ 2 = 0.99919. Furthermore, the AAPRE associated with each NSAID-
                                             SCCO2 phase equilibrium ranges from 1.04 to 6.05%. In addition, the LSSVR with the linear kernel function
                                             shows the worst predictive performance for estimating the NSAID’s solubility in the ­SCCO2. The relevancy
                                             analyses performed by three diverse scenarios justified that increasing the drug’s molecular weight and melting
                                             temperature decreases their solubility in supercritical ­CO2. In addition, experimental observations, modeling
                                             findings, and relevancy analyses indicated that increasing pressure, temperature, and ­SCCO2 density raise the
                                             drug solubility in supercritical solvents. The leverage methodology showed that only ten datasets are potential
                                             outliers, and all other experiments have been conducted on a valid basis. Both modeling and experimental
                                             observations clarified that the maximum and minimum tendency of the supercritical C         ­ O2 is devoted to the
                                             Ibuprofen and Naproxen drugs, respectively. Coupling the developed intelligent scenario with an optimization
                                             technique to precisely locate the operating conditions that maximize each anti-inflammatory drug’s solubility
                                             in supercritical carbon dioxide may be considered as a next research step in this field.

          Scientific Reports |   (2022) 12:1043 |                               https://doi.org/10.1038/s41598-022-04942-4                                     10

Vol:.(1234567890)
www.nature.com/scientificreports/

                                  Received: 27 October 2021; Accepted: 4 January 2022

                                  References
                                   1. Karimi, M., Vaferi, B., Hosseini, S. H. & Rasteh, M. Designing an efficient artificial intelligent approach for estimation of hydrody-
                                      namic characteristics of tapered fluidized bed from its design and operating parameters. Ind. Eng. Chem. Res. 57, 259–267 (2018).
                                   2. Marsousi, S., Karimi-Sabet, J., Moosavian, M. A. & Amini, Y. Liquid–liquid extraction of calcium using ionic liquids in spiral
                                      microfluidics. Chem. Eng. J. 356, 492–505 (2019).
                                   3. Ghanbari Pakdehi, S. & Vaferi, B. A study on adsorptive removal of DMAZ from aqueous solutions by ZSM-5, NaY zeolites, and
                                      activated carbon. Desalin. Water Treat. 57, 18286–18292 (2016).
                                   4. Mahmoodi, F., Darvishi, P. & Vaferi, B. Prediction of coefficients of the Langmuir adsorption isotherm using various artificial
                                      intelligence (AI) techniques. J. Iran. Chem. Soc. 15, 2747–2757 (2018).
                                   5. Amini, Y., Gerdroodbary, M. B., Pishvaie, M. R., Moradi, R. & Monfared, S. M. Optimal control of batch cooling crystallizers by
                                      using genetic algorithm. Case Stud. Therm. Eng. 8, 300–310 (2016).
                                   6. Rahimpour, M. R., Mazinani, S., Vaferi, B. & Baktash, M. S. Comparison of two different flow types on CO removal along a two-
                                      stage hydrogen permselective membrane reactor for methanol synthesis. Appl. Energy 88, 41–51 (2011).
                                   7. Rahimpour, M. R., Baktash, M. S., Vaferi, B. & Mazinani, S. Reduction in CO emissions along a two-stage hydrogen-permselective
                                      membrane reactor in methanol synthesis process. J. Ind. Eng. Chem. 17, 198–207 (2011).
                                   8. Sadeghi, A., Amini, Y., Saidi, M. H. & Yavari, H. Shear-rate-dependent rheology effects on mass transport and surface reactions
                                      in biomicrofluidic devices. AIChE J. 61, 1912–1924 (2015).
                                   9. Hassim, N., Markom, M., Rosli, M. I. & Harun, S. Scale-up approach for supercritical fluid extraction with ethanol–water modified
                                      carbon dioxide on Phyllanthus niruri for safe enriched herbal extracts. Sci. Rep. 11, 1–19 (2021).
                                  10. Abusrafa, A. E., Challiwala, M. S., Choudhury, H. A., Wilhite, B. A. & Elbashir, N. O. Experimental verification of 2-dimensional
                                      computational fluid dynamics modeling of supercritical fluids Fischer Tropsch reactor bed. Catal. Today 343, 165–175 (2020).
                                  11. Wang, W. et al. Supercritical carbon dioxide applications in food processing. Food Eng. Rev. 13, 570–591 (2021).
                                  12. Meng, Y., Su, F. & Chen, Y. Supercritical fluid synthesis and tribological applications of silver nanoparticle-decorated graphene in
                                      engine oil nanofluid. Sci. Rep. 6, 1–12 (2016).
                                  13. Tian, X. et al. Shear-assisted production of few-layer boron nitride nanosheets by supercritical CO2 exfoliation and its use for
                                      thermally conductive epoxy composites. Sci. Rep. 7, 1–9 (2017).
                                  14. Liu, P., Chen, W., Liu, C., Tian, M. & Liu, P. A novel poly (vinyl alcohol)/poly (ethylene glycol) scaffold for tissue engineering with
                                      a unique bimodal open-celled structure fabricated using supercritical fluid foaming. Sci. Rep. 9, 1–12 (2019).
                                  15. Pishnamazi, M. et al. Using static method to measure tolmetin solubility at different pressures and temperatures in supercritical
                                      carbon dioxide. Sci. Rep. 10, 1–7 (2020).
                                  16. Fomin, Y. D., Ryzhov, V. N., Tsiok, E. N. & Brazhkin, V. V. Dynamical crossover line in supercritical water. Sci. Rep. 5, 1–6 (2015).
                                  17. Xing, F. Accurate prediction of thermal conductivity of supercritical propane using LSSVM. Energy Sour. Part A Recover Util.
                                      Environ. Eff. 43, 361–370 (2021).
                                  18. Alaydi, H., Downey, P., McKeon-Bennett, M. & Beletskaya, T. Supercritical-CO 2 extraction, identification and quantification of
                                      polyprenol as a bioactive ingredient from Irish trees species. Sci. Rep. 11, 1–11 (2021).
                                  19. Lashkarbolooki, M., Vaferi, B., Shariati, A. & Zeinolabedini Hezave, A. Investigating vapor-liquid equilibria of binary mixtures
                                      containing supercritical or near-critical carbon dioxide and a cyclic compound using cascade neural network. Fluid Phase Equilib.
                                      343, 24–29 (2013).
                                  20. Vaferi, B., Lashkarbolooki, M., Esmaeili, H. & Shariati, A. Toward artificial intelligence-based modeling of vapor liquid equilibria
                                      of carbon dioxide and refrigerant binary systems. J. Serb. Chem. Soc. 83, 199–211 (2018).
                                  21. Chen, L. Handbook of Research on Advancements in Supercritical Fluids Applications for Sustainable Energy Systems (IGI Global,
                                      2020).
                                  22. Zabihi, S. et al. Experimental solubility measurements of fenoprofen in supercritical carbon dioxide. J. Chem. Eng. Data 65,
                                      1425–1434 (2020).
                                  23. Coimbra, P., Duarte, C. M. M. & De Sousa, H. C. Cubic equation-of-state correlation of the solubility of some anti-inflammatory
                                      drugs in supercritical carbon dioxide. Fluid Phase Equilib. 239, 188–199 (2006).
                                  24. Suleiman, D., Antonio Estévez, L., Pulido, J. C., García, J. E. & Mojica, C. Solubility of anti-inflammatory, anti-cancer, and anti-HIV
                                      drugs in supercritical carbon dioxide. J. Chem. Eng. Data 50, 1234–1241 (2005).
                                  25. Macnaughton, S. J. et al. Solubility of anti-inflammatory drugs in supercritical carbon dioxide. J. Chem. Eng. Data 41, 1083–1086
                                      (1996).
                                  26. Zabihi, S., Esmaeili-Faraj, S. H., Borousan, F., Hezave, A. Z. & Shirazian, S. Loxoprofen solubility in supercritical carbon dioxide:
                                      experimental and modeling approaches. J. Chem. Eng. Data 65, 4613–4620 (2020).
                                  27. Su, C.-S. & Chen, Y.-P. Measurement and correlation for the solid solubility of non-steroidal anti-inflammatory drugs (NSAIDs)
                                      in supercritical carbon dioxide. J. Supercrit. Fluids 43, 438–446 (2008).
                                  28. Shojaee, S. A., Rajaei, H., Hezave, A. Z., Lashkarbolooki, M. & Esmaeilzadeh, F. Experimental measurement and correlation for
                                      solubility of piroxicam (a non-steroidal anti-inflammatory drugs (NSAIDs)) in supercritical carbon dioxide. J. Supercrit. Fluids
                                      80, 38–43 (2013).
                                  29. Baghban, A., Sasanipour, J. & Zhang, Z. A new chemical structure-based model to estimate solid compound solubility in super-
                                      critical CO2. J. CO2 Util. 26, 262–270 (2018).
                                  30. Hozhabr, S. B., Mazloumi, S. H. & Sargolzaei, J. Correlation of solute solubility in supercritical carbon dioxide using a new empirical
                                      equation. Chem. Eng. Res. Des. 92, 2734–2739 (2014).
                                  31. Yang, H. & Zhong, C. Modeling of the solubility of aromatic compounds in supercritical carbon dioxide-cosolvent systems using
                                      SAFT equation of state. J. Supercrit. Fluids 33, 99–106 (2005).
                                  32. Huang, Z., Kawi, S. & Chiew, Y. C. Application of the perturbed Lennard-Jones chain equation of state to solute solubility in
                                      supercritical carbon dioxide. Fluid Phase Equilib. 216, 111–122 (2004).
                                  33. Sodeifian, G., Saadati Ardestani, N., Sajadian, S. A. & Panah, H. S. Measurement, correlation and thermodynamic modeling of
                                      the solubility of Ketotifen fumarate (KTF) in supercritical carbon dioxide. Fluid Phase Equilib. 458, 102–114 (2018).
                                  34. Sodeifian, G., Razmimanesh, F. & Sajadian, S. A. Prediction of solubility of sunitinib malate (an anti-cancer drug) in supercritical
                                      carbon dioxide (SC–CO2): Experimental correlations and thermodynamic modeling. J. Mol. Liq. 297, 105998 (2020).
                                  35. Sodeifian, G., Saadati Ardestani, N., Sajadian, S. A., Golmohammadi, M. R. & Fazlali, A. Prediction of solubility of sodium valproate
                                      in supercritical carbon dioxide: Experimental study and thermodynamic modeling. ACS Appl. Mater. Interfaces 297, 111740 (2020).
                                  36. Sodeifian, G., Razmimanesh, F., Saadati Ardestani, N. & Sajadian, S. A. Experimental data and thermodynamic modeling of solu-
                                      bility of Azathioprine, as an immunosuppressive and anti-cancer drug, in supercritical carbon dioxide. J. Mol. Liq. 299, 112179
                                      (2020).
                                  37. Ramtin, A. R., Nain, P., Towsley, D., de Silva, E. S. & Menasche, D. S. Are covert ddos attacks facing multi-feature detectors feasible.
                                      ACM SIGMETRICS Perform. Eval. Rev. (2021).

Scientific Reports |   (2022) 12:1043 |                    https://doi.org/10.1038/s41598-022-04942-4                                                                     11

                                                                                                                                                                     Vol.:(0123456789)
www.nature.com/scientificreports/

                                            38. Jiang, Y., Zhang, G., Wang, J. & Vaferi, B. Hydrogen solubility in aromatic/cyclic compounds: Prediction by different machine
                                                learning techniques. Int. J. Hydrogen Energy 46, 23591–23602 (2021).
                                            39. Karimi, M., Vaferi, B., Hosseini, S. H., Olazar, M. & Rashidi, S. Smart computing approach for design and scale-up of conical
                                                spouted beds with open-sided draft tubes. Particuology 55, 179–190 (2020).
                                            40. Sanaat, A. & Zaidi, H. Depth of interaction estimation in a preclinical PET scanner equipped with monolithic crystals coupled to
                                                SiPMs using a deep neural network. Appl. Sci. 10, 4753 (2020).
                                            41. Zou, Y. et al. MK-FSVM-SVDD: a multiple kernel-based fuzzy SVM model for predicting DNA-binding proteins via support
                                                vector data description. Curr. Bioinform. 16, 274–283 (2021).
                                            42. Keshishian, M. et al. Estimating and interpreting nonlinear receptive field of sensory neural responses with deep neural network
                                                models. Elife 9, e53445 (2020).
                                            43. Chenarlogh, V. A., Razzazi, F. & Mohammadyahya, N. A multi-view human action recognition system in limited data case using
                                                multi-stream CNN. In 2019 5th Iranian Conference on Signal Processing and Intelligent Systems (ICSPIS) 1–11 (IEEE, 2019).
                                            44. Karimi, M., Jahanshahi, A., Mazloumi, A. & Sabzi, H. Z. Border gateway protocol anomaly detection using neural network. In
                                                2019 IEEE International Conference on Big Data (Big Data) 6092–6094 (IEEE, 2019).
                                            45. Li, S. et al. Prediction of oral hepatotoxic dose of natural products derived from traditional Chinese medicines based on SVM
                                                classifier and PBPK modeling. Arch. Toxicol. 95, 1683–1701 (2021).
                                            46. Amini, Y., Fattahi, M., Khorasheh, F. & Sahebdelfar, S. Neural network modeling the effect of oxygenate additives on the perfor-
                                                mance of Pt–Sn/γ-Al 2 O 3 catalyst in propane dehydrogenation. Appl. Petrochem. Res. 3, 47–54 (2013).
                                            47. Ghanbari, S. & Vaferi, B. Experimental and theoretical investigation of water removal from DMAZ liquid fuel by an adsorption
                                                process. Acta Astronaut. 112, 19–28 (2015).
                                            48. Karimi, M., Alibak, A. H., Alizadeh, S. M. S., Sharif, M. & Vaferi, B. Intelligent modeling for considering the effect of bio-source
                                                type and appearance shape on the biomass heat capacity. Measurement 2021, 110529 (2021).
                                            49. Vaferi, B., Eslamloueyan, R. & Ayatollahi, S. Application of recurrent networks to classification of oil reservoir models in well-
                                                testing analysis. Energy Sour. Part A Recover Util. Environ. Eff. 37, 174–180 (2015).
                                            50. Moghimihanjani, M. & Vaferi, B. A combined wavelet transform and recurrent neural networks scheme for identification of
                                                hydrocarbon reservoir systems from well testing signals. J. Energy Resour. Technol. 143, 13001 (2021).
                                            51. Cao, Y., Kamrani, E., Mirzaei, S., Khandakar, A. & Vaferi, B. Electrical efficiency of the photovoltaic/thermal collectors cooled by
                                                nanofluids: Machine learning simulation and optimization by evolutionary algorithm. Energy Rep. 8, 24–36 (2022).
                                            52. Karimi, M., Aminzadehsarikhanbeglou, E. & Vaferi, B. Robust intelligent topology for estimation of heat capacity of biochar
                                                pyrolysis residues. Measurement 183, 109857 (2021).
                                            53. Moosavi, S. R., Vaferi, B. & Wood, D. A. Auto-characterization of naturally fractured reservoirs drilled by horizontal well using
                                                multi-output least squares support vector regression. Arab. J. Geosci. 14, 545 (2021).
                                            54. Zamani, H. A., Rafiee-Taghanaki, S., Karimi, M., Arabloo, M. & Dadashi, A. Implementing ANFIS for prediction of reservoir oil
                                                solution gas-oil ratio. J. Nat. Gas Sci. Eng. 25, 325–334 (2015).
                                            55. Isen, E. & Boran, S. A novel approach based on combining ANFIS, genetic algorithm and fuzzy c-means methods for multiple
                                                criteria inventory classification. Arab. J. Sci. Eng. 43, 3229–3239 (2018).
                                            56. Zhou, Z., Davoudi, E. & Vaferi, B. Monitoring the effect of surface functionalization on the ­CO2 capture by graphene oxide/methyl
                                                diethanolamine nanofluids. J. Environ. Chem. Eng. 9, 106202 (2021).
                                            57. Ghanbari, S. & Vaferi, B. Prediction of degree of crystallinity for the LTA zeolite using artificial neural networks. Mater. Sci. Pol.
                                                35, 486–495 (2017).
                                            58. Ramtin, A. R., Nain, P., Menasche, D. S., Towsley, D. & deSilva, E. S. Fundamental scaling laws of covert DDoS attacks. Perform.
                                                Eval. 151, 102236 (2021).
                                            59. Hosseini, S. & Vaferi, B. Determination of methanol loss due to vaporization in gas hydrate inhibition process using intelligent
                                                connectionist paradigms. Arab. J. Sci. Eng. https://​doi.​org/​10.​1007/​s13369-​021-​05679-4 (2021).
                                            60. Nabipour, N., Qasem, S. N., Salwana, E. & Baghban, A. Evolving LSSVM and ELM models to predict solubility of non-hydrocarbon
                                                gases in aqueous electrolyte systems. Measurement 164, 107999 (2020).

                                            Authors contributions
                                            All authors wrote the main manuscript text. All authors engaged in the data collecting. All authors contributed
                                            to the modeling stage. All authors incorporated in the analyzing stage. All authors reviewed the manuscript.

                                            Competing interests
                                            The authors declare no competing interests.

                                            Additional information
                                            Correspondence and requests for materials should be addressed to T.R.
                                            Reprints and permissions information is available at www.nature.com/reprints.
                                            Publisher’s note Springer Nature remains neutral with regard to jurisdictional claims in published maps and
                                            institutional affiliations.
                                                          Open Access This article is licensed under a Creative Commons Attribution 4.0 International
                                                          License, which permits use, sharing, adaptation, distribution and reproduction in any medium or
                                            format, as long as you give appropriate credit to the original author(s) and the source, provide a link to the
                                            Creative Commons licence, and indicate if changes were made. The images or other third party material in this
                                            article are included in the article’s Creative Commons licence, unless indicated otherwise in a credit line to the
                                            material. If material is not included in the article’s Creative Commons licence and your intended use is not
                                            permitted by statutory regulation or exceeds the permitted use, you will need to obtain permission directly from
                                            the copyright holder. To view a copy of this licence, visit http://​creat​iveco​mmons.​org/​licen​ses/​by/4.​0/.

                                            © The Author(s) 2022

          Scientific Reports |   (2022) 12:1043 |                    https://doi.org/10.1038/s41598-022-04942-4                                                                    12

Vol:.(1234567890)
You can also read