Accumulation and distribution of micronutrients in banana cv. Williams (Musa AAA Simmonds) with different doses of nitrogen Acumulación y ...
←
→
Page content transcription
If your browser does not render page correctly, please read the page content below
Doi: https://doi.org/10.17584/rcch.2021v15i1.11795
Accumulation and distribution of micronutrients in banana
cv. Williams (Musa AAA Simmonds) with different doses
of nitrogen
Acumulación y distribución de micronutrientes en banano
cv. Williams (Musa AAA Simmonds) bajo diferentes dosis
de nitrógeno
JAIME TORRES-BAZURTO1, 3 *
STANISLAV MAGNITSKIY1
JAIVER DANILO SÁNCHEZ2
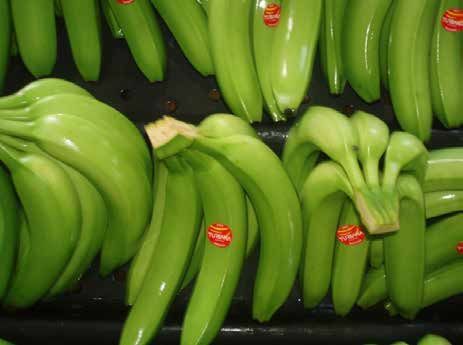
Banana fruits cv. Williams grown for export in the
CENIBANANO experimental field (Carepa, Colombia).
Photo: J. Torres-Bazurto
ABSTRACT
This research evaluated the effect of nitrogen fertilization (0, 161, 321.8, or 483 kg ha-1) on the accumu-
lation of Fe, Cu, Zn, Mn, and B in banana plants cv. Williams in two production cycles in Uraba, Colom-
bia. The micronutrient accumulation models for the plants were obtained with a multivariate approach
for differences between cycles, using a randomized complete block design with repeated measurements
over time. The N doses with greater accumulation of Cu, Fe, Mn, Zn and B in the plants with fruits
were 321.8 and 483 kg ha-1. The average sequence of micronutrient extraction by whole plants was
Fe>Mn≥Zn>B>Cu in the first cycle and Fe>Cu>Mn≥Zn>B in the second cycle. The micronutrient
accumulation was organ-specific and varied depending on the stage of development. Fe was the major
micronutrient extracted by the corm, pseudostem, and bunch. The leaves had the greatest accumula-
tion of Mn. The higher fertilizer doses generated a major response in terms of micronutrient extraction
by the banana plants.
Additional keywords: fertilization; nutrient partitioning; mineral nutrition; Musaceae.
1
Universidad Nacional de Colombia, Facultad Ciencias Agrarias, Departamento de Agronomía, Bogota (Colombia).
ORCID Torres-Bazurto, J.: 0000-0002-4731-650X; ORCID Magnitskiy, S.: 0000-0002-3715-1932
2
Yara Colombia, North Zone Manager, Carepa (Colombia). ORCID Sánchez, J.D.: 0000-0003-1862-1748
3
Corresponding author. jtorresb@unal.edu.co
* Article based on the PhD thesis of the first author “Absorción, distribución y acumulación de nitrógeno en banano
variedad Williams en dos ciclos de producción en zona húmeda tropical”.
REVISTA COLOMBIANA DE CIENCIAS HORTÍCOLAS - Vol. 15 - No. 1, e11795, January-April 2021
e-ISSN: 2422-3719 · ISSN-L: 2011-21732 TORRES-BAZURTO / MAGNITSKIY / SÁNCHEZ
RESUMEN
La presente investigación evaluó el efecto de diferentes dosis de fertilización nitrogenada (0, 161, 321,8 o 483 kg
ha-1) sobre la acumulación de Fe, Cu, Zn, Mn y B en plantas de banano cv. Williams durante dos ciclos productivos
en el Urabá, Colombia. Los modelos de acumulación de micronutrientes en plantas se obtuvieron mediante un en-
foque multivariado de las diferencias entre ciclos, empleando un diseño de bloques completos al azar con medidas
repetidas en el tiempo. Las dosis de N que mejor comportamiento mostraron para la acumulación de Cu, Fe, Mn,
Zn y B en las plantas, incluidos los frutos, fueron 321,8 y 483 kg ha-1. La extracción de micronutrientes por plantas
completas tuvo el siguiente orden Fe>Mn≥Zn>B>Cu para el primer ciclo y Fe>Cu>Mn≥Zn>B para el segundo
ciclo. La acumulación de micronutrientes fue específica a cada órgano y varió según la etapa de desarrollo, siendo el
Fe el principal micronutriente extraído por el cormo, el pseudotallo y el racimo, mientras que las hojas presentaron
la mayor acumulación de Mn. Las mayores dosis de fertilizantes resultaron en la mayor respuesta en la extracción
de micronutrientes por las plantas de banano.
Palabras clave adicionales: fertilización; partición de nutrientes; nutrición mineral; Musaceae.
Received: 28-09-2020 Accepted: 02-12-2020 Published: 21-01-2021
INTRODUCTION
Musa sp. crops are vital for the diet of approximately (Medina, 2010; Jeyabaskaran et al., 2018). The extrac-
400 million people worldwide (Perea, 2003). In Co- tion of mineral nutrients should be studied in banana
lombia, the income of about 150 thousand families plants taking into account the sink-source relation-
depends on the production of banana for export (Red ships, such as between the mother plant and suck-
Agricola, 2020), and Uraba is the principal produc- ers (Guimarães et al., 2020; Turner et al., 2020). Some
ing region of the country. About 85% of the current regional studies on banana cv. Williams have defined
Uraba economy is based on the production of export- N extraction levels at harvest, which could be used
type bananas, mainly the Cavendish subgroup Musa for determining fertilizer doses (Soto, 2001). In Co-
AAA Simmonds (Red Agricola, 2020). However, vari- lombia, one the first studies on nutrient extraction
ous socio-economic and technical problems affect the by banana plants was done by Martínez (2006) for
cultivation of bananas in the area (Gutiérrez et al., cvs. Gran Enano and Valery in Uraba, which posed
2017; AUGURA, 2020). the question: what is the effect of N fertilizer rates
on the accumulation and distribution of micronutri-
One of the serious technical challenges that affect
ents in banana plants?
banana productivity is the adjustment of fertilizer
doses (Alcaraz and Jiménez, 2018; Torres et al., 2019).
This question should be answered by taking into ac-
In Uraba, nitrogen is the key element in fertilizer dos-
count the importance of micronutrients in banana
es based on crop requirements per stage of develop-
growth (Torres, 2016). Micronutrient applications
ment (Torres et al., 2019; AUGURA, 2020). Nitrogen
affect the growth of leaves (Souza et al., 2016), roots
is assimilated by banana plants mainly in the form of
(Liu et al., 2019), and pseudostems (Kumar et al.,
nitrate or ammonium (Sánchez and Mira, 2013; Kes-
2020) and banana production (Robinson and Galán,
havan et al., 2014). The requirements of banana crops
2012). The contents of Fe, Mn, Zn, Cu, and B in plant
are considered high, exceeding 200 kg ha-1 year-1 of N
(Sánchez and Mira, 2013). According to Marschner organs estimate the plant nutrient status with the
(2012), the optimal content of N for adequate plant DRIS method (Villaseñor et al., 2020). The concen-
growth is between 2 and 3% of dry weight (DW). trations of Mn and B in banana leaves may corre-
Robinson and Galán (2012) reported an optimal N late with chlorophyll contents (Arantes et al., 2016),
content in banana leaves ranging from 2.5 to 3% DW. and micronutrient allocation to fruits is required for
bunch development (Soto, 2001). However, excess Fe,
Nutrient extraction curves in plants are useful for Mn, and Cl in coastal tropical soils could negatively
defining optimal doses of macro- and micronutrients affect yields (Osorio, 2014; Villaseñor et al., 2020).
Rev. Colomb. Cienc. Hortic.MICRONUTRIENTS IN BANANAS WITH DOSES OF NITROGEN 3
Few studies have addressed micronutrient accumula- the first production cycle (August 2011-April 2012)
tion in banana plants as affected by macronutrient and 2,088 mm during the second production cycle
fertilizers. In Brazil, Borges et al. (2006) compared fo- (February 2011-December 2012). The rainfall was
liar contents of the microelements B, Cl, Cu, Fe, Mn, low from January to March (1.4-30.4 mm month-1),
and Zn in 24 genotypes in two production cycles that which corresponded to a “dry season”, typical for the
had an annual addition of 100 kg N ha-1, 40 kg P2O5 region.
ha-1, and 300 kg K2O ha-1. The genotypes differed in
terms of micronutrient extraction by the leaves. In
addition, each genotype had an accumulation that Plant material and treatments
varied between the cycles, with lower levels of Cl, B,
Banana plants (Musa AAA Simmonds) from the AAA
Fe, and Zn in the second cycle; the leaf contents sub-
group, Giant Cavendish subgroup, Williams clone in
stantially varied for Mn (43-574 mg kg-1) and Fe 56-
the 6th productive cycle were used. The plants had
212 mg kg-1 (Borges et al., 2006). Robinson and Galán
an average height of 3.5 m. The sowing distance was
(2012) stated that genotype plays a key role in the ab-
2.5 × 2.5 m, with approximately 1,600 plants/ha.
sorption and foliar accumulation of micronutrients,
The agronomic management for commercial banana
and that these processes are influenced by edaphocli-
plantations in Uraba was used, except for the fertil-
matic conditions and fertilizer practices. The aim of
izer doses.
this research was to evaluate the accumulation and
distribution of the micronutrients Fe, Mn, Zn, Cu,
The fertilization system recommended by Cenibana-
and B in banana cv. Williams (Musa AAA Simmonds)
no for the region was applied taking into account
as affected by different doses of N fertilizers in the
the plant nutrient requirements and the results of
Uraba region of Colombia.
the soil analysis (Sánchez and Mira, 2013). The five
treatments were: absolute control (no fertilizer ap-
plied), 0, 161, 321.8, and 483 kg ha-1 of N. Addition-
MATERIALS AND METHODS ally, all plants, except the absolute control, received
the following amounts of fertilizers per ha: 87.1 kg
P2O5, 678.8 kg K2O, 50.5 kg CaO, 117.5 kg Mg, 64.2 kg
Experiment location and climatic conditions S; 1.4 kg B, and 9.3 kg Zn. The sources of the mineral
fertilizers were urea, K-Mag® (22% K2O, 18% MgO,
This research was conducted in 2011-2012 in the
and 22% S), Fertiboro (10% B), Solufos (30% P2O5,
Uraba region of the Antioquia department, Colom-
36% Ca, 5% S, and 8% Si), ZnO, K2SO4, and KCl.
bia, using the experimental field of AUGURA (Care-
The fertilizer doses were fractionated within each
pa, Antioquia), lots 3 and 4, 7°46’46” N and 76°40’20”
production cycle, for a total of 17 fertilizer applica-
W and 20 m a.s.l. The soils were fine Fluventic Eu- tions per year, with approximately 3 weeks between
trudepts, clay loam, over clay Fluvaquentic Eutrud- applications. The fertilizer applications started with
ept, and fine loam Vertic Endoaquept, according to the flowering of the crop, when fertilization of the
USDA classifications (Soil Survey Staff, 2014). In the ratoon traditionally begins in the region.
soils, the pH ranged from 5.2 to 6.2, the average N
contents was 0.36%, the contents of Ca, Mg, and K
were 15.8, 5.9, and 0.44 cmolc kg-1, respectively, and Experiment establishment
the P content was 8.25 mg kg-1. The micronutrient
contents (mg kg-1) in the soils were 4.35-6.67 for Cu, In the field, the soil-spatial variability was consid-
72.2-148.9 for Fe, 13.3-72.6 for Mn, 0.79-1.70 for Zn ered, establishing four in-space replicates (blocks),
(DTPA extraction), and 0.22-0.34 for B (Azomethine- with the treatments randomized within the blocks.
H method) (IGAC, 2006). The blocks were distributed based on the soil taxo-
nomic units, and each block had a complete set of
The following climatic conditions were registered treatments. Each treatment matched the unit called
during the experiment: 23.2°C minimum and 32.3°C “botalon”, which was 1563 m2 area and had 250 ba-
maximum air temperatures; 26.7°C average air tem- nana plants. Fifteen plants were selected within each
perature (with 27°C regional average); 87% relative “botalon” by height (between 1.0 and 1.5 m), forming
air humidity, which coincided with the annual aver- the experiment unit. The evaluations were performed
age; and 5 h d-1 average solar brightness, totaling 1700 after a certain number of weeks that corresponded to
h year-1. The annual precipitation was 845 mm during 50% of the plants reaching the following phases of
Vol. 15 - No. 1 - 20214 TORRES-BAZURTO / MAGNITSKIY / SÁNCHEZ
growth: vegetative growth (weeks 17-18), flower dif- for each variable; these data are presented in the ta-
ferentiation (weeks 22-23), flowering (weeks 39-40), bles. SAS 9.3 (SAS Institute, Inc.), R, and Statgraph-
bunch filling (weeks 43-44), and harvest (weeks 50- ics Centurio XV (Statpoint Technologies, Inc.) were
51). The fruit filling and harvest in the first produc- used for the data analysis.
tion cycle overlapped with the vegetative growth and
flower differentiation of the second cycle.
The sampling was done at least two weeks after the
RESULTS AND DISCUSSION
fertilizer applications. The plants were dissected into
organs and dried in oven at 65ºC for 48 h. The mi- Micronutrient accumulation in plants
cronutrient contents were quantified in the Soil and
water laboratory of the Facultad de Ciencias Agrarias, The multivariate analysis showed a significant in-
Universidad Nacional de Colombia (Bogota), using teraction between the productive cycle and fertilizer
the standardized methods of analysis (IGAC, 2006). treatment (PMICRONUTRIENTS IN BANANAS WITH DOSES OF NITROGEN 5
soils (ICA, 1992) and the absence of fertilizer appli- The micronutrient accumulation in the plants in
cations in this treatment. According to Soto (2001), both cycles differed from that found by Rodríguez
applications of phosphorus fertilizers can reduce Cu et al. (2004), Selvamani and Manivannan (2009), and
availability for plants because of the formation of Medina (2010). The differences, in most cases, were
Cu phosphates with low solubility in the soil, which for the ratio of Mn/Fe accumulation. These elements
may have happened in the other treatments, as com- are typically accumulated in Musa plants with high
pared to the absolute control. contents, as compared to other micronutrients (Soto,
2001; Jeyabaskaran et al., 2018). There were notable
For the second cycle, the accumulation of micronutri- differences from Medina (2010), who reported the
ents increased as the N doses increased (Tab. 1), with accumulation sequence Mn>Fe>Zn>B>Cu. This
a high accumulation of Zn and B at 321.8 kg N ha-1 author worked with banana cv. Williams in a Flu-
and the highest Fe and Mn contents seen with 483 kg vaquentic Eutrudepts soil, the same soil subgroup as
ha-1 of N. Regardless of the micronutrient accumu- two of the soils used in the present study (Soil Sur-
lation in the absolute control in the first cycle, the vey Staff, 2014) but with different fertilization prac-
doses 321.8 and 483 kg ha-1 N generated the highest tices (without micronutrient applications) and more
accumulation for most micronutrients in the banana favorable climatic conditions for plant cultivation,
plants (Tab. 1). A similar result was found by Nyom- which might explain the differences in the micronu-
bi et al. (2010), who applied 400 kg ha-1 N, 50 kg ha-1 P, trient accumulations.
and 600 kg ha-1 K and observed increased concentra-
tions of mineral nutrients in banana plants. Table 2 compares the micronutrient accumulation in
cv. Williams with data for banana Robusta (Walmsley
The averaged sequence of micronutrient extrac- and Twiford, 1976) and Cavendish (Lahav and Turn-
tion by plants differed between the production er, 1992). Although these three cultivars belong to the
cycles: Fe>Mn≥Zn>B>Cu in the first cycle and same subgroup, Cavendish, the plants differed in the
Fe>Cu>Mn≥Zn>B in the second one. The Cu ac- contents of micronutrients. Walmsley and Twiford
cumulation changed substantially between the cy- (1976) reported a lower accumulation of micronutri-
cles. According to Havlin et al. (2013), at low water ents than Lahav and Turner (1992) and the present
contents in the soil resulting from low precipitation, research, with the exception of Mn. The lowest Mn
the concentration of Cu in the soil solution declines, content reported by Walmsley and Twiford (1976) fit
and its adsorption by soil particles increases, which the typical interval for cv. Williams, while the highest
makes it more difficult for plants to absorb Cu than Mn content was greater than the accumulation in cv.
other nutrients. The conditions of the second cycle Williams (Tab. 2). These data indicate that micronu-
(high precipitation rate) were more favorable for Cu trient accumulation in banana plants could vary de-
availability in the soil. Therefore, the differences in pending on the cultivar, edaphoclimatic conditions,
Cu accumulation between the cycles could be attrib- and agronomic practices, such as planting density
uted to less Cu accumulation in plants under condi- and fertilization.
tions of low precipitation (the first cycle) and to a
higher accumulation of Cu in plants under more fa- The highest doses of N fertilizers generated the high-
vorable climatic conditions (the second cycle). est production (Torres, 2016) and the highest levels of
Table 2. Micronutrient accumulation in banana cv. Williams for two production cycles in Uraba vs. micronutrient accumulation
in bananas Robusta and Cavendish.
Plants Robusta Plants Cavendish
cv. Williams
Micronutrient (Walmsley and Twiford, 1976) (Lahav and Turner, 1992)
kg ha -1 year-1
Fe 2.70-49.0 1.0-1.1 5.9
Mn 1.20-1.99 1.3-8.3 12.5
Cu 0.13-2.70 0.053-0.073 0.37
Zn 1.0-2.12 0.16-0.19 4.7
B 0.34-1.37 0.17-0.34 1.27
Vol. 15 - No. 1 - 20216 TORRES-BAZURTO / MAGNITSKIY / SÁNCHEZ
micronutrient accumulation (Tab. 1). The treatments when affected by changing redox regimes in tropical
with 321.8 and 483 kg ha-1 N had better results. Soto soils (Pi et al., 2010; Osorio, 2014).
(2001) and Robinson and Galán (2012) stated that,
when increasing N doses, the absorption and accu- Corm
mulation of other mineral nutrients also increased,
with consequent increases in production. Only the model for the harvest stage revealed the
presence of significant differences (PMICRONUTRIENTS IN BANANAS WITH DOSES OF NITROGEN 7
Yang et al. (2013) used fertilizer rates of 385 kg N ha-1 (Tab. 3), while Martínez (2006) found wider ranges of
and found the lowest accumulation of nutrients in 73-880 mg Fe kg-1 and 13-182 mg Zn kg-1. Walmsley
the corm at harvest. However, in the present experi- and Twyford (1976) reported an accumulation of Fe
ment, the control, 0 kg ha-1 N, had a higher accumu- (85-153 mg kg-1) comparable to the present research,
lation of some nutrients in the corm in all stages of while the lowest level of Zn (19 mg kg-1) (Walmsley
development (Tab. 3). This result could be attributed and Twyford, 1976) was lower than found in cv. Wil-
to nutrient recycling between the mother plant and liams. These results could be attributed to differences
the ratoon. Additionally, Fe and B might see less re- in soil conditions, crop management, cultivar, and
translocation from the corm, which is one of the fertilizer doses.
main reserve organs (Galvis et al., 2013), since these
elements has low mobility in the phloem (Marschner, Pseudostem
2012).
The models revealed differences between the fertil-
The micronutrient accumulation in the corm fol- izer treatments at fruit filling (PCu>Zn>Mn>B, which dif- cumulation of Zn and at harvest (PFe>Zn>B>Cu) and Martínez (2006) Fe, Mn, and Zn in the pseudostem tended to increase
(Mn>Fe>B>Cu>Zn). The cv. Williams corm con- during plant development (Tab. 4), similar to that re-
tained 94.4-350 mg Fe kg-1 and 52.7-163.4 mg Zn kg-1 ported by Jeyabaskaran et al. (2018). Increasing rates of
Table 4. Effect of N doses on average content of micronutrients in pseudostem of banana cv. Williams.
Stage of Nitrogen dose Cu Fe Mn Zn B
development (kg ha-¹) mg kg ¹ pseudostem dry weight
-
Absolute control 71.3 532.1 165.7 68.8 35.9
0 80.2 804.5 140.4 85.8 38.8
Vegetative 161 114.8 418.9 174.9 69.7 48.7
321.8 69.8 447.4 183.0 70.4 41.7
483 122.8 445.2 169.7 68.6 44.4
Absolute control 133.4 229.6 110.4 71.5 39.2
0 81.6 152.8 103.2 59.5 35.9
Flower differentiation 161 198.1 215.3 109.2 59.1 43.3
321.8 170.5 240.4 111.5 60.1 27.4
483 172.4 228.8 132.0 65.2 44.3
Absolute control 192.4 435.3 190.5 142.0 59.9
0 212.8 326.3 252.7 151.6 46.2
Flowering 161 282.5 435.3 234.0 136.2 66.0
321.8 174.7 406.4 244.9 145.1 57.0
483 326.8 395.3 196.6 147.5 59.0
Absolute control 20.3 374.3 254.5 180.0 123.1
0 14.1 319.0 230.5 217.7 148.3
Fruit filling 161 16.1 396.5 232.7 195.7 104.7
321.8 14.9 806.0 224.8 182.5 117.8
483 16.7 383.5 248.4 202.8 119.1
Absolute control 88.7 665.4 223.8 301.3 123.4
0 19.8 691.7 230.6 241.4 117.0
Harvest 161 15.8 522.9 260.3 293.3 121.1
321.8 16.6 640.4 202.3 277.7 137.4
483 18.7 711.6 271.3 295.2 106.6
Vol. 15 - No. 1 - 20218 TORRES-BAZURTO / MAGNITSKIY / SÁNCHEZ
N, especially the doses 321.8 and 483 kg ha-1 N, had in the distribution and configuration of vascular ele-
a positive effect on micronutrient accumulation in ments in the pseudostem (Souza et al., 2016).
the pseudostem (Tab. 4). These results were similar to
those of Castillo et al. (2011), who obtained the highest Leaves
contents of mineral nutrients in the pseudostem with
doses of 375 kg ha-1 N. The nutrient accumulation models revealed signifi-
cant differences between the fertilizer treatments at
The sequence of micronutrient accumulation in the fruit filling (PCu>Zn>B at nutrients participating in the first model included
flowering to Fe>Zn>Mn>B>Cu at harvest. At both Cu, Fe, and Zn, and the second model included Cu
phenological stages, the data differed from those of and B. The micronutrients differed in their accumu-
Walmsley and Twyford (1976), Soto (2001), and Mar- lation in the leaves, with Cu contents that decreased
tínez (2006). These variations could be explained by and Mn contents that increased after flower differen-
interactions of environmental factors, soil, cultivar, tiation (Tab. 5). The descriptive analysis showed that
and crop management, especially fertilization (Rob- the N applications, especially at 321.8 and 483 kg ha-1,
inson and Galán, 2012). Additionally, the contents favored a higher accumulation of the majority of the
of elements in the pseudostem could vary between micronutrients in the leaves in all development stag-
the cultivars depending on morphological differences es, except flower differentiation (Tab. 5).
Table 5. Effect of N doses on average content of micronutrients in leaves of banana cv. Williams.
Stage of Nitrogen dose (kg Cu Fe Mn Zn B
development ha-¹) mg kg ¹ leaf dry weight
-
Absolute control 93.4 241.6 166.2 56.9 50.9
0 68.0 242.3 164.0 41.5 44.7
Vegetative 161 44.9 260.3 315.2 48.3 57.8
321.8 49.0 222.6 105.0 37.4 41.5
483 102.3 332.3 217.2 67.7 37.6
Absolute control 176.4 293.7 95.2 30.9 16.6
0 159.7 175.9 71.8 38.3 17.2
Flower differentiation 161 117.4 319.7 181.1 57.6 28.3
321.8 88.8 133.1 61.6 36.8 18.5
483 70.5 156.1 89.3 31.2 24.5
Absolute control 66.6 257.5 100.2 36.9 13.2
0 79.8 273.7 104.0 59.0 16.5
Flowering 161 45.9 227.0 111.6 28.0 12.3
321.8 147.2 288.2 101.1 54.6 16.0
483 71.6 293.8 105.3 61.1 19.4
Absolute control 47.9 202.4 258.7 27.5 20.7
0 26.6 175.5 266.3 16.1 15.4
Fruit filling 161 40.9 243.1 258.5 33.2 25.2
321.8 33.1 211.9 309.0 21.2 19.7
483 22.2 160.4 288.2 22.9 22.1
Absolute control 37.7 221.6 379.4 201.8 118.8
0 29.8 223.6 285.8 67.9 43.7
Harvest 161 39.1 226.9 376.5 166.0 85.2
321.8 38.8 263.8 316.0 145.7 75.1
483 40.1 285.9 404.9 80.8 45.7
Rev. Colomb. Cienc. Hortic.MICRONUTRIENTS IN BANANAS WITH DOSES OF NITROGEN 9
The higher doses of N (321.8 and 483 kg ha-1) mostly Bunch
contributed to the accumulation of B in the leaves, as
compared with 0 kg ha-1 N (Tab. 5). The leaf contents The model obtained at the harvest stage revealed dif-
of B and Mn could have highly significant, positive ferences between the fertilizer treatments (PFe>Cu>Zn>B, differing from the
the Mn contents decreased when increasing N doses
Mn>Fe>B>Zn>Cu reported by Walmsley and Twy-
at fruit filling, which increased at harvest (Tab. 6).
ford (1976), Soto (2001), and Martínez (2006), which
could be attributed to the cultivar and practices. The The fruits accumulated micronutrients in the se-
ranges of micronutrient accumulation in the cv. Wil- quence Fe>Cu>Zn>Mn>B, differing from the
liams leaves differed from the literature data. For ex- sequences Mn>Fe>B>Zn>Cu (Walmsley and Twy-
ample, the Mn content was 61.6-404.9 mg kg-1 leaf ford, 1976), Fe>Zn≈Mn>Cu (Forster et al., 2002),
DW (Tab. 5), while other authors reported 772-1945 and Mn>Fe>Zn>B>Cu (Yang et al., 2013); addi-
(Walmsley and Twyford, 1976) and 867 mg kg-1 leaf tionally, the contents of Cu, Zn and B in the cv. Wil-
DW (Soto, 2001). liams fruits (Tab. 6) exceeded those reported for other
cultivars (3-10.2, 4-49.2, and 9-23.6 mg kg-1 bunch for
Leaves are source organs for fruit filling (Soto, 2001). Cu, Zn, and B, respectively) (Walmsley and Twyford,
However, high doses of N could promote excessive 1976; Yang et al., 2013).
leaf growth and favor a greater accumulation of N
in leaves, i.e. plants allocate more N in leaves than in Micronutrient accumulation in fruits is important
fruit formation, resulting in low productivity (Deus for fruit formation and quality (Robinson and Ga-
et al., 2020). The increased accumulation of Mn and B lán, 2002; Pareek, 2016). Despite the differences in
in the cv. Williams leaves at the higher N doses (Tab. the micronutrient accumulation in the fruits be-
5) could be due to increased rates of leaf growth; thus, tween the N treatments during the two production
the leaves might have demanded greater amounts of cycles, these was no effect on the fruit export qual-
micronutrients for growth when stimulated by high ity in terms of postharvest fruit duration or peel
N rates. splitting (data not shown). In the tropics, banana
Table 6. Effect of N doses on average contents of micronutrients in bunches of banana cv. Williams.
Stage of Nitrogen dose (kg Cu Fe Mn Zn B
development ha-¹) mg kg-¹ bunch dry weight
Absolute control 137.7 331.6 126.1 136.0 102.8
0 232.3 300.6 139.7 156.1 103.7
Fruit filling 161 153.5 343.8 131.4 163.5 67.4
321.8 166.7 696.8 129.0 168.8 104.4
483 185.1 313.8 118.4 151.3 89.7
Absolute control 116.0 214.3 92.8 101.2 66.5
0 261.2 262.2 92.9 92.6 71.2
Harvest 161 166.9 324.9 137.8 153.6 64.6
321.8 183.2 211.9 78.1 96.4 53.5
483 142.8 267.4 133.4 125.9 69.5
Vol. 15 - No. 1 - 202110 TORRES-BAZURTO / MAGNITSKIY / SÁNCHEZ
fruits could serve as a source of micronutrients, es- Borges, A.L., S. Oliveira, R. Corrēa, and C. Silva. 2006.
pecially Mn, Fe, and Zn, for human diets (Pareek, Teores foliares de nutrientes em genótipos de bana-
2016; Ashokkumar et al., 2018). According to our re- neira. Rev. Bras. Frutic. 28(2), 314-318. Doi: 10.1590/
S0100-29452006000200036
sults, increasing the rates of N applications favored
to the accumulation of the majority of the micro- Castillo, A.M., J.A. Hernández, E. Avitia, J. Pineda, L.A. Val-
nutrients in the cv. Williams fruits. More research déz, and T. Corona. 2011. Extracción de macronutrien-
tes en banano ‘Dominico’ (Musa spp.). Rev. Int. Bot.
should be conducted for more than two cycles to
Exp. 80, 65-72. Doi: 10.32604/phyton.2011.80.065
assess micronutrient accumulation and distribution
Deus, J.A., J.C.L. Neves, A.J.D. Lima Neto, W. Natale, V.
in banana plants with ratoons from three or more
V.H. Alvarez, and F.M. Albuquerque. 2020. Partitio-
generations. ning of macronutrients and nutritional efficiency in
fertigated Prata banana. Rev. Bras. Frutic. 42(4), e-611.
Doi: 10.1590/0100-29452020611
CONCLUSIONS Forster, M.P., E. Rodriguez, J.D. Martián, and C.D. Romero.
2002. Statistical differentiation of bananas according
Increasing the doses of N fertilizer in the two pro- to their mineral composition. J. Agric. Food Chem.
duction cycles increased the levels of micronutrient 50(21), 6130-6135. Doi: 10.1021/jf0255578
accumulation in the cv. Williams banana plants, in- Galvis, F., A. Uribe, G. Cayón, S. Magnitskiy, and J.S. He-
cluding the fruits. The better rates of N fertilizers for nao. 2013. Effect of fertilizer insertion in the harves-
the highest accumulation of Cu, Fe, Mn, Zn, and B in ted mother banana plant pseudostem (Musa AAA
Simmonds). Agron. Colomb. 31(1), 103-111.
the plants were 321.8 and 483 kg ha-1 N.
Guimarães, G.G.F., R.R. Cantú, R.F. Scherer, A.B. Beltra-
The averaged sequences of micronutrient extrac- me, and M.M.D. Haro. 2020. Banana crop nutrition:
insights into different nutrient sources and soil ferti-
tion by whole plants differed between the produc-
lizer application strategies. Rev. Bras. Ciênc. Solo 44,
tion cycles: Fe>Mn≥Zn>B>Cu in the first cycle e0190104. Doi: 10.36783/18069657rbcs20190104
and Fe>Cu>Mn≥Zn>B in the second one. The se-
Gutiérrez, D.P., V.H. Nauzan, and G.A. Díaz. 2017. The effi-
quence of micronutrient accumulation in the organs
ciency wages in the Urabá banana sector-Colombia.
was organ-specific and varied in each organ, depend- Rev. Econ. Caribe 20, 7-26.
ing on the stage of development.
Havlin, J.L., S.L. Tisdale, W.L. Nelson, and J.D. Beaton.
2013. Soil fertility and fertilizers: An introduction to
Conflict of interests: The manuscript was prepared nutrient management. 8th ed., Pearson Prentice Hall,
and reviewed with the participation of the authors, NJ.
who declare that there exists no conflict of interest ICA, Instituto Colombiana Agropecuario. 1992. Fertiliza-
that puts at risk the validity of the presented results. ción en diversos cultivos. Quinta aproximación. Ma-
nual Técnico No. 25. Mosquera, Colombia.
IGAC, Instituto Geográfico Agustín Codazzi. 2006. Manual
de métodos analíticos de laboratorio de suelos. 6th ed.
BIBLIOGRAFIC REFERENCES Bogota.
Alcaraz, J.J. and J.G. Jiménez. 2018. La aplicación de la agri- Jeyabaskaran, K.J., R. Pitchaimuthu, and S. Uma. 2018. As-
cultura de precisión en el proceso de fertilización: un sessing nutrient uptake pattern with respect to dry
caso de estudio para el sector bananero del Urabá-An- matter accumulation in Ney Poovan (AB) banana at
tioqueño. MSc thesis. Program in Applied Economy, critical growth stages. Indian J. Hortic. 75(3), 405-410.
Universidad EAFIT, Medellin, Colombia. Doi: 10.5958/0974-0112.2018.00069.5
Arantes, A.D.M., S.L. Donato, D.L.D. Siqueira, E.P. Amo- Johnson, R. and D. Wichern. 2007. Applied multivariate
rim, and V.A. Rodrigues Filho. 2016. Chlorophyll index statistical analysis. 6th ed. Prentice Hall, Upper Saddle
for real-time prediction of nutritional status of ‘Prata’ River, NJ.
banana. Rev. Bras. Eng. Agríc. Ambient. 20(2), 99-106.
Keshavan, G., M. Kavino, and V. Ponnuswami. 2014. In-
Doi: 10.1590/1807-1929/agriambi.v20n2p99-106
fluence of different nitrogen sources and levels on yield
Ashokkumar, K., S. Elayabalan, V.G. Shobana, P. Sivakumar, and quality of banana (Musa spp.). Arch. Agron. Soil
and M. Pandiyan. 2018. Nutritional value of cultivars Sci. 57(3), 305-315. Doi: 10.1080/03650340903302286
of Banana (Musa spp.) and its future prospects. J.
Kumar, S., P. Kumawat, and M. Suman. 2020. A review on
Pharmacog. Phytochem. 7(3), 2972-2977.
role of micronutrients on banana, mango and pome-
AUGURA. 2020. Coyuntura bananera 2019. Medellin, granate. Int. J. Pure Appl. Biosci. 8(1), 190-198. Doi:
Colombia. 10.18782/2582-2845.7949
Rev. Colomb. Cienc. Hortic.MICRONUTRIENTS IN BANANAS WITH DOSES OF NITROGEN 11
Lahav, E. and D. Turner. 1992. Fertilización del banano para hoja en el cultivo del plátano Hartón. Bioagro 16(1),
rendimientos altos. 2nd ed. Inpofos Boletín 7, Quito. 39-46.
Liu, F., I. Lin, I. Zhang, X. Fan, and S. Sun. 2019. Effects of Sánchez, T.J.D. and J. Mira. 2013. Principios para la nutri-
N deficiency and resupply of N nutrient on banana ción del banano. AUGURA; Cenibanano, Medellin,
growth and root morphological parameters. J. Fruit Colombia.
Sci. 1, 1-9.
Selvamani, P. and K. Manivannan. 2009. Effect of organic
Marschner, H. 2012. Mineral nutrition of higher plants. 3rd manures, inorganic fertilizers and biofertilizers on the
ed. Academic Press, San Diego, CA. nutrient concentration in leaves at different growth
Martínez, A. 2006. Dinámica de la distribución de nutrien- stages of banana cv. Poovan. J. Phytol. 1(6), 381-387.
tes durante el desarrollo de la planta de banano (Musa Soil Survey Staff. 2014. Keys to soil taxonomy. 12th ed.
AAA Simmonds cvs. Gran Enano y Valery). MSc the- USDA Soil Conservation Service, Washington, DC.
sis, Facultad de Agronomía, Universidad Nacional de
Colombia, Bogota. Souza, B.P.D., E.D.B. Silva, M. Cruz, M.D. Céu, E.P.
Amorim, and S.L.R. Donato. 2016. Micronutrients
Medina, L. 2010. Curvas de absorción de nutrientes en una deficiency on the nutritional status of banana Pra-
plantación establecida de banano (Musa AAA). cv ta seedlings. Rev. Bras. Frutic. 38(3), e-884. Doi:
Williams, pp. 314-321. In: Gracía, N.L. and J.J. Mira. 10.1590/0100-29452016884
(eds.). Proc. XIX Congreso de Acorbat, Medellin,
Colombia. Soto, M. 2001. Banano: Técnicas de producción. Universi-
dad de Costa Rica, San Jose.
Nyombi, K., P.J. Van Asten, M. Corbeels, G. Taulya, P.A.
Leffelaar, and K.E. Giller. 2010. Mineral fertilizer res- Torres, J. 2016. Absorción, distribución y acumulación de
ponse and nutrient use efficiencies of East African nitrógeno en banano variedad Williams en dos ciclos
highland banana (Musa spp., AAA-EAHB, cv. Kisan- de producción en zona húmeda tropical. PhD thesis.
sa). Field Crops Res. 117(1), 38-50. Doi: 10.1016/j. Facultad Ciencias Agrarias, Universidad Nacional de
fcr.2010.01.011 Colombia, Bogota.
Osorio, N.W. 2014. Manejo de los nutrientes en suelos del Torres, J., S. Magnitskiy, and J.D. Sánchez. 2019. Effect of
trópico. 2nd ed. L. Vieco, Medellin, Colombia. fertilization with N on height, number of leaves, and
leaf area in banana (Musa AAA Simmonds, cv. Wi-
Pareek, S. 2016. Nutritional and biochemical composition lliams). Rev. Colomb. Cienc. Hortic. 13(1), 9-17. Doi:
of banana (Musa spp.) cultivars. pp. 49-81. In: Sim- 10.17584/rcch.2019v13i1.8440
monds, M. and V.R. Preedy (eds.). Nutritional com-
position of fruit cultivars. Academic Press, New York, Turner, D.W., D.J. Gibbs, W. Ocimati, and G. Blomme.
NY. Doi: 10.1016/B978-0-12-408117-8.00003-9 2020. The suckering behaviour of plantains (Musa,
AAB) can be viewed as part of an evolved reproduc-
Perea, M. 2003. Biotecnología: Bananos y plátanos. Editora tive strategy. Sci. Hortic. 261, 108975. Doi: 10.1016/j.
Guadalupe, Bogota. scienta.2019.108975
Pi, N., N.F.Y. Tam, and M.H. Wong. 2010. Effects of was- Villaseñor, D., R.D.M. Prado, G.P. Silva, M. Carrillo,
tewater discharge on formation of Fe plaque on root and W. Durango. 2020. DRIS norms and limi-
surface and radial oxygen loss of mangrove roots. ting nutrients in banana cultivation in the South
Environ. Pollut. 158(2), 381-387. Doi: 10.1016/j. of Ecuador. J. Plant Nutr. 43(18), 2785-2796. Doi:
envpol.2009.09.004 10.1080/01904167.2020.1793183
Red Agricola. 2020. Retos y desafíos del sector bananero Walmsley, D. and I.T. Twyford. 1976. The mineral compo-
colombiano. https://www.redagricola.com/co/re-
sition of the Robusta banana. V. Sulphur, iron, man-
tos-y-desafios-del-sector-bananero-colombiano/; con-
ganese, boron, zinc, copper, sodium and aluminium.
sulted: August, 2020.
Plant Soil 45, 595-611. Doi: 10.1007/BF00010582
Robinson, J.C. and V. Galán. 2012. Plátanos y bananos. 2nd
Yang, B., L. Yao, G. Li, C. Zhou, Z. He, and S. Tu. 2013.
ed. Mundi-Prensa, Madrid.
Absorption, accumulation and distribution of mine-
Rodríguez, V., E. Malavolta, A. Sánchez, and O. Lavoran- ral elements in plantain banana. J. Plant Nutr. Fertil.
ti. 2004. Balance nutricional de referencia de suelos y 19(6), 1471-1476.
Vol. 15 - No. 1 - 2021You can also read