PubViz: Lightweight Visual Presentation of Publication Data
←
→
Page content transcription
If your browser does not render page correctly, please read the page content below
Eurographics Conference on Visualization (EuroVis) 2017 Short Paper
B. Kozlíková, T. Schreck, and T. Wischgoll
(Guest Editors)
PubViz: Lightweight Visual Presentation of Publication Data
A. Rind, A. Haberson, K. Blumenstein, C. Niederer, M. Wagner, and W. Aigner
Institute of Creative\Media/Technologies, St. Pölten University of Applied Sciences, Austria
Abstract
Publications play a central role in presenting the outcome of scientific research but are typically presented as textual lists,
whereas related work in visualization of publication focuses on exploration – not presentation. To bridge this gap, we conducted
a design study of an interactive visual representation of publication data in a BibTeX file. This paper reports our domain and
problem characterization as well as our visualization design decisions in light of our user-centered design process including
interviews, two user studies with a paper prototype and a d3.js prototype, and practical application at our group’s website.
Categories and Subject Descriptors (according to ACM CCS): Information Interfaces and Presentation [H.5.2]: User Interfaces—
Graphical user interfaces
1. Introduction In an initial phase, we conducted interviews with six university
employees to specify the context of use and to derive requirements.
One’s publications are probably the most vital assets for early stage
The interviews were conducted at their workspace to gain a deeper
and senior researchers alike. Despite their central role as scien-
insight into their natural working environment. The main aims of
tific track record, publication lists of a single researcher or research
these interviews were to estimate the general need for the visual-
groups are still commonly represented as textual lists. These can,
ization of publication data, find essential expectations on such a
for example, be grouped by the type of publication or sorted by
tool, and identify the most important data in a publication list. The
year of publication. However, the representation itself as well as
results of the first stage are presented in more detail in Section 3.
the level of interactivity for online versions are rather limited.
Based on analysis of the outcome of the conducted interviews,
This paper is a design study [SMM12] that presents the domain
representative BibTeX data, and related work (Section 4), we
and problem characterization, conceptual design, and implemen-
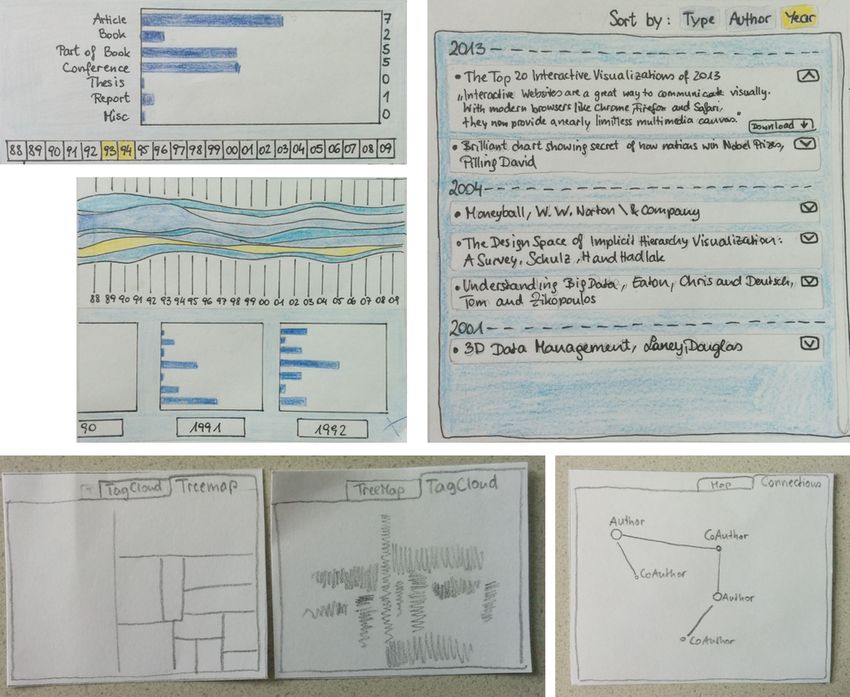
sketched possible visualizations of publication data (Figure 1). In
tation of an interactive visual representation of publication data
this early development stage, we performed a formative usability
called PubViz. The designed representations are interactive and co-
evaluation [TQ05] of a Wizard of Oz [Nie93] setting with six sub-
ordinated, focusing on different aspects such as development over
jects to find out which visualizations are most suitable (Figure 2).
time, publication type distribution, co-authors, and keywords. In-
put data is given in the established BibTeX format [Pat10] and the Following the formative user study a high-fidelity prototype was
interactive views are implemented based on standard web technolo- developed and validated in the form of a usability study [Nie93]
gies such as d3.js [BOH11] in order to be easily embeddable into with four test persons of the target group. The main goal of the
webpages. PubViz is available as free and open source software on usability study was to get feedback from users and notice usability
GitHub [HC17]. problems previously unknown.
The main contributions of the paper at hand are 1) a systematic Afterwards, we deployed the software on the website of our re-
domain and problem characterization manifested in concrete per- search group (Section 6) and have been using it for several months
sonas and scenarios that may be used for further work in the area, by the time of publication.
2) a specific visualization and interaction design along with 3) em-
pirical evidence collected in the course of a user-centered design 3. Users, Tasks, and Data
process and 4) an open and reusable implementation in JavaScript.
In our initial problem characterization, we identified three dis-
tinct goals for visualization of publications and developed a per-
2. Design Method and Evolution sona [CRC07] for each:
For the design of PubViz, we used a four-level user-centered de- Autobiographical Presentation: Scientists have a high interest to
sign process [RSP15], iteratively involving persons from the target make their own publications as visible as possible. On the one
audience throughout the process. hand, they want their research results to be found, applied, and
c 2017 The Author(s)
Eurographics Proceedings c 2017 The Eurographics Association.
The definitive version is available at http://diglib.eg.org/ .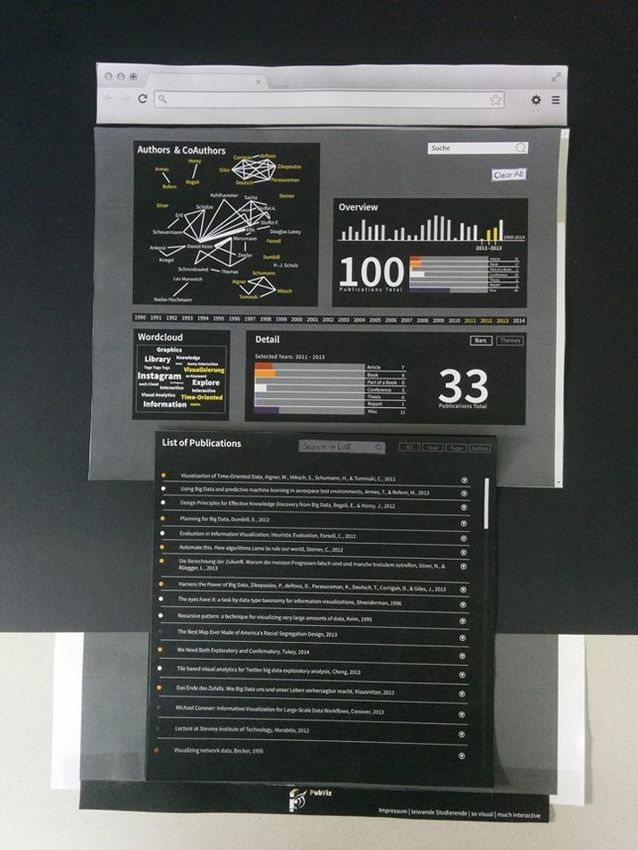
Rind, Haberson, Blumenstein, Niederer, Wagner, & Aigner / PubViz: Lightweight Visual Presentation of Publication Data

                                                                                Julia Mischalek, the second persona, is a 32-year-old organiza-
                                                                                tional assistant at a small university, where she is responsible
                                                                                for publication lists on the website and various reports. Since
                                                                                she receives publication data in various formats, she maintains
                                                                                a Zotero database. Seeing the results of her drudgery in PubViz
                                                                                increases her motivation, also the scientific staff is more engaged
                                                                                to use the lists, e.g., to find internal collaborators. Finally, Julia
                                                                                can export charts from PubViz and use them in printed reports.
                                                                              Exploration: Scientists also collect publication lists and analyze
                                                                                them in order to find previously unknown literature, identify key
                                                                                experts, and get a general overview of a field of research.
                                                                                Hans Peter Guggel, the third persona, is a 20-year-old bachelor
                                                                                student, who uses PubViz to find a topic and a supervisor for his
                                                                                thesis based on the BibTeX data available from his university.
                                                                              Overall, the users are scientists, students, or other members of a
                                                                              scientific organization. While the exploration goal is supported by
                                                                              various related work, we identified an unaddressed need for a well-
                                                                              designed but easy-to-setup visual presentation of publication lists.
      Figure 1: First round of UI and visualization sketches.                    For a minimal setup effort for users, we decided to use the Bib-
                                                                              TeX file format [Pat10] for input of publication data. With a his-
                                                                              tory of more than 30 years, the BibTeX file format is now a de-
                                                                              facto standard for scientific publications and is widely supported
                                                                              by tools and websites. BibTeX stores publication data in a specific
                                                                              plain text format. One publication item is described by a publi-
                                                                              cation type, a citation key, and key-value pairs for various bibli-
                                                                              ographic attributes. There are a number of publication types such
                                                                              as article or book. Depending on the publication type, different at-
                                                                              tributes are required or optionally allowed such as authors, journal,
                                                                              pages, URL, etc.
                                                                                 To determine, which bibliographic attributes should have priority
                                                                              in our visualization, we made episodical observations from analyz-
                                                                              ing 99 items in a representative BibTeX file and the initial inter-
                                                                              views of 6 subjects. Authors, title, and publication year were most
                                                                              important to our 6 subjects and also available in most of the ex-
                                                                              ample data. URLs were also frequently available in the data and
                                                                              regarded as rather important. Abstract and keywords were rather
                                                                              important but missing for more than half of the items. Citations had
                                                                              average importance as well, but are not available in BibTeX. Edi-
                                                                              tion, publisher, country of origin, and location were answered as
                                                                              least important. However, our subjects stated that a solution should
             Figure 2: Wizard of Oz paper prototype.                          also contain a common list of the complete bibliographic records
                                                                              for the case that a visitor is unwilling to use other interaction.
                                                                                 It should, however, be noted that various tools use BibTeX with
  cited. On the other hand, their publication record can be a key             different type or attribute names. We consolidated the different
  asset in finding collaboration partners and in gaining funding.             attributes to publication type, year, authors, keywords, title, jour-
  Sigrid Zippelin, the first persona, is a 47-year-old university pro-        nal/book title, pages, abstract, URL. Furthermore, we merged pub-
  fessor and department head in IT security. On the occasion of               lication types to 7 categories: article, book, part of book, confer-
  giving a conference keynote, she creates an appealing landing               ence, thesis, report, misc. This data transformation resulted in a
  page for her research with PubViz. She has her publication data             table dataset structure with publications items as rows and biblio-
  available in Zotero [Roy17] and can export it as BibTeX. Her                graphic attributes as columns [Mun14].
  busy schedule would not allow her to use a more complex tool
  or develop a professional solution herself.
                                                                              4. Related Work
Presentation by Third Parties: Academic institutions, funding
  bodies, scientific societies, and many other third parties typi-            Scientific publications are an interesting data source for visual-
  cally report publication lists prominently to represent their com-          ization research: Not only do they allow for retrospection of the
  petence and/or scientific impact.                                           scientific community (e.g., [FGP04, HGEF07, XSSS14, IHK∗ 16,

                                                                                                                                             c 2017 The Author(s)
                                                                                                      Eurographics Proceedings c 2017 The Eurographics Association.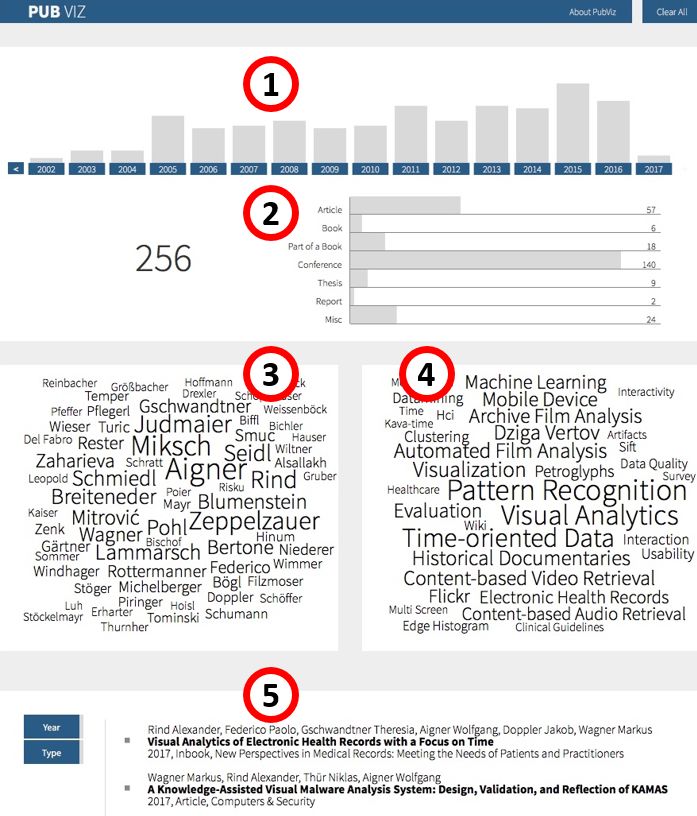
Rind, Haberson, Blumenstein, Niederer, Wagner, & Aigner / PubViz: Lightweight Visual Presentation of Publication Data

IIS∗ 17]), but they also offer multiple data facets such as time, text,
or undirected networks of co-authors, and directed networks of ci-
tations, and sets of keywords [BKW16, FHKM16].
   Many solutions focus on citations. For example, Vis-
Navi [SMM13] browse a citation graph starting from a seed pa-
per in a hyperbolic tree. CiteVis [SCH∗ 13] shows a paper col-
lection and applies interactive highlighting for citations. Impact
glyphs [MML16] provide a dense representation of a paper’s ref-
erences and citations. PaperQuest [PEM16] supports reading de-
cisions based on citation metrics and previously selected “core”
publications. CiteRivers [HHKE16] combines the analysis of ci-
tation patterns with topics extracted from the publications’ text
in a multiple coordinated views. Van Ham [vH04] and Burch et
al. [BPW15] presented two solutions to explore publications by
keywords and discover topical clusters based on analytical pre-
processing. KeyVis [IIS∗ 17] was designed to find related work
based on keywords and make informed keyword choices for fu-
ture publications. ScholarTree [FCM16] uses a botanical metaphor
for the dynamic network of a scientist’s co-authors. For this it
represents sophisticated features like first authorship and tiers of
venues. Keshif [YEB16] is a general purpose solution for brows-
ing and filtering of table data that has also been demonstrated with
the publication record of Ben Bederson [Bed17]. SurVis [BKW16]
is specialized solution to present and analyze scientific literature
that was designed for authors of state-of-the-art reports to curate
and present their references. It includes keywords, authors, cita-
tions, publication clustering, teaser images, and flexible selectors.              Figure 3: Illustration of the high-fidelity prototype including: 1)
For more solutions, a recent survey on literature and patent visual-               temporal bar charts for number of publications by year; 2) on the
ization [FHKM16] may be consulted.                                                 left the overall number of publications, and on the right a bar chart
                                                                                   to break down the count based on publication types; 3) a word
                                                                                   cloud of authors; 4) a word cloud of keywords; and 5) the con-
Discussion. Existing solutions do not address the presentation
                                                                                   tained publications which can be sorted by year and by type.
goals characterized above. Visualizations like PaperQuest or Ci-
teRivers are designed for users willing to invest time for training
and exploration. Other visualizations like CiteVis or ScholarTree                    revealed that the bar chart was more understandable. During fur-
can be used for presentation but focus on overview of some aspects                   ther deployment, we added temporal scrolling, if the covered
but do not include publication list, which our test persons need for                 time span gets too long.
unengaged visitors. Even well-designed and usable solutions like                   Publication Types: A horizontal bar chart (Figure 3:2) shows
Keshif or SurVis might be too overloaded for visitors of an auto-                    how different types of publications compare to each other. We
biographical presentation. Another issue is setup effort for the user                grouped some types together to reduce the space needed.
curating the visualization. For example, Keshif requires data as a                   In the early designs, we intended to encode publication type by
spreadsheet or with a custom conversion code or SurVis needs the                     color hue in various other views. However, this conflicted with
curator to run a Python script for BibTeX preprocessing.                             the color used for highlighting and we decided that communicat-
                                                                                     ing filter state clearly has higher priority. Furthermore, PubViz
                                                                                     also shows the total number of publications in a central position
5. Visualization Design                                                              (to the left of the publication type bars).
                                                                                   Authors: A word cloud [VW08] (Figure 3:3) shows the names of
Guided by the interviews and inspired by existing solutions (e.g.,
                                                                                     the publications’ authors with a font size based on each author’s
[Bed17]) as well as collections of visualizations for presentation
                                                                                     publication count. In the trade-off between an aesthetically opti-
purposes, we produced several iterations of sketches, paper proto-
                                                                                     mized layout and searchability, we settled for a non-sorted layout
types, and finally a functional prototype [KKUW07, p. 50] using
                                                                                     with horizontal words only that do not change their position on
d3.js [BOH11]. We collected further user feedback in two rounds
                                                                                     interaction. If the publication list contains too many authors only
of usability tests. Next, we will explain our design decisions based
                                                                                     the top authors are shown.
on the final prototype as shown in Figure 3:
                                                                                     Initially, we planned a node-link diagram to emphasize co-
Time: A bar chart of the number of works published each year                         authorship with edges of different thickness. However, when
  (Figure 3:1) provides a temporal overview. We experimented                         tested with representative data, this network view was too clut-
  with various visualization methods [AMST11] such as a stream                       tered – in particular for the limited space available.
  graph [BW08] of publication types but the Wizard of Oz test                      Keywords: Another word cloud (Figure 3:4) represents the fre-

 c 2017 The Author(s)
Eurographics Proceedings c 2017 The Eurographics Association.
Rind, Haberson, Blumenstein, Niederer, Wagner, & Aigner / PubViz: Lightweight Visual Presentation of Publication Data
quency of the top keywords in the publication list. While the
initial interviews did not yield keywords among the most impor-
tant attributes, the Wizard of Oz and the prototype test revealed
that the keyword word cloud was a very useful and well accepted
feature by the subjects.
Complete Records: A scrollable list (Figure 3:5) in the bottom
of the page shows the bibliographic records of all publications.
Visitors can sort the list by year or by type. Each record can be
enlarged to show the abstract if present and the given URL is
available as a hyperlink. The need for such a list in addition to
various overview visualizations was raised by the subjects of the
initial interviews after we showed them Ben Bederson’s website
[Bed17] and confirmed in subsequent usability tests.
A visitor has the ability to select a bar or a word in the overview
visualizations (i.e. bar charts and word clouds) for filtering the pub-
lication list. In addition all related marks in all views are high-
lighted [Rob07]. For example, if the user clicks on one year in the
temporal bar chart (Figure 4), the bar will be highlighted, bar’s la-
bel will be displayed with bold font, the list in the bottom will be
filtered, the number of matching publications will be displayed in
front of the total number, the publication type bar chart will high-
light the proportion of work published in that year, and the word Figure 4: PubViz with all publications of the InfoVis conference
clouds will highlight authors and keywords of these filtered publi- from 1995 to 2015. The year 2004 is highlighted.
cations. It is possible to select more than one mark of a view, which
is interpreted as logical OR, and to combine selection in different was the year when posters were also included in the proceedings,
views, which is interpreted as logical AND [AS94]. which can be seen in the bar chart presentation of the publication
types (posters are listed as ‘misc’). However, deeper exploration of
The usability of coordinated filtering was a focus of our user subsets of records is not possible as the design of PubViz is opti-
studies. Since we cannot expect visualization training from visi- mized for presentation to untrained visitors.
tors of the publication lists, we settled for relatively weak filtering
possibilities. To make the selection state recognizable while main-
taining an aesthetic overall appearance, we encode the selection of 7. Conclusions
marks with a bold font only. Furthermore, we added a “clear all” Scientific researchers want to present their publication record in
button in the top right corner that resets all selections. more accessible way than as a long list of textual references. We
conducted a visualization design study to develop a visually ap-
6. Application Examples pealing and easy-to-setup solution. PubViz takes the established
BibTeX format as input, uses the widely known visualization meth-
To show how PubViz can be used, we demonstrate it for presenting ods bar charts and word clouds, and provides interactive filtering
our own publications and exploring a body of literature. options. Two rounds of user studies with a Wizard of Oz paper pro-
totype and a functional d3.js prototype as well as a long-term ap-
Presenting Own Publications. As a research group or a single plication at our research group website serve as validation for our
researcher, PubViz can be used to present an overview of your pub- design decisions – in particular the interactive filtering concept did
lications having an easy way to explore all publications visually. not cause any usability problems. Our long-term application fur-
An example is the visualization of publications of a research group thermore showed that PubViz works well for a scale of 25 to 250
[Res17]. The dataset includes 256 items. PubViz is connected to publications. Thus, it meets the real-world need of autobiographical
the content management system Drupal via a live BibTeX export presentation for individuals, projects, or small research groups.
which makes it maintainable in the long-term. In addition, the site
uses URL filters via GET parameters (e.g., f[author]) to prefilter Supplementary Materials. Research data, software, and reusable fig-
the whole dataset for showing the publications for a specific author. ures can be found at http://phaidra.fhstp.ac.at/o:1933.
Exploring Literature. For testing the scalability of PubViz, we Acknowledgements. We thank M. Fabi, S. Rasul, E. Schnaitt, and
used data from the ‘vispubdata’ project [IHK∗ 16]. PubViz can P. Theisen from the initial development team; G. Rottermanner and N. Thür
open the complete dataset and provide an overview of its 2,753 for technical support; A. Hannauer and P. Federico for literature research;
records but interactions are slow on a standard office computer (In- as well as the test persons. This work was partially supported by the Aus-
tel Core i5-3230M; Chrome 57). It has acceptable reaction times for trian Science Fund (FWF) via the KAVA-Time and VisOnFire projects (no.
a prefiltered subset of all 647 publications of the InfoVis conference P25489 and P27975) and the Austrian Ministry for Transport, Innovation
(from 1995 up to 2015). Here we can recognize in the temporal bar and Technology (BMVIT) under the ICT of the future program via the
chart that publication count peaked in 2004 (Figure 4) [Rin17]. This VALiD project (no. 845598).
c 2017 The Author(s)
Eurographics Proceedings c 2017 The Eurographics Association.Rind, Haberson, Blumenstein, Niederer, Wagner, & Aigner / PubViz: Lightweight Visual Presentation of Publication Data
References [MML16] M AGUIRE E., M ONTULL J. M., L OUPPE G.: Visualization
of publication impact. In Proc. EuroVis 2016 – Short Papers (2016),
[AMST11] A IGNER W., M IKSCH S., S CHUMANN H., T OMINSKI C.: Bertini E., Elmqvist N., Wischgoll T., (Eds.), Eurographics Association,
Visualization of Time-Oriented Data. Springer, London, 2011. doi: pp. 103–107. doi:10.2312/eurovisshort.20161169. 3
10.1007/978-0-85729-079-3. 3
[Mun14] M UNZNER T.: Visualization Analysis and Design. AK Pe-
[AS94] A HLBERG C., S HNEIDERMAN B.: Visual information seek- ters/CRC, Boca Raton, 2014. 2
ing: Tight coupling of dynamic query filters with starfield displays. In
Proc. SIGCHI Conf. Human factors in computing systems (1994), ACM, [Nie93] N IELSEN J.: Usability Engineering. Morgan Kaufmann Publish-
pp. 313–317. doi:10.1145/191666.191775. 4 ers Inc., San Francisco, CA, USA, 1993. 1
[Bed17] B EDERSON B.: Ben Bederson’s publication, 2017. ac- [Pat10] PATASHNIK O.: bibtex – process bibliographies for LaTeX, etc,
cessed: 2017-02-26. URL: https://www.cs.umd.edu/users/ 2010. accessed: 2017-02-26. URL: https://www.ctan.org/
bederson/papers/. 3, 4 pkg/bibtex. 1, 2
[BKW16] B ECK F., KOCH S., W EISKOPF D.: Visual analysis and dis- [PEM16] P ONSARD A., E SCALONA F., M UNZNER T.: PaperQuest: A
semination of scientific literature collections with SurVis. IEEE Trans. visualization tool to support literature review. In Proc. CHI Conf. Ex-
Visualization and Computer Graphics 22, 1 (Jan. 2016), 180–189. doi: tended Abstracts Human Factors in Computing Systems, CHI EA (2016),
10.1109/TVCG.2015.2467757. 3 ACM, pp. 2264–2271. doi:10.1145/2851581.2892334. 3
[BOH11] B OSTOCK M., O GIEVETSKY V., H EER J.: D3: Data-driven [Res17] R ESEARCH G ROUP M EDIA C OMPUTING: Publications of Me-
documents. IEEE Trans. Visualization and Computer Graphics 17, 12 dia Computing Research Group, 2017. accessed: 2017-02-26. URL:
(2011), 2301–2309. doi:10.1109/TVCG.2011.185. 1, 3 http://mc.fhstp.ac.at/pubviz. 4
[Rin17] R IND A.: Publications at InfoVis conferences from 1995 to 2015,
[BPW15] B URCH M., P OMPE D., W EISKOPF D.: An analysis and vi-
2017. accessed: 2017-04-24. URL: http://alex-rind.github.
sualization tool for DBLP data. In Proc. 19th Int. Conf. Information
io/PubViz/?ieee-vis-infovis.bib. 4
Visualisation (2015), pp. 163–170. doi:10.1109/iV.2015.38. 3
[Rob07] ROBERTS J. C.: State of the art: Coordinated & multiple views
[BW08] B YRON L., WATTENBERG M.: Stacked graphs – geometry &
in exploratory visualization. In Proc. Conf. Coordinated and Multiple
aesthetics. IEEE Trans. Visualization and Computer Graphics 14, 6
Views in Exploratory Visualization, CMV (2007), pp. 61–71. doi:10.
(Nov. 2008), 1245–1252. doi:10.1109/TVCG.2008.166. 3
1109/CMV.2007.20. 4
[CRC07] C OOPER A., R EIMANN R., C RONIN D.: About Face 3: The [Roy17] ROY ROSENZWEIG C ENTER FOR H ISTORY AND N EW M EDIA:
Essentials of Interaction Design. Wiley, Indianapolis, IN, USA, 2007. 1 Zotero, 2017. accessed: 2017-02-26. URL: https://www.zotero.
[FCM16] F UNG T. L., C HOU J. K., M A K. L.: A design study of per- org/. 2
sonal bibliographic data visualization. In Proc. IEEE Pacific Visual- [RSP15] ROGERS Y., S HARP H., P REECE J.: Interaction Design: Be-
ization Symp. PacificVis (Apr. 2016), pp. 244–248. doi:10.1109/ yond Human-Computer Interaction, 4 ed. John Wiley & Sons, Chich-
PACIFICVIS.2016.7465279. 3 ester, UK, 2015. 1
[FGP04] F EKETE J.-D., G RINSTEIN G., P LAISANT C.: IEEE InfoVis [SCH∗ 13] S TASKO J., C HOO J., H AN Y., H U M., P ILEGGI H.,
2004 Contest, the history of InfoVis, 2004. accessed: 2017-02-26. URL: S ADANA R., S TOLPER C. D.: CiteVis: Exploring conference paper ci-
http://www.cs.umd.edu/hcil/iv04contest/. 2 tation data visually. In Poster Proc. IEEE InfoVis (2013). 3
[FHKM16] F EDERICO P., H EIMERL F., KOCH S., M IKSCH S.: A survey [SMM12] S EDLMAIR M., M EYER M., M UNZNER T.: Design study
on visual approaches for analyzing scientific literature and patents. IEEE methodology: Reflections from the trenches and the stacks. IEEE Trans.
Trans. Visualization and Computer Graphics (2016). Published online Visualization and Computer Graphics 18, 12 (Dec. 2012), 2431–2440.
16 Sep 2016. doi:10.1109/TVCG.2016.2610422. 3 doi:10.1109/TVCG.2012.213. 1
[HC17] H ABERSON A., C ONTRIBUTORS: PubViz. GitHub reposi- [SMM13] S AAD F., M ATHIAK B., M UTSCHKE P.: Supporting literature
tory, 2017. accessed: 2017-02-26. URL: https://github.com/ review by searching, visualizing and navigating related papers. In Proc.
fhstp/PubViz. 1 Int. Conf. Cloud and Green Computing (Sept. 2013), pp. 363–368. doi:
[HGEF07] H ENRY N., G OODELL H., E LMQVIST N., F EKETE J.-D.: 10.1109/CGC.2013.64. 3
20 years of four HCI conferences: A visual exploration. International [TQ05] T HEOFANOS M., Q UESENBERY W.: Towards the design of ef-
Journal of Human–Computer Interaction 23, 3 (Dec. 2007), 239–285. fective formative test reports. J. Usability Studies 1, 1 (Nov. 2005), 27–
doi:10.1080/10447310701702402. 2 45. 1
[HHKE16] H EIMERL F., H AN Q., KOCH S., E RTL T.: CiteRivers: Vi- [vH04] VAN H AM F.: Case study: Visualizing visualization. In Proc.
sual analytics of citation patterns. IEEE Trans. Visualization and Com- IEEE Symp. Information Visualization (Oct. 2004). doi:10.1109/
puter Graphics 22, 1 (Jan. 2016), 190–199. doi:10.1109/TVCG. INFVIS.2004.14. 3
2015.2467621. 3
[VW08] V IÉGAS F. B., WATTENBERG M.: Tag clouds and the case for
[IHK∗ 16] I SENBERG P., H EIMERL F., KOCH S., I SENBERG T., X U vernacular visualization. interactions 15, 4 (July 2008), 49–52. doi:
P., S TOLPER C. D., S EDLMAIR M., C HEN J., M ÖLLER T., S TASKO 10.1145/1374489.1374501. 3
J. T.: vispubdata.org: A metadata collection about IEEE Visualization
[XSSS14] X U P., S TOLPER C., S AINATH A., S TASKO J.: VIS 25 –
(VIS) publications. IEEE Trans. Visualization and Computer Graphics
all the papers and citations, 2014. URL: http://www.cc.gatech.
(2016). Published online 5 Oct 2016. doi:10.1109/TVCG.2016.
edu/gvu/ii/citevis/VIS25/. 2
2615308. 2, 4
[YEB16] YALÇIN M. A., E LMQVIST N., B EDERSON B. B.: Keshif:
[IIS∗ 17] I SENBERG P., I SENBERG T., S EDLMAIR M., C HEN J., Out-of-the-box visual and interactive data exploration environment. In
M ÖLLER T.: Visualization as seen through its research paper keywords. IEEE VIS Workshop on Visualization in Practice (2016). URL: http:
IEEE Trans. Visualization and Computer Graphics 23, 1 (Jan. 2017), //adilyalcin.me/academic/KeshifInPractice.pdf. 3
771–780. doi:10.1109/TVCG.2016.2598827. 2, 3
[KKUW07] K ULYK O., KOSARA R., U RQUIZA J., WASSINK I.:
Human-centered aspects. In Human-Centered Visualization Environ-
ments, Kerren A., Ebert A., Meyer J., (Eds.), LNCS 4417. Springer,
Berlin, 2007, pp. 13–75. 3
c 2017 The Author(s)
Eurographics Proceedings c 2017 The Eurographics Association.You can also read