Carbon Trading - What Is It & How Does Ag Maximize Its Potential? - Dick Wittman, Farmer/Rancher/Timber Mgr Past President, PNW Direct Seed Assn
←
→
Page content transcription
If your browser does not render page correctly, please read the page content below

Carbon Trading – What Is It &
How Does Ag Maximize Its
Potential?
                                    Presented at
                           Commodity Classic Workshop
                          Ag Coalition on Carbon Trading
                                      2/28/07

  Dick Wittman, Farmer/Rancher/Timber Mgr
  Past President, PNW Direct Seed Assn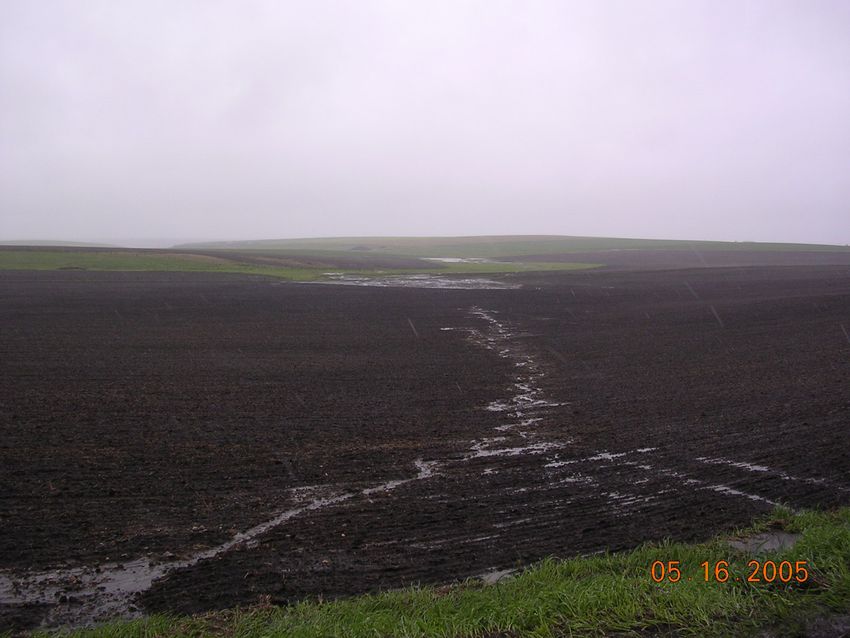
My Background...
Former Ag Lender - FCS
Partner in diversified family farm business
Farm management consultant
Farm Family Transitions and Financial Mgmt
Industry boards/affiliations
Farm Financial Standards Council – Past President
PNW Direct Seed Assn–Founder, Past President
Commodity group and bank boards
Idaho Governors Advisory Committee – Carbon
Sequestration
Environmental Defense – Ag Advisory Committee –
Climate change
Carbon Trading Overview 2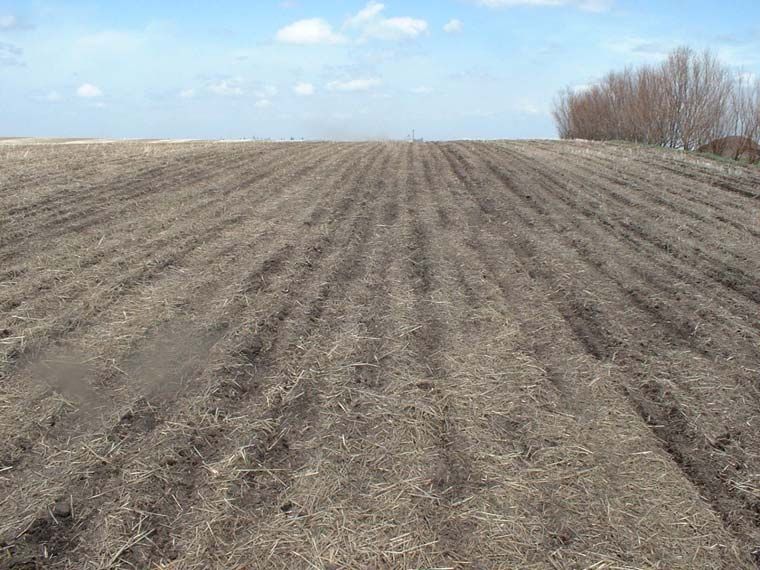
Focus of Presentation
How PNDSA got involved in carbon trading
7 years ago
How Carbon Trading Value is created
How Ag is currently marketing carbon
Players making our markets
Trends in value of carbon credits
Ag Policy framework needed for fair price
and stable trading environment
Key policy issues needing ag definition
Strategy for building “one-voice” consensus
Handouts & PPT Available: www.wittmanconsulting.com
Carbon Trading Overview 3
Quality of Life          Mission
            Business
                                    Strategic Plan                   Vision
            Structure
                                    “How we do it”
 Succession                                                              Long Range
 Planning                           Short-term Goals                     Objectives
In-source                       Financing       Marketing
Out-Source                  Operating Plan-
                                      Plan “What We Do”
                                                              Crop
                               Production Capital Plan Budget Rotation
Value-
Added                Evaluate                        Action Plans
  Strategic                            KRAs                            Diversification
  Alliances
                                                                  Environmental
                Technology                                        Stewardship
                Adoption            Tillage         Growth
 WF Version-Mike Boehlje            System
 Strategic Thinking Model
                                        Carbon Trading Overview                   4
PNDSA Formation
Organized in 1999
Key focus – information exchange
organization – promoting DS adoption
…coincidently, Kyoto process and
concerns about global climate
escalating at same time.
Carbon Trading Overview 5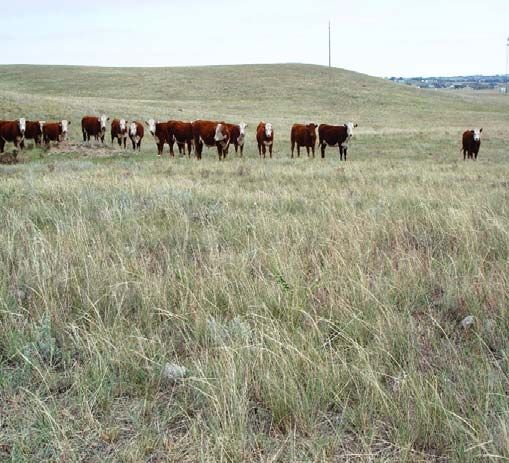
Pacific Northwest Direct Seed Association
Partners                                       Collaborators
Chem/Fert/Equip                                                     Commodity
                         Promoting economically viable
Companies                                                           Groups
                         and environmentally sound direct
Environmental
                         seed cropping systems…                     Educational
Groups                                                              Institutions
                                  PNDSA
Public Agencies                                                     STEEP III

                             … through research
Conservation                                                        Policymakers
                             coordination, funding,
Organizations                and information
                             exchange.                              Global Based
Energy                                                              Conservation
Companies                                                           Tillage Groups

                Washington            Idaho                Oregon

                                 Carbon Trading Overview                           6
Key Events that Drove Carbon
Trading Market Development
Global warming concerns
Kyoto Talks
promoted caps on emissions
Proposed eligible carbon sequestration sinks and
potential for offsets
US vs. other countries’ positions – ag vs. forestry
debate
US approach – Voluntary, not mandated interest
Global trading market in “birthing stage”
New players emerging
Lots of questions re: who will the buyers and sellers
be?
Carbon Trading Overview 7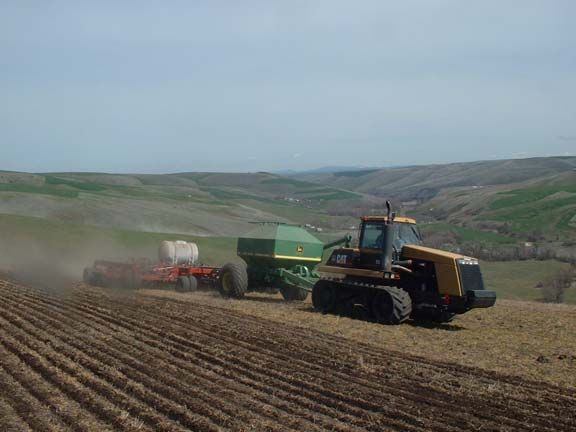
How We Got Into the Fracas
Contact from ED –
proposal to consider role as an aggregator
ED proposed role as matchmaker
Why they approached us
PNDSA policy supported programs that offered financial
incentives that encourage adoption of DS (EQIP, CSP,
PL566)
Science recognized direct seeding sequesters carbon and
builds Organic Matter
Marketing carbon credits was vehicle for monetizing
conservation benefits from DS
We had captive position with select target that made for
ideal aggregator…it was also an “IDEAL PR sell”
ED mission was to “promote market based solutions” –
didn’t want to aggregate… preferred facilitator role
Carbon Trading Overview 8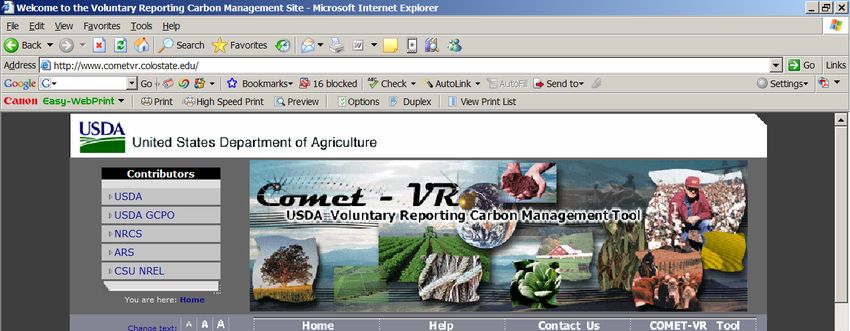
Our Learning Process…(2000-02)
Crash course on Carbon Sequestration
1st Committee: Dr Cook, Karl Kupers, Wittman
Waded through technical jungle – ERCs, RMUs,
carbon sinks, saturation, low hanging fruit, etc.
Networked with Other Experts
John Bennett, Saskatchewan Conservation
Tillage Assn, and member of Canadian
team at Kyoto
Don Reicosky, USDA-ARS, Minnesota,
internationally recognized carbon expert
Published informational document for
membership – FAQs & posted on website
Carbon Trading Overview 9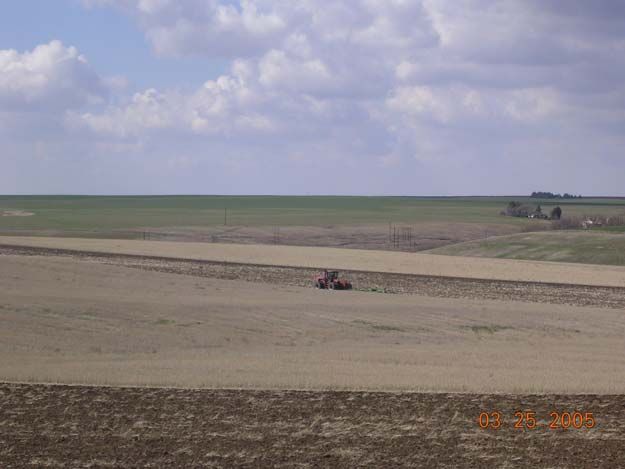
FAQs
What is carbon sequestration?
What is the unit that is traded?
Carbon Sequestration Credits
Emission Reduction Units
How much can be sequestered from
direct seeding?
How is sequestration measured?
Who are potential buyers?
Carbon Trading Overview 10FAQs (cont’d)
What drives value of Offset per T C?
Range $2.50/t US Æ$25-30/T Europe
Kinsella-$29.85Corn; $9.85 Soy; $17.85 Wheat
What are risks of selling credits?
To buyer… & to seller
How does risk impact price of ERUs?
What is duration of proposed sequestration
agreements?
What are advantages of leasing vs. selling?
Carbon Trading Overview 11…let’s start with some basics about
Carbon Sequestration
Carbon Trading Overview 12What is sequestration?
Net result of photosynthesis, plant respiration,
& tillage/residue mgmt/rotation practices
Photosynthesis:
CO2 + nutrients + sunlight + water = O + carbohydrates
Plant respiration:
O + Carbs convert to CO2, water, and energy
Results:
When photosynthesis > respiration
CO2 removed from atmosphere & stored in plant cells
…then we add impacts of tillage, residue mgmt,
rotation diversity
Carbon Trading Overview 13Where does Ag Fit as carbon sink?
4 types of sinks - atmosphere,
terrestrial biosphere (soil & plants),
oceans, and subterranean sediments
Agriculture & forestry sequestration
activity deals with terrestrial
sequestration
Carbon Trading Overview 14Terrestrial Sequestration
• Converting CO2 into biomass
– Increase soil carbon
– Rehabilitate range land
– Grow trees
– Grow microbes
• Cost effective “low hanging
fruit”
24 October 2006Economic Cost Comparisons
• Relative costs of Carbon Sequestration Solutions
– Geologic Price
– Terrestrial
• Aforestation
• Agricultural soils
Geologic
Forestry
Crop soils
Carbon
24 October 2006Why Direct Seeding/NT Getting Attention
as Global Warming Solution? Benefits
Solution to economic and
environmental sustainability:
Sequesters CO2 Æ.5T/acre/yr
Can Ç OM 0.1%/Yr.
Improves air & water quality
Improves wildlife habitat
Lower fossil fuel use
↓ 3.5gal/acre per USDA
Increases economic viability
Solution to global warming
through emission reductions and
carbon sequestration Æ 20-25%
Kyoto goalTillage leads to soil erosion (wind, water) & carbon release
…also causes degradation of air, water and wildlife quality
Å CO2 going into
atmosphere = ↓ OM
Å Habitat is GONE– both above & below ground!M = Mobile
R. = Research
MR. GEM
G = Gas
E = Exchange
M = Machine
Invisible effects of invisible forces!
Carbon Trading Overview 19Tillage + Erosion + Unhealthy Rotations Î 50% Loss Soil Organic Matter
Example: Kansas soils had native organic matter 1-4%
…current levels = 0.5 – 2%
Carbon Trading Overview 20Key Issue to Qualify for Emissions Offsets: ÆMinimal soil disturbance ÆRetention of residue on soil surface
Other Impacts of Reduced
Tillage on CO2 Emissions
Reverse tillage based emissions (3.7 tons of CO2 are released/ton of carbon that
is lost from tillage and erosion).
CO2 emissions lowered by 75% in reduced-tillage farming systems and 93% in
no-till and strip-till systems.
Reduced fuel use (est. 3-5 gal/ac) provides fossil fuel emission reductions
Æreduce 22.38# CO2 emissions/gal saved
Can raise soil organic matter (SOM) by 0.1%/year. Continuous NT/Direct Seed
could reach equilibrium in 15-20 years.
Minimizes breakdown of humus Æ increases water holding capacity and ability
to sustain soil micro-biological activity
Worldwide, 48 million hectares direct seeding at turn of century
Æ results in 134
…estimated we million tons million
need 620 of reduced CO2 per
tonnes year. (Tebrugge)
to meet Kyoto .
Æ NT/DS can solve 1/5 of problem!
QoLEvolution of Carbon Trading
PNDSA Early Experiences – Leasing
Other Early Players across globe
…BEWARE of taking ownership of bragging rights!
Somebody somewhere has done it before!!!
Current Aggregators Active in Ag
Carbon Trading Overview 23Early players in Carbon Trading
Australia/NZ
Major players early on; now almost self-
sufficient in meeting Kyoto protocol
Central & South America –
Numerous grants, small projects to promote
conservation improvement
Canada/US
GEMCO/IGR - 500,000 tons ’99 (priced at $2-
6/Ton…growers netted $.37/T)
Europe
Actively trading emissions credits
Carbon Trading Overview 24PNDSA Strategy - Carbon Trading
Educate first…negotiate deals later!
Key Policy Stance: Lease…don’t
sell…especially until we know what
we’re doing!
Result: Participated in first global
carbon lease arrangement for carbon
credits
Carbon Trading Overview 25Why Lease vs. Sale
Fixed term –
Lease allows seller to put deadline on
liability for performance
Outright sale involves indefinite time
frame to deliver performance obligation
Allows for change in conditions
Lease allows farming practices to change
if conditions warrant
Permanent sale may bind farm to current
management practices
Carbon Trading Overview 26Why Lease vs. Sell? (cont’d)
If measurement shows over time you are
an emitter, may be forced to buy credits to
deliver sequestration benefit sold.
Leasing avoids permanent conservation
easement that could reduce the future
value of the land.
From STEWARDSHIP standpoint, leasing
creates incentive for emitters to fix the
problem…vs. selling buyers a permanent
right to pollute. (Moral high ground!)
Carbon Trading Overview 27Soil Carbon Sequestration: A working contract A LEASE contract between Northwest no- till farmers and a Louisiana energy company, Entergy (4th largest energy co in US)
What the PNDSA desired:
Contract where money actually
changed hands
Cash up front
Lease arrangement
Opportunities and incentives for:
Developing future contracts
Stimulating measurement research
Financial incentives to increase
adoption of DS cropping systems
Carbon Trading Overview 29What Entergy wanted
Get Kyoto ready before mandate
comes in 2008
Long term contract: 10 year
Low price
Emission Reduction Credits in
addition to carbon sequestration
credits
Carbon Trading Overview 30The Process
ED made initial proposal to PNDSA
Agreed on Conceptual Model for lease
arrangement
ED circulated 1-page offer sheet to
potential customers desiring emissions
reductions
Entergy Co – “…let’s make a deal”
“Looking toward tomorrow”
Building an offset forest
Promoting a stewardship image with
constituents
Carbon Trading Overview 31Process (cont’d)
PNDSA developed contract with growers
Definition of DS; requirements and penalties
Eligible acres: DS before 2002; CRP excluded
Grower contracts completed by November
2002
Money transferred to producers through
PNDSA
Annual verifications performed by NRCS
Carbon Trading Overview 32Eligibility & Protocols*
#1 - Must be member of PNDSA
* Acres meet definition of direct seeding
Planting and fertilizing with no prior
tillage to prepare soil
Can be one or two pass
* No burning during lease term
* Pay back feature if tilled before 2012
* If leased acres out of compliance,
could substitute other acreage
Carbon Trading Overview 33What we negotiated
10 yr lease - 3000 tons CO2 credits/year through
direct seed production practices
Total of 30,000 tons (1T CO2/3.67 = T C)
$2.50/ton paid up front => $75,000 total
Annual verification by local Conservation District
employees - visual inspection of direct seed
methodology
Emission reduction credits from reduced fossil fuel
usage in DS
22.38# CO2 reduction/gal diesel saved
Aggregation fee of 20% paid to PNDSA
Contract signed May 2002; started aggregating
credits in September 2002
Carbon Trading Overview 34PNDSA / aggregator contract
with farmers
100 acre maximum @.55ton CO2/acre/year of DS
Designed to give more farmers a chance
Create interest in future contracts
Insure actuarially sound
Total acres to meet contract: 54,500 ac-yrs
Total acres signed up: 6,240ac…113% of min. regmt
1 Acre Example:
6yrs DS x .55T CO2/yr x $2.50/T = $8.25/ac
Grower@$2.00/TÆ$6.60/ac; PNDSA@$.50/TÆ$1.65/ac
Æ Not the money that counts…
Ten year term
Payback criteria if revert back to tillage during term
of contract
Carbon Trading Overview 35Working on New Generation
Contract
Significant expansion in acres –
scoping potential acreage available
Targets: 100-200,000T CO2/yr => 2-400,000ac
Higher values for sequestration
Variable compensation based on
rainfall/rotations
Growers to receive value for fossil fuel
reductions + sequestration
Tougher protocols administration
Scoping other third party verifiers
Compensation for verification
Carbon Trading Overview 36Part II – 3 Basics of Marketing Your
Carbon
Define & measure what we have to sell
Assure a fair price
Assess market supply, demand and equilibrium
price levels
Assure ag access to the market – legislation,
regulation, protocols, and market exchanges
Develop a marketing strategy
Inventory saleable product & get “certified”
Identify viable market outlets
Decide on market timing & price objectives
Execute the plan
Carbon Trading Overview 37Two Different Products to Market
Carbon Sequestration
Emission Reductions
From tillage reductions
From reductions in fossil fuel reductions
Carbon Trading Overview 38Intensive Tillage NT/Direct Seed/Zero Till
Carbon Trade Products Created by Transition to NT/DS:
ÆNet Carbon Sequestered from reduced tillage =
0.55 tons CO2 per acre/year
…doesn’t count benefits to soil, water & habitat quality from
reduced erosion
ÆEmissions eliminated from reduction in fossil fuel consumption
4 gal fuel x 22.38# CO2 ↓/gal saved = 90# Æ .045T CO2/ac/yr
Total Carbon Emission Offsets = .55 + .05 = .60THow do we measure this…
Players active in measurement
CASMGS – 8 Land Grants; K-State (Rice)
2003 Measurement & Monitoring conference
National Soil Tilth Laboratory – Ames, IA
North Central Soil Conservation Research
Laboratory – Morris, MN (Reicosky)
Predictive measurement models
COMET (CENTURY) www.cometvr.colostate.edu/
C-Lock (CENTURY) – So Dakota St.
CROP-SYST ARS-Pullman, WA
SEQUESTER – Pendleton, OR
Other tools: Veris Mapping
Carbon Trading Overview 40Voluntary Reporting Carbon Management Tool COMET-VR (Beta)
Go to | Reset | State | County | Parcel | Soil | Rotation | Tillage | Submit | Summary |
Values are valid for 2005 through 2015 assuming that no change in management occurs.
The default values, or your specified values for soil carbon, may be reported in the 1605(b) system. We recommend that you
print this page and save a copy of this report to a file on your computer system. Use the button "Write File" on the Next
page to save this report.
Top of Form
CASCADE County, Montana Century's Dynamic Carbon Database COMET-VR Summary:
Voluntary Reporting Carbon Management Tool COMET-VR
Carbon Storage Report
Report Year: 2005
Parcel Description Parcel Management History
Parcel Name: Parcel 1 Historic: irrigation (pre 1970's)
Parcel Size: 600 Acres 70's to dryland: spring wheat-mechanical
90's: fallow; No Till Tillage
Location: CASCADE, Montana
Current: CRP, 100% grass; No Till Tillage
Soil: Non-hydric Silt Loam
Report
CRP, 100% grass; No Till Tillage
Period:
Predicted Change in Soil Carbon for the Parcel
Annual Change for 2005
0.15T/Ac
Change in Carbon % Uncertainty
Total Tons Carbon per year: 25 8.87
Total Tons CO2 Equivalent per year: 91 8.87
Values recorded in English units. One ton of carbon is equivalent to 3.664 tons of carbon
dioxide.
Carbon Trading Overview 42
http://www.cometvr.colostate.edu/C-Lock Model Results
Accrued CO2-equivalent offsets and credits summed over each 10-year period of the simulation of three
management scenarios, compared to a BAU case of conventional tillage of a corn-wheat-soybean rotation.
Net credits are the sum of credits and offsets.
1991–2000 2001–2010 2011–2020 2021–2030
Mg CO2 equivalent per hectare
TOTAL
Crop – Reduced Tillage
Offsets 4.8 2.6 3.9 2.3
Credits 2.1 0.1 -1.1 1.1
Net Credits 6.9 2.6 2.8 3.4 15.7
Crop – No Tillage
Offsets 5.5 4.2 6.6 4.9
Credits 12.8 7.9 4.4 6.8
Net Credits 18.2 12.1 11.0 11.7 53.1
CRP
Offsets 5.5 4.2 6.6 4.9
Credits 15.5 17.2 12.6 14.2
Net Credits 21.0 21.4 19.2 19.1 80.7
Source: “C-Lock…” South Dakota School of Mines and Technology, Karen Updegraff et alChallenges with Modeling
Diverse micro-climates
Weather – temperature, rainfall
Soil properties
Diversity of management practices
Rotation
Tillage Practices
Nutrient Management
Historical land use–(requires LT records)
Getting academics/researchers to form
consensus
Carbon Trading Overview 44Potential C Sequestration of
1# C Æ 3.7# CO2
Management Practices
• No-tillage (direct-seeding): 100 to 700
lbs C/ac per year over 10-30 years Å370 - 2,590#/yr
– BUT, dependent on crop rotation,
fertilization
• Returning crop residues and roots: Soil
C gain is proportional to C inputs
– Perennials > annuals; Wheat > peas >
summer fallow
• Perennial grasses (CRP): 500 to 1000
lbs C/ac per year
Å1850 - 3700#/yr
.
.
CT
Model predictions of soil organic C change under
various agricultural systems
Annual increases of 250 to 1000 lbs soil C/ac
.
.At what price should carbon sell?
Using “cost accounting” valuing GHG offsets
Kinsella–value of nutrients; price needed to encourage Ç soil quality
through adoption of NT Æ $75-100/t C
Chuck Rice: N,P,K + H20 in kg humus = $.20
Æ Converts to $1100/ac with 1% SOM @0.6% carbon
Æ If increase SOM 0.1% Æ C is worth $110 value/acre
Legal Costs/Transition Costs - not cheap; give up flexibility in tillage,
rotations, burning, etc.
Using “supply/demand” approach
Demand = function of:
Voluntary vs. mandated trading market
Minimum price = “bottom fruit” selling now to voluntary buyers
Maximum price = What the fine is to sin!;
Level at which Caps are set (i.e. setting lower increases value of credits)
Costs to reduce emissions (i.e. severity of emission taxes or permits
imposed (i.e. $.05 Fuel tax/litre equals $20.15/tonne of carbon.)
Supply: depends on who will be eligible to market
What is best buy: emissions reduction? … or sequestration?
Who is an eligible offset? Ag, Forestry, other GHG reduction projects
How do ag vs non-ag offset projects/practices compete (quality, price)?
Carbon Trading Overview 46$38US
$20US
$11US
$9.50US
$5US
2005-06 Euro vs US dollar
Currency exchange rates:
ÆLow: $1.16
ÆHigh: $1.35MARKET DATA (Click here for
live data)
CCX Carbon Financial Instruments,
2006 RECAP
Summary of trade
Vinta 2006
High Low Close Historic Volume
ge Volume
2003 $5.30 $1.50 $4.10 827,500 1,677,800
2004 $4.90 $1.55 $3.95 825,700 1,889,800
2005 $4.80 $1.55 $4.05 966,100 2,310,600
2006 $4.75 $1.60 $4.00 1,326,000 2,299,800
2007 $5.00 $3.00 $3.75 1,523,600 1,523,600
2008 $4.65 $3.00 $3.75 1,520,200 1,520,200
2009 $4.60 $3.10 $3.75 1,590,300 1,590,300
2010 $4.60 $3.10 $4.00 1,707,000 1,707,000
14,519,100
10,316,40 Price Units: Per metric ton of CO2
Totals
0 Volume Units: metric tons of CO2
Source: Iowa Farm Bureau websiteWhere can you sell your carbon?
Direct Sale Aggregators
Direct Sellers: PNDSA
Aggregate/re-sell: CCX, GEMCO/IGF
X-Chg Aggregators (a growing list…)
Illinois Conservation and Climate Initiative
Iowa Farm Bureau
National Carbon Offset Coalition
National Farmers Union
Northern Plains Environmental, Inc
Others
Foreign Markets ???
Carbon Trading Overview 49Contract Protocols - Key Issue for
Offsets to be Validated
CCX traded contracts
CCX developed protocols working with
aggregators
Emissions standards: 1605 compliance
Sequestration standards: still “work-in-progress”
Direct Sale contracts
What ever the buyer & seller agree upon
Issue: Will existing protocols be recognized
by state, national, international bodies if:
cap & trade is passed
rules are legislated for what constitutes eligible
offsets
Carbon Trading Overview 50Common Protocols – NT/DS
Member of aggregating entity
Practices comply with DS/NT/ST
definitions
NRCS 329 standards – Beware of the
devil in the details (Definition of NT/DS)
No burning or residue removal
Substitutability
1605(B) – covers emissions side…
doesn’t address sequestration projects
Carbon Trading Overview 51Protocol – Considerations
Rate of carbon sequestration
Volatility – ability to withstand
environmental disasters (fire, insects,
disease, floods)
Permanence
Leakage
Additionality
Predictability
Conversion to other sink forms
Net emissions/sequestration balance – CO2
emitted to generation CO2 seq. project
Carbon Trading Overview 52Quality Measurements / Standards
Gold Standard – branding,
certification process (Duke University)
King formula – quality measure
“Carbon Credited” Brands program -
maps carbon footprint – Michael
Kiely, Australia)
Carbon Trading Overview 53$$$ at Stake
Producers – value added revenue source
86mm acres corn
57mm acres wheat
CRP; forests
Grasslands, methane capture, renewable fuels
Aggregators - service to members/profit
Revenue source 10-20% of offset value
Administrative Cost
Emitters – looking for offsets to meet caps
Looking for least cost/highest quality
Buying time until can improve efficiency
Carbon Trading Overview 54Illustrative Ranking of Carbon as a Crop in U.S.
Per Proposed GHG Limits in
Senate Bill 280 (Lieberman-McCain) 1/12/07
Carbon at $10/MT CO2e,
25
Production Value ($B)
20
15
10
5
0
orn
s
ON
nes
to
ns
ns
s
hay
pes
ton
es
s
eat
es
rice
es
uce
ond
nge
oat
ma
ato
cuk
bea
bea
dat
in c
wh
tari
gra
cot
RB
lett
alm
ora
h to
pot
soy
gra
CA
nec
fres
[Crop Source: USDA - National Agricultural Statistics Service – US Crop 55
Rankings - 1997 Production Year Ranking Based on Value of Production]Marketing Question: Sell now…or
wait?
Issues
Climate change legislation/regulation?
How position farm to maximize value?
How long will game be in town?
Getting “carbon credited” – Be Ready!
Inventory offsets available to market
Do it yourself? …or Hire experts? (i.e. “Carbon
Credited” Brands program, mapping carbon footprint –
Michael Kiely, Australia)
Big Question: will “stamped” projects and
offsets bring premiums or better market access?
Carbon Trading Overview 56Part III – Defining an Ag Policy Framework
– Underpinning Access to Carbon Market
Issues where Ag
needs to weigh in
Strategies for
building consensus
Caution: Be sensitive
to constituents who
don’t get to play
Carbon Trading Overview 5710 Policy Issues – Carbon Trading
Cap and trade federal legislation
Limits on Agriculture as eligible
carbon sink/emissions offset
U S position on national/international
protocols limiting emissions
Eligibility to market emissions
reductions as well as sequestration
credits
Where should baselines be set?
Carbon Trading Overview 58Issues (cont’d)
Financial additionality – eligibility to
receive compensation from multiple
parties for same practices
Research funding for terrestrial
sequestration
Fixing value of carbon legislatively
Establishing state/federal protocols
Preferred role of USDA in carbon
trading
Carbon Trading Overview 59The “Carbon bus has left…are we on
the bus, or running to catch up?”
Megafirms pushing for 10-30%
emissions reduction next 15 yrs
(utilities, manufacturing,
chemicals, financial services,
environmental groups)
Buyers coming… Example:
10 MMT offsets (5 utilities)
Æ 4mm NT acres for 5 years
6 bills in hopper to regulate
climate, carbon…& counting
ÆCan agriculture say where we
stand?
Carbon Trading Overview 60Strategy for Resolving Policy
Debates
Form collaborative effort across all
commodity and conservation groups
Formalize networks/communication
with select environmental groups who
share common goals with agriculture
Carbon Trading Overview 61Threats from inaction & ignorance
Ag will have no say in policy formulation
Mandated caps on price of carbon
Producers will sell carbon credits too cheap
Existing contracts could lose value due to
measurement rules
Ag sector could be penalized for emissions*
State regulations lock Ag sector out of
marketing carbon-friendly practices (CA)
Non-US competitors imposing opinions on
what we should do
Carbon Trading Overview 62Examples: Daily threats & attitude shifts
“Agriculture sector should be penalized for GHG
emissions…farmers and livestock breeders that produce
excess greenhouse gas emissions should be punished for
their negative impact on the environment.” U K Environment
Secretary, David Miliband – Oxford Farming Conference, Greenwire, January 4, 2007
“Companies that see climate change coming, recognize it for
what it is, do the relevant R&D and inculcate a positive
attitude to change …do very well. A company that
doesn’t believe it and doesn’t encourage it managers to
take it seriously is going to get rolled over.” John Llewellyn,
Lehman Bros as quoted in Financial Times 2-1-07 re: Exxon shifting its position on climate
change.
“…some large, rich countries still must be convinced…they
are refusing to accept the consequences of their acts.”
French President Jacques Chirac comments referring to the U. S., one of 113 nations who
approved the release of Intergovernmental Panel on Climate Change report.
Carbon Trading Overview 63Information Sources
Climate Information
Carbon Trading Information Overload!!!
Experts
Aggregators
Trading Exchanges
Conservation
Organizations
See Handouts
Surf the web
sources…follow the
Linkages
Carbon Trading Overview 64Great source – Links to climate reports
Information Sources
Great Linkages…
Æ Climate change
Æ Cons Organizations
Summary “The so-called and long-overstated debate about global warming is over.
It’s time now to hear from the world’s policymakers.” Tim Wirth, President, United Nations Foundation
Time for change in agriculture’s image re: climate impact
Traditionally: seen as part of problem
Opportunity ahead: be key part of solution
Be at the table: …”if don’t will be on menu” (Sara)
Identify, engage & agree on carbon trading policy issues
Engage in protocol definitions; keep them simple
RE: Marketing Carbon
Insure producers are EDUCATED before
selling…experimenting with small acreage is good tool
Understand opportunities & risks; be prepared to deliver
benefits we contract to sell
Encourage professional marketing approach
Assess what have to sell; don’t sell too cheap; beware of
snake oil salesmen “picking the bottom fruit”
Carbon Trading Overview 68Time for Questions...
Carbon Trading Overview 69You can also read