Addressing Your Classroom's Carbon Footprint
←
→
Page content transcription
If your browser does not render page correctly, please read the page content below
Working Together

Addressing Your Classroom’s Carbon Footprint
This resource has been developed to enable a class to work out how many trees they would need to plant to
offset the carbon emissions produced in the classroom for a day, a week, a term or a year.

   The resource contains:
   • Background information on
     Greenhouse Gases
   • How to Measure Your
     Classroom’s Carbon
     Footprint
   • How many trees will you
     need to plant
   • Planting considerations
   • Information on how to read
     electricity meters
   • Energy saving tips
   • List of Contacts
   • References

   Earth Image:http://archive.bigben.id.au/victoria/maps/images/9909162132.jpg

                                                                                                   Page 1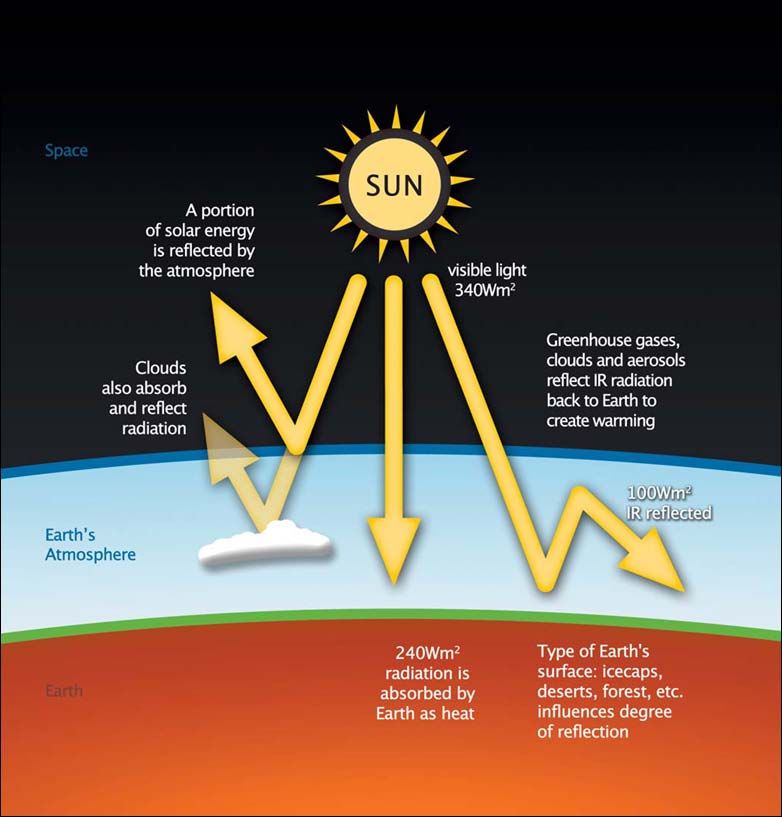
Working Together

Background Information on Greenhouse Gases
The Greenhouse Effect is the reason we can exist on this planet. The amount of greenhouse gases
in the atmosphere needs to be at the right level so our planet stays at temperature we can live in. The
amount of greenhouse gases in the atmosphere determines the temperature of the planet. The Greenhouse
Effect is responsible for warming the surface of planet earth. Water is found in all three states on our planet
(solid -ice and snow; liquid - oceans and rivers and rain; and gas - water vapour and steam and clouds). It
regulates heat on the surface of the planet and keeps the Earth at the right temperature so we can survive.
Imagine if our Earth was much colder, the liquid water would turn to ice and we could not drink it and the
Earth would probably be too cold for us to live on. The same applies if our Earth was too hot, many plants
and animals could not survive. The amount of greenhouse gases in the atmosphere needs to be at the right
level so our planet stays at temperature we can live in.
The Greenhouse Effect works by the following mechanisms:
(see diagram on page 4)
• The sun emits radiation.
• Radiation is reflected by the atmosphere and clouds in the atmosphere.
• Radiation reaches the surface of the Earth.
• Some of the radiation that reaches the surface of the Earth is absorbed by the surface of the Earth.
• Some of the radiation that reaches the surface of the Earth is reflected by the surface of the Earth back
  out into the atmosphere  which is trapped by greenhouse gases in the atmosphere.
• The radiation that is trapped by greenhouse gases stays near the Earth and so the surface of the Earth
  is warmed.
A good analogy is a car windscreen. A car that is left in the sun with all the doors closed and all the windows
up gets very hot. This is because the glass of the windscreen lets heat in but the heat that is reflected by the
seats and the interior of the car is trapped by the glass windscreen.
The following are greenhouse gases in the atmosphere:
Not listed in order as the makeup of atmospheric greenhouse gasses and human contribution to them will
vary from place to place.
• Water Vapour
• Carbon Dioxide
• Ozone
• Methane
• Nitrous Oxide
• CFCs (Chloro Fluoro Carbons)
• HCFCs (Hydrochlorofluorocarbons)
                                                                                                         Page 2
Working Together

• HFCs (Hydrofluorocarbons)
• Halons
• Carbon Tetrachloride
• Perflourocarbons
The more greenhouse gases (including CO2) that are in the atmosphere the more heat is trapped near
the Earth and the warmer the surface of the planet. When more greenhouse gases are released into the
atmosphere and more heat is trapped it is called the Increased Greenhouse Effect. The more heat
that is trapped, the warmer the Earth becomes and this is called Global Warming.
Increases in Greenhouse Gas Emissions
Over the history of the Earth many things have happened. The Earth has been really cold and covered in ice
and really hot and there have been mass extinctions. The amount of carbon dioxide in the atmosphere
determines the temperature of the Earth. Over the past 400,000 years the carbon dioxide concentration in
the atmosphere has changed and there have been changes in the temperature of the Earth.
Nearly everything we do produces greenhouse gases. The greenhouse gases we make are called
greenhouse emissions. A car produces greenhouse gases; they are part of the gases that come out of the
exhaust pipe. Making electricity produces greenhouse gases. Clothes, computers or Nintendo or X-Box or
Playstation, the furniture in houses and in schools, the food we eat, the things we buy and the things that we
use like roads and buildings you walk through, all have greenhouse gas emissions associated with them.
Our Aim
We all have a role to play in reducing our Carbon Footprint. Students are excellent facilitators of change.
The aim of this resource is to encourage students to recognise greenhouse gas emissions associated
with their school lives and to implement changes that will reduce their emissions. Further, they are able to
engage their families and communities in these changes and so be the change facilitators outside of school
as well.
Measuring Your Classroom’s Carbon Footprint
We are looking at reducing your classroom’s carbon footprint. To do this you need to audit your electricity
usage.
If you have an electricity meter board just for your room you can read the meter weekly and work out how
much electricity your room uses in a week.
• Select a day and time to read the meter – i.e. Monday 11am
• Read the meter and record the reading.
• One week later read and record
• How much electricity did you use in that week?

                                                                                                        Page 3
Working Together
“Operation Coolenation - An Education Resource for Global Warming Issues”
Page 4Working Together
Decide on an energy reducing action(s) for the following week
(see list of possible actions on page 11)
• Implement the action(s)
• One week later read and record
• Have you saved any electricity? – what factors may have influenced this – e.g. weather, public holidays
• Repeat your actions and record over the following weeks to look for trends
• Share your recordings and actions with other classes and your families. Encourage other classes to take
up your actions. Talk with your family about implementing actions at home and recording results.
If you don’t have a meter just for your room:
1. Use your latest electricity account to work out how much has been used - be aware that bills are
quarterly accounts.
2. Make a list of all of the electrical items you have in your classroom
Estimate how many hours a day / week they are running
If they plug into a powerpoint use the Multifunction Energy meter to work out their energy use in KWh and
multiply by the number of hours used per day. (NRM Education has these available to borrow)
If you can’t unplug them find the wattage and calculate the KWh by multiplying watts by hours used per day
- 100 w light bulb on for 8 hours per day - 100 X 8 = 800 / 1000 = 0.8 KWh / day
For a school week 0.8 X 5 = 4.0 KWh
You need to do this for all of the electrical appliances in the class to work out your total electricity use each
day.
Decide on an energy reducing action(s)
(see list of possible actions on page 11)
• Implement the action(s)
• Have you saved any electricity? – what factors may have influenced this – e.g. weather, public holidays
• Repeat your actions and record over the following weeks to look for trends
• Share your recordings and actions with other classes and your families. Encourage other classes to take
up your actions. Talk with your family about implementing actions at home and recording results.
Page 5Working Together
Example of calculating your offset
Once you know your total electricity use in KWh use the calculation below to convert that into how much
carbon dioxide would be produced generating that much electricity.
In South Australia to convert from your KWh to carbon dioxide - Multiply KWh by 0.98
This figure of 0.98 is correct as of June 2010. (For more information visit the Australian Department of
Climate Change (DCC) www.climatechange.gov.au)
Example
A class using 10KWh per day
10KWH X 0.98 = 9.8Kg of CO2 / day
Multiply by the number of days in a school year. (approx 200)
9.8 x 200 = 1960 Kg / year (1.96 t)
In the MDB an average conservative sequestration rate is 6.4t / hectare / year so to determine the amount
of land you need to plant
Divide 6.4 by 1.9 = 0.29 (rounded off 0.3 hectare)
Some where between 600-1000 large tree species would fill a hectare in most landscapes, but again it will
depend on the species, planting density and rainfall.
As well as planting to offset your carbon emissions the planting could also assist the biodiversity of the area.
A biodiverse carbon planting uses locally sourced seed from ten to twenty native species that includes not
only trees but also understorey shrubs and smaller plants. A plantation of this type provides a wider range
of habitat for native birds, mammals and reptiles. With many of our native species decreasing in population
size due to loss of habitat, a biodiverse carbon planting will contribute to maintaining these species through
the provision of native habitat.
For information on species for your local area, sourcing of trees, seed collection and propagating and
spacing of trees assistance can be obtained from your NRM Education Coordinator or Local Action Planning
(LAP) Officers - see page 12 & 13.
Page 6Working Together
How to Read Electricity Meters
You can easily measure how many kilowatts (kWh) you use in a day, a week, or any other period, by reading
your meter at the start and finish of the period.
Clockface Meters
• To read your meter, stand directly in front of the meter, start reading from left to right, obtaining one
number from each clock face. When the hand is between two numbers, always write down the lesser of
the two, not necessarily the closer. (The exception is when the hand is between 9 and 0, in which case
you write down 9).
• In the example below, if the hand has not passed 0, the number 5 has not actually been reached and so
the reading is the lower number, which is 4. The total reading is therefore 04980 (which is 4,980kWhs).
Page 7Working Together
EMS2100 Electronic Meter
Display
• When the Display button is pressed, the meter will automatically scroll through a series of up to 20
displays.
• Each display will have a number on the left-hand side of the reading.
• As the meter scrolls through each display, note down the readings for the following display numbers:
03 Total kWh
04 KWh usage, Peak
06 KWh usage, Off-Peak
07 KWh usage, Off-Peak Hot Water
• For GD tariff display 03 is important as it measures the total usage (excluding off peak hot water).
• For Y8, Y6 or YT, display 07 is the electric off peak hot water register.
• For WINNER tariff (GH/GL), 04 will give you the peak usage, 06 gives off peak usage and 07 registers
off peak electric hot water if applicable.
Boost
• The Boost button can be used if there is a single element electric hot water service.
• If the hot water service has run out of hot water, press the boost button once.
• The unit will automatically switch itself off when boosting is complete.
This boosting will take place at the peak rate. If on WINNER tariff, boosting on weekends is at the off peak
rates, and during the weekdays it will depend on the time of day boosting occurs.
Page 8Working Together
EMS2600 Electronic Meter
Display
• When the Display button is pressed, the meter will automatically scroll through a series of up to 20
displays.
• Each display will have a number on the left-hand side of the reading.
• As the meter scrolls through each display, note down the readings for the following display numbers:
05 Total kWh
06 KWh usage, Peak
08 KWh usage, Off-Peak
09 KWh usage, Off-Peak Hot Water\
• For GD tariff display 03 is important as it measures the total usage (excluding off peak hot water).
• For Y8, Y6 or YT, display 07 is the electric off peak hot water register.
For WINNER tariff (GH/GL), 04 will give you the peak usage, 06 gives off peak usage and 07 registers off
peak electric hot water register. Boost
• The Boost button can be used if there is a single element electric hot water service.
• If the hot water service has run out of hot water, press the boost button once.
Page 9Working Together
• The unit will automatically switch itself off when boosting is complete.
This boosting will take place at the peak rate. If on WINNER tariff, boosting on weekends is at the off peak
rates, and during the weekdays it will depend on the time of day boosting occurs.
Boost
• The Boost button can be used if there is a single element electric hot water service.
• If the hot water service has run out of hot water, press the boost button once.
• The unit will automatically switch itself off when boosting is complete.
This boosting will take place at the peak rate. If on WINNER tariff, boosting on weekends is at the off peak
rates, and during the weekdays it will depend on the time of day boosting occurs.
Digital Meters
To obtain a reading from your digital meter, simply read the digits from left to right.
Page 10Working Together
Energy Saving Tips for School
Light action
Turn off the lights when you are not using them. Just switching off at recess and lunchtime can save a lot of
energy. Open the blinds to let in natural light and maybe you won’t need to turn on so many lights. Check
the hallways and other shared spaces. Often lights are left on when they aren’t needed. Design a small
sticker to display next to your light switches to remind people to turn them off when they leave a room.
Cool ideas
• When the cooler or heater is on keep the doors, windows and blinds closed.
• Only use heaters when there is someone in the room.
• Check the settings on your thermostat. Winter heating should be set at 21 degrees C and summer
cooling at 25 degrees C.
• Check for draughts coming through gaps around windows and doors by holding a tissue up near the gap
and seeing if it moves. Talk to your teacher about how to plug the gaps.
Electrical Appliances
Even when electrical appliances are not being used they still use power, even if they are switched off. We
need to turn appliances off not only from their remote control, but also at the power-point to avoid wasting
electricity. Design a small sticker to display next to your power-points to remind people to turn them off
when they leave a room.
Power down
• Make sure all computers are turned off when not in use. Remember screen savers do not save energy!
• Monitors use a lot of energy, so ensure they are switched off. New computers have a function setting
which automatically switches off the computer and/or monitor after a set amount of time. Investigate
these options by going to your computer’s control panel.
• Ensure printers and photocopiers are switched off at night and on weekends. Check to see if they have
an ‘Energy Saver’ setting and make sure people know how to use it.
Other Tips
• Check for leaky taps. Dripping hot water taps are using energy with each drop as well as wasting water.
• Appoint a ‘Power Ranger’ in each class. This person is responsible to make sure everything is turned off
each day. Everyone should have a turn at being the “Power Ranger”.
• Reduce, Reuse and Recycle. The three R’s are a great way to save money, energy and waste.
• All the packaging on our lunch can produce large amounts of waste. We can reduce our waste by
reducing the amount of packaging in our lunchbox. Use reusable containers instead of plastic bags.
Reuse the same water bottle after washing it. Ask your parents to buy large packets of snacks and then
put them in a small reusable container to take to school, so you are saving all the little chip packets from
becoming waste.
• Have a compost bin in your class.
Page 11Working Together
Contacts
South Australian Murray-Darling Basin Natural Resource Management Board
NRM Education Coordinators
Upper Murray Ph: 08 8582 4477
Fax: 08 8582 4488
Lower Murray Ph: 08 8532 9100
Fax: 08 8531 1843
Local Action Planning (LAP) Group Contacts
Mannum to Wellington LAP
Ph: 08 8531 3075
Fax: 08 8532 5300
Email: mwlap@mwlap.org.au
Murray Mallee LAP
Ph: 08 8531 2066
Fax: 08 8532 5300
Email: mmlap@internode.on.net
Eastern Hills and Murray Plains Catchment Group
Ph: 08 8531 2077
Fax: 08 8532 5300
Email: ehmp@internode.on.net
Mid Murray LAP
Ph: 08 8564 6034
Fax: 08 8564 5003
Email: midlap@internode.on.net
Riverland West LAP
Ph: 08 8541 2611
Fax: 08 8541 3955
Email: pm@rwlap.org.au
Page 12Working Together
Berri Barmera LAP
Ph: 08 8582 2183
Fax: 08 8582 2495
Loxton to Bookpurnong LAP
Ph: 08 8582 2824
Fax: 08 8582 2495
Email: admin@lblap.org.au
Coorong District LAP
Ph: 8757 2100
Fax: 8757 2222
Goolwa to Wellington LAP
Ph: 08 8536 5612
Fax: 08 8536 8435
Renmark to Border LAP
Ph: 08 8586 6633
Fax: 08 8586 5733
Email: rblap@riverland.net.au
Page 13Working Together
References
Greg Lundstrom
Senior Project Officer - Community Monitoring / Climate & Energy
South Australian Murray-Darling Basin Natural Resources Management Board
Ph: 8536 5622
Mob: 0429 697 319
Steve Coombe
Project Officer
Eastern Hills & Murray Plains Catchment Group Inc
Ph: 08 8531 2077
Mob: 0408 442 428
Harry Seager Implementation Officer
Eastern Hills and Murray Plains Catchment Group
Ph: 08 8531 2077
Fax: 08 8532 5300
Mob: 0408 554 960
Email: ehmpogw@internode.on.net
Peter Stewart Murray Bridge High School
Unit of Work “Is it possible to have a carbon neutral lesson?”
Carbon Planet
“Operation Coolenation- An Education Resource for Global Warming Issues”
Western Power Energy Saving Kit for Schools
http://www.westernpower.com.au/pluginkids/documents/resources/EnergySavingKit.pdf
Sustainable and Attainable
http://www.sustainableschools.sa.edu.au – Energy – “Don’t Waste Your Energy – A Teacher’s Guide to
Energy Activities”
Page 14Working Together
Climate Change
www.climatechange.gov.au
CarbonKids
www.csiro.au/CarbonKids.html
SA Murray-Darling Basin Natural Resources Management Board website
www.samdbnrm.sa.gov.au
Energy Institute
www.energyinstitute.com.au
Origin Energy - Home Energy Project
www.originenergy.com.au/files/hepnewsletter6.pdf
Ecological Footprint Calculator
http://www.epa.vic.gov.au/ecologicalfootprint/calculators/default.asp
The Victorian EPA has purloined the WWF calculator for personal footprint calculations, in itself a good
move as this is easily the best one around. Besides this, calculators are provided for whole schools, retail
tenants, shopping centres and events. These vary in quality and ease of use and may require changes to
some settings on a pc. Overall the site is quite useful.
Electricity Meter Images:
Clockface Meter & Diagram - www.truenergy.com.au
EMS2100 Meter - www.truenergy.com.au
EMS2600 Meter - www.truenergy.com.au
Digital Meter - http://trangtrinh.global2.vic.edu.au/files/2011/05/Digital-meter.png
Page 15You can also read