Advanced Technologies - for Industry - International Reports Advanced technology landscape and related policies in the United States of America
←
→
Page content transcription
If your browser does not render page correctly, please read the page content below
May 2021

Advanced Technologies
for Industry – International Reports
Advanced technology landscape and related policies in
the United States of America
ATI International Report - USA

       This report was prepared by Kincsö Izsak from Technopolis Group and
       Prof. Pierre-Alexandre Balland, Utrecht University & Artificial and Natural Intelligence Toulouse
       Institute (Chapter 2).

       EUROPEAN COMMISSION
       European Innovation Council and SMEs Executive Agency (EISMEA)
       Unit I.02.2 — SMP / COSME Pillar
       E-mail: EISMEA-SMP-COSME-ENQUIRIES@ec.europa.eu

       Directorate General for Internal Market, Industry, Entrepreneurship and SMEs
       Unit D.2 — Industrial forum, alliances, clusters
       E-mail: GROW-ATI@ec.europa.eu

       European Commission
       B-1049 Brussels
       LEGAL NOTICE
       The information and views set out in this report are those of the author(s) and do not necessarily reflect the official
       opinion of EISMEA or of the Commission. Neither EISMEA, nor the Commission can guarantee the accuracy of the
       data included in this study. Neither EISMEA, nor the Commission or any person acting on their behalf may be held
       responsible for the use, which may be made of the information contained therein.
       More information on the European Union is available on the Internet (http://www.europa.eu).
       PDF      ISBN 978-92-9460-748-5 doi: 10.2826/18195              EA-03-21-310-EN-N

       © European Union, 2021

May 2021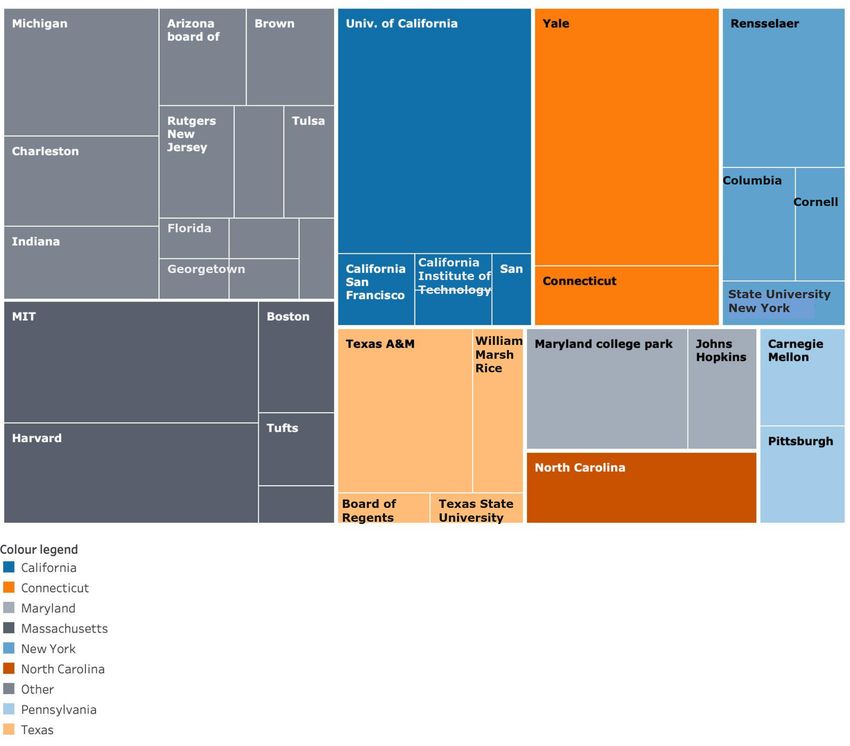
ATI International Report - USA

Table of Contents

        Introduction ........................................................................................................................ 4
        Section 1 .............................................................................................................................. 5
        1    Overall performance in advanced technologies .............................................................. 5
            1.1    Patent applications .................................................................................................. 5
            1.2    International competitiveness ................................................................................. 6
            1.3    Startup and scaleup activities in advanced technologies ......................................... 7
        Section 2 .............................................................................................................................. 8
        2    US ecosystem in Artificial Intelligence ........................................................................... 8
            2.1    US performance in AI .............................................................................................. 8
            2.2    Key players of the US AI ecosystem ........................................................................ 9
            2.3    Drivers of the US AI ecosystem ..............................................................................15
            2.4    Role of policy ..........................................................................................................16
            2.5    Lessons for Europe .................................................................................................18
        Section 3 .............................................................................................................................20
        3    US ecosystem in Nanotechnology .................................................................................20
            3.1    US leadership in nanotechnology ............................................................................20
            3.2    Key players of the US nanotechnology ecosystem ..................................................21
            3.3    Role for policy ........................................................................................................24
            3.4    Drivers of the US ecosystem ...................................................................................25
            3.5    Lessons for Europe .................................................................................................26
        Section 4 .............................................................................................................................27
        4    COVID-19: Impact, Response and Recovery .................................................................27
            4.1    COVID-19 impact on the US economy .....................................................................27
            4.2    Impact on advanced technologies ..........................................................................27
            4.3    Economic response and countervailing policies ......................................................28
            4.4    Technology policy highlights during the pandemic .................................................30
        Bibliography .......................................................................................................................33
        About the ‘Advanced Technologies for Industry’ Project .....................................................35

 May 2021

                                                                         3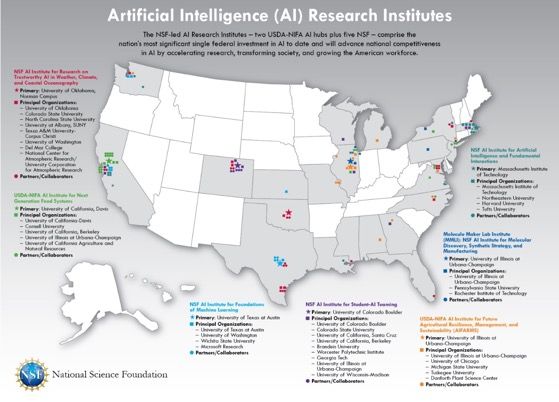
ATI International Report - USA

Section

       Introduction

       The objective of the international country reports is to explore the technology and policy landscape of
       selected non-European countries. Country performance in advanced technologies is presented based on
       patent, trade and investment data. This particular report is an update and extension of the US report
       published      in    2020     (https://ati.ec.europa.eu/reports/international-reports/report-united-states-
       america-technological-capacities-and-key-policy) and zooms into two technology ecosystems notably
       into Artificial Intelligence and Nanotechnology. The reason why these fields have been selected is that
       they represent technologies where the US is particularly strong and important lessons can be drawn for
       the EU. The analysis relies on the data collected within the ATI project complemented with expert
       opinion.
       The starting point of this analysis has been sixteen advanced technologies that are a priority for
       European industrial policy and that enable process, product and service innovation throughout the
       economy and hence foster industrial modernisation.
       Advanced technologies are defined as recent or future technologies that are expected to substantially
       alter the business and social environment and include Advanced Materials, Advanced Manufacturing,
       Artificial Intelligence, Augmented and Virtual Reality, Big Data, Blockchain, Cloud Technologies,
       Connectivity, Industrial Biotechnology, the Internet of Things, Micro and Nanoelectronics, Mobility,
       Nanotechnology, Photonics, Robotics and Security. The full methodology behind the data calculations is
       available on the ATI website: https://ati.ec.europa.eu/reports/eu-reports/advanced-technologies-
       industry-methodological-report.
       The report is structured as the following:
       •   The first section outlines the overall performance of the US in terms of technology generation (patent
           applications), trade and venture capital data.
       •   The second section dives into the field of Artificial Intelligence and the US ecosystem.
       •   The third section presents the US nanotechnology ecosystem.
       •   The last section analyses the COVID-19 impact and economic responses.

May 2021

                                                         4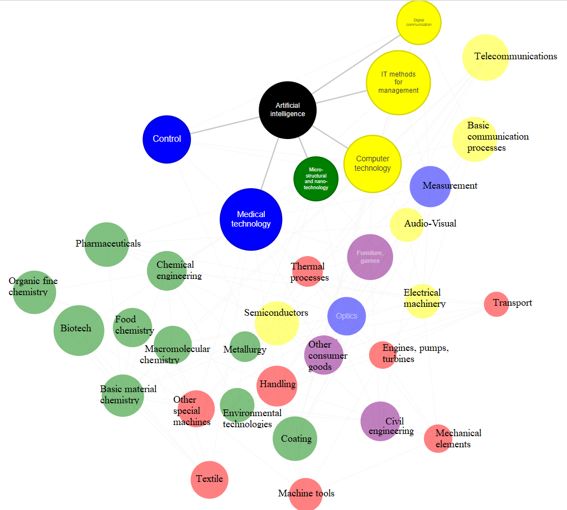
ATI International Report - USA
Section 1
1 Overall performance in advanced technologies
1.1 Patent applications patent applications over the period from 2008 to
2018.
The US has been the world's leading nation in
science and technology since the mid-1950s. An Figure 2: Trends in the share in global transnational
analysis of its current share of transnational patent applications in the US
patent applications helps to assess its current
technological performance across twelve 50%
Technology
advanced technologies in the focus of this report. Big Data
Figure 1 visualises this measure for the US in 45%
Nanotech
comparison with the EU27 in 2018. Ind Biotech
Security
Figure 1: Share in global transnational patent
Share of global patent applications
40% IoT
applications in advanced technologies (2018)1 Robotics
AI
MN Electronics
Adv Manufact.
35%
Adv Materials
Cybersecurity
Mobility
Ind Biotech
Adv Manufact
Photonics
Nanotech
Adv Materials
Robotics
Big Data
Mobility
30%
MNE
Photonics
IoT
AI
25%
20%
Share of global patent applications
30%
15%
2008 2010 2012 2014 2016 2018
20%
Year
Source: Fraunhofer ISI, based on EPO PATSTAT
The analysis of the RPA-index2 as visualised in
10%
Figure 3 demonstrates the US relative
0% technological specialisation in the twelve
advanced technologies in comparison with the
Colour legend
USA EU27.
EU27
The US has a high relative specialisation in Big
Source: Fraunhofer ISI, based on EPO PATSTAT Data, Nanotechnology, Industrial Biotechnology
and Security and a relatively lower specialisation
Compared to the EU27, the US holds higher shares in Robotics and IoT. Negative specialisation is
of worldwide transnational patent applications in found in Photonics, Advanced Manufacturing
Big Data (close to 40%), Nanotechnology, Technologies, Advanced Materials and Micro- and
Industrial Biotechnology and Cybersecurity as well nanoelectronics, Artificial Intelligence and
as, by a lesser margin, in Artificial Intelligence, Mobility. Compared to 2017, the specialisation of
Robotics and Micro- and nanoelectronics (MNE). the US both in Mobility and in Artificial Intelligence
The EU27 holds higher shares in Advanced turned into negative values. In the case of
Manufacturing Technology (AMT), Advanced Robotics, it became positively specialised.
Materials, Photonics and also technologies related
to the Internet of Things (IoT) as well as IT for
Mobility.
In terms of trends over the period 2008-2018, we
see that the leadership of the US declined in
various advanced technologies which is the result
of Asian countries increasing their share and
increased activity on the global patent landscape
(see Figure 2). It is only the field of Cybersecurity
where the US has increased its share in global
1 The diagrams in this report have been prepared with the 2
The RPA-Index illustrates the relative specialisation on a scale
software tableau. from -100 to +100, putting the share of a specific field in national
applications in relation to the global average share.
May 2021
5
ATI International Report - USA
Figure 3: Technological specialisation RPA-Index of the 1990s. The US trade balance in advanced
US and EU27 (2018) technologies has been continously decreasing
since 2008 except for Advanced Manufacturing
Adv Manufact.
Adv Materials
Technologies.
Ind Biotech
Figure 4: Export share in world total (2018)
Photonics
Nanotech
Robotics
Big Data
Mobility
Security
EU27 extra
MNE
IoT
0% 5% 10% 15% 20%
AI
40 AMT
Ind Biotech
IoT
20
Big Data
AI
0 Adv Materials
%
Photonics
Robotics
-20
Mobility
MNE
-40 Nanotech
Security
0% 5% 10% 15% 20%
Colour legend
US
US
EU27
Colour legend
Source: Fraunhofer ISI, based on EPO PATSTAT US
EU27 extra
1.2 International competitiveness
Source: Fraunhofer ISI, based on UN COMTRADE
Trade measures are a common indicator of global
competitiveness, as they document the Note: "EU27-extra" refers to exports to non-EU countries, i.e.
attractiveness of a country's products beyond the competitiveness-based exports outside the single market. The
view is filtered on the US, which ranges from 4.35 to 14.85%
home market. Total exports provide evidence
about a country's role as a producer, and trade Figure 5: Trade balance in relation to overall trade
balance captures its sovereignty in certain areas volume (exports - imports) (2018)
of production.
Adv Materials
Figure 4 visualises the US share of global
Ind Biotech
Photonics
technology exports in 2018 based on the analysis
Nanotech
Robotics
Big Data
Mobility
Security
of UN COMTRADE data. Compared to the EU27 the
MNE
AMT
US exports more products relevant for Micro- and
IoT
AI
nanoelectronics, Artificial Intelligence, Security,
40%
Big Data, IoT and Robotics. Trends over the period
of 2008-2018 show that the US managed to
safeguard its export share in Nanotechnology, 20%
Advanced Materials and Industrial Biotechnology
but it decreased in the case of all other 0%
%
technologies in particular in Cybersecurity.
Figure 5 visualises the trade balance3 in relation to -20%
the total trade volume of the US and the EU27
countries in 2018. -40%
Besides a marked export surplus in Advanced
Manufacturing Technologies and a close to an even Colour legend
trade balance in Micro-and nanoelectronics, the US
US displays a strong relative trade deficit with EU27 extra
regard to goods relevant for all advanced
technologies. Overall, however, this situation does Source: Fraunhofer ISI, based on UN COMTRADE
not differ much from that of the EU, since the main Note: "EU27-extra" refers to exports to non-EU countries, i.e.
exporters of advanced technology related goods competitiveness-based exports outside the single market
are located in East Asia at least since the mid-
3
Exports - Imports
May 2021
6ATI International Report - USA
1.3 Startup and scaleup activities in Figure 6: The number of funding rounds in advanced
advanced technologies technologies and startups established in 2020 or after,
US (2020)
Figure 6 analyses private and venture capital (VC)
investments in advanced technologies in the US Startups
and illustrates the number of investment deals Technology
0 50 100 150 200
concluded in 2020 in advanced technologies and Artificial Intelligence
the number of startups founded in 2020 in the US Biotechnology
based on Crunchbase4 data. Adv Manufacturing
Cloud technology
The analysis suggests that the number of funding Cybersecurity
rounds was the highest in Artificial Intelligence Big Data
and Biotechnology followed by Advanced Robotics
IoT
Manufacturing and Cloud technologies. Startup Blockchain
creation has continued and has been especially MNE
strong in Artificial Intelligence and Industrial AR/VR
Biotechnology. Mobility
Nanotechnology
Adv Materials
Photonics
0 200 400 600 800 1000 1200
Number of funding rounds
Colour legend
Number of funding rounds after 2020
Startups founded after 2020
Source: Technopolis Group calculations based on
Crunchbase
4
Private equity, venture capital investment and related Crunchbase provides information on venture capital backed
innovative start-up creation have been explored based on a innovative companies.
merged dataset available in Crunchbase and Dealroom.
May 2021
7ATI International Report - USA
Section 2
2 US ecosystem in Artificial Intelligence
2.1 US performance in AI United States (Figure 7). This is more patents per
capita than China or the EU27 countries combined.
The United States has led the first wave of the AI
revolution. Tech giants such as Google, Amazon The AI gap between the US and the EU has
and Facebook, have built their corporate success increased. There is still no equivalent to Google,
by leveraging global internet data to develop the Amazon or Facebook in Europe and there are very
best AI recommendation systems. They are today few European AI unicorns (examples are Klarna,
among the most valuable companies in the world. an eCommerce payment solutions platform for
The market capitalisation of Amazon is $1.7 tn merchants and shoppers or the Paris-based Meero
(ca. €1.4 tn) – which represents the GDP of Spain that is an AI photography platform). From 2005 to
and Portugal combined – while the market 2018, the US has consistently produced more AI
capitalisation of Google is $1.3 tn and the one of PCT + EPO patents than all EU27 countries
Facebook is $760 bn (ca. €620 bn). China is the combined6. This gap has continuously increased
only country that has grown AI giants that can since the Great Recession of 2007-2009. By 2009
compete with the US ones with Tencent, Alibaba – which corresponds to the pre-deep learning
and Baidu. Their market size and R&D phase (less data-driven machine learning AI) the
investments are massive but still smaller than EU27 countries produced about 30% of all PCT +
their US competitors. EPO patents. At this date, the US patent
production was about 32%. Given that the UK was
In 2018 (the latest year when patent data are
still in the EU, the EU28 had an even higher share
robust and available), one of every five patents
than the US with 33.6%. By 2018, the EU27 was
filed under the Patent Cooperation Treaty (PCT)5
producing only 2 patents for every 3 US patents.
or at the European Patent Office in Artificial
Intelligence came from inventors living in the
Figure 7: Share in global patent applications, PCT + EPO in Artificial Intelligence
China Japan EU27
29,08% 17,05% 16,17%
USA
22,16%
South Korea UK Other India
8,58% 2,26% 1,15% 1,05%
Canada
Israel 0,87%
1,51%
Share in global patents
0,28% 29,08%
Source: Fraunhofer ISI, based on PCT and EPO PATSTAT
5
PCT patents are international patent applications. EPO patents 6
This is particularly remarkable given that (1) the EU has a
are European patent applications. Analysing PCT patents only larger population than the US and (2) the inclusion of EPO
leads to an even higher worldwide share of American patents. patents tend to overestimate the worldwide production of EU
patents.
May 2021
8ATI International Report - USA
Figure 8: Patent trends in AI, ranking of top 20 countries (2005-2018)
China
USA
Japan
EU27
South Korea
Germany
Netherlands
France
United Kingdom
Israel
Sweden
India
Canada
Switzerland
Finland
Belgium
Austria
Singapore
Ireland
Italy
2006 2007 2008 2009 2010 2011 2012 2013 2014 2015 2016 2017 2018
Year
Source: Fraunhofer ISI, based on PCT and EPO PATSTAT
The US has led the first part of the AI race, but 2012 with a peak market capitalisation of over
China is quickly closing the gap. $104 bn - €85 bn (largest IPO in tech at the time)
and Alibaba in January 2020 for $238 bn (ca.
From 2005 to 2016, the US has produced each
€190 bn).
year more AI PCT + EPO patents than any other
country. Since 2017, the first position is occupied 2.2 Key players of the US AI ecosystem
by China. China started to substantially increase
A key feature of the US AI ecosystem is that it is
its share of AI patents during the deep learning
heavily dominated by a very small number of big
revolution in 2013 moving from 9 to 19% in 2
players. Google, Microsoft, Amazon, Apple and
years.
Facebook alone are responsible for more than one
By 2017 China was producing as many patents as third of the overall international patent production
the US (25%) and by 2018 China was already of American organisations8 from 2014 to 2017
producing 25% more patents than the US. China period (Figure 9). Remarkably, these companies
has its own AI giants with Alibaba, Tencent and are fairly young, with Apple and Microsoft founded
Baidu. Despite a lower market cap7, many in the mid-’70s, Amazon and Google in the ’90s,
observers believe that they are already and Facebook in 2004. The Big Five are competing
outperforming their American competitors in some at an international scale with fast-growing Chinese
segments. WeChat, for instance, has fewer users giants Tencent, Alibaba, Baidu, Huawei and Ping
than WhatsApp but is used for a variety of tasks An Technology.
outside merely messaging. The largest unicorn in
The domination of these giants can be
the AI space actually does not come from the US
explained by a fundamental feature of the
but from China. Through the deployment of
development and adoption of AI
TikTok, Bytedance leveraged the breadth and
technologies: a winner-takes-all ecosystem
depth of Chinese internet data to reach a
arising from network effects. These big players
whopping valuation of $140 bn (ca. €115 bn). As
have led the first strong wave of AI, leveraging to
a matter of comparison, Facebook went public in
a large extent internet data to produce customer-
7 “Market capitalisation or market cap refers to the total 8 We removed organisations that have less than 5 ICT
market value of a company's outstanding shares of stock”. patents during the 2014-17 period
Investopedia
May 2021
9ATI International Report - USA
oriented recommendation systems. The goal is to lead to better predictions and therefore more
dig in an amount of data that a human cannot users, and so on until a specific segment of the AI
handle and use augmented intelligence to cater market is entirely dominated by a single
new songs, products and websites that the user organisation. Google has a monopoly in website
might find interesting. In this perfect matching recommendations and Amazon in product
quest, the AI system that provides the best recommendations. This is the same logic for
recommendations wins-it-all. Spotify, YouTube and Netflix; this is why the AI
fields of machine learning and deep learning have
A small initial comparative advantage will
been particularly shaped by the winners of the
compound into a monopoly in AI. Slightly
internet-AI revolution.
better initial recommendations will attract more
users. More users will lead to more data, which is
the cornerstone of AI performance. More data will
Figure 9: The US AI ecosystem
Source: Balland, 2021
Other big AI players include older • the wireless technology firm Qualcomm.
organisations that were historically more
They alone account for another 27% of
involved in the production of hardware. These
international patents. Outside the US, Samsung
four giants are:
and LG from South Korea are particularly active in
• Intel Corporation, the world's largest similar AI tech areas, together with the Japanese
semiconductor manufacturer, Sony and Hitachi.
• the 100-year-old technology company IBM,
The US is not only leading the AI race via its
• the NEC Labs America research centre, and
tech giants but also in the startup space. The
May 2021
10ATI International Report - USA
big AI players are active investors that support the Apple and Amazon, smaller specialised companies
next AI generation. Intel Corporation invests such as Nuance Communications and Custom
massively in AI startups with Intel Capital - its Speech USA, and large telecom companies such as
corporate venture capital (CVC) arm. Other big AI AT&T and Verizon. Apple, Amazon and Nuance are
CVC players include Google Ventures (GV), also central to natural language processing but
Qualcomm Ventures, Salesforce Ventures, IBM is one of the biggest players. Xerox is also
Amazon Alexa Fund and Dell Technologies Capital. particularly active in this field.
According to CBInsights9, the US AI unicorn space
A key field of applications for the AI
(startups with a valuation over $1 bn) is worth
ecosystem is the rise of digital workers.
€50 bn as of January 2021 (see Figure 10).
UiPath, the AI startup with the largest valuation in
As privately owned data - not internet data the US ($10.2 bn - €8.4 bn as of January 2021)
but corporate data - is now increasingly provides end-to-end automation platforms to
being leveraged, IBM, Microsoft and Oracle eliminate repetitive manual tasks and help private
appear to be very strong players, but we companies transition towards fully automated
have also witnessed the blossoming of AI enterprises.
startups. Scale AI provides training data for AI
UiPath was originally founded in Bucharest by two
applications, Uptake focused on AI solutions for
Romanian entrepreneurs, but is now based in
enterprise data and Gong deploys AI to analyse
New-York and receives a large amount of funding
sales conversations.
from American VC funds such as Accel, capitalG,
The field of computer vision is strongly Earlybrid Venture Capital and Seedcamp. The
shaped by Apple and Facebook, but also Silicon Valley-based Automation Anywhere offers
smaller companies such as Digimarc and similar AI technologies aiming at building digital
Mobileye have been particularly active. workers and is currently valued at €5.6 bn.
Automated speech recognition is led by Google,
Figure 10: The US AI unicorn ecosystem
UiPath Pony.ai Scale AI Indigo Ag
robotic process automation, AI software full-stack autonomous driving data platform for AI natural microbiology
solutions and digital technologies
Faire Anduril Harness Xant.ai
Argo AI curated marketplace for local defense product company Continuous accelerate
self-driving technology platform retailers border surveillance Delivery revenue by
as-a-Service enabling sales
platform teams to build
a better
Avant pipeline
online lending platform that
Gong offers alternatives to its clients
revenue intelligence platform with safe financial products
DataRobot SoundHound
Automation Anywhere AI technology and ROI voice-enabled AI
enterprise-grade, cognitive Robotic Process Automation enablement services and conversational
intelligence
Uptake
enterprise software
Dataminr Globality
AI platform for real-time event
and risk detection
TuSimple
Source: Crunchbase, 2021
In the startup ecosystem, we recently Insurance is one of the most promising fields, as
observed a massive deployment of resources evidenced by the growth of Lemonade – the AI-
towards organisations using AI to advance driven insurtech that filed an IPO mid-2020 for
digital transition in traditional sectors. $3.9 bn (ca. €3.3 bn). Its Forensic Graph Network
9
https://www.cbinsights.com/research-unicorn-companies
May 2021
11ATI International Report - USA
(FGN) analyses relationships between items that American universities and higher education
may seem unrelated to prevent fraud. institutions fuel this ecosystem by providing
a large supply of AI talent and skills. Figure
Automation in banking ranges from smart
11 shows the public and private American
chatbots, biometric authentication, money-saving
institutions that provide 4-year or above computer
applications and of course loan applications and
science degrees in 2017. With 1430 degrees, the
management with companies such as Zest AI.
University of Central Missouri is the institution that
There is also a blossoming ecosystem using
awards the most computer science degrees (7%),
machine learning and deep learning to analyse
just in front of the University of Southern
complex medical and healthcare data. The self-
California and the University of California San
driving vehicles AI segment is particularly vibrant
Diego. Carnegie Mellon University, Massachusetts
in the US. Tesla, of course, is leading the race.
Institute of Technology, Stanford University and
While its IPO was priced at about €1.4 bn the
Cornell University offer the best CS programmes
company reached €725 bn in January 2021. Other
for private institutions; the University of
unicorns include Argo AI, Pony.ai. and Nuro.
California-Berkeley and the University of Illinois-
Urbana-Champaign offer the best CS programmes
for public institutions.
Figure 11: Computer science degrees awarded in US universities in 2017
Central Missouri Arizona State North North Southern California Stanford
-Tempe Carolina at Carolina
Charlotte State at
Raleigh
Illinois at Indiana Purdue
-Main Columbia in the Cornell Illinois
Campus City New York Institute
California-San Diego Technology
California-Los Northwest Georgia North California
Angeles Missouri State State Carolina State
at Chapel -Long
Hill Beach Stevens Institute Virginia Boston
Illinois at Springfield
Technology
Governors State
Colorado
Boulder Texas A &
M -College
Station Rochester
California State
Institute
California-Berkeley -Fullerton Technology
Illinois at Fairleigh Dickinson George
Chicago California San Texas -Metropolitan
Rivier
Binghamton State Diego State
Polytechnic State
Brown
Oregon State
Northern
San Jose State Duke
Illinois Washington in St DePaul
Louis
Colour legend
Private
Public
Source: Data USA & Integrated Postsecondary Education Data System (IPEDS) Completions
The tech giants and the startup AI ecosystem corporate-academia-entrepreneurship linkages
are strongly connected with universities and that characterises the US AI ecosystem. The birth
higher education institutions. University- of the AI giant Google is a story of university-
Industry collaborations and AI spin-offs are industry symbiotic relationships. Google Founders,
facilitated by corporate funding of universities. Larry Page and Sergey Brin filed a patent for the
The governance structure and the VC fund (E14 revolutionary page-rank algorithm while they
fund) of the MIT Media Lab and the MIT-IBM were studying at Stanford. Stanford guided Page
Watson AI Lab are prime examples of the
May 2021
12ATI International Report - USA
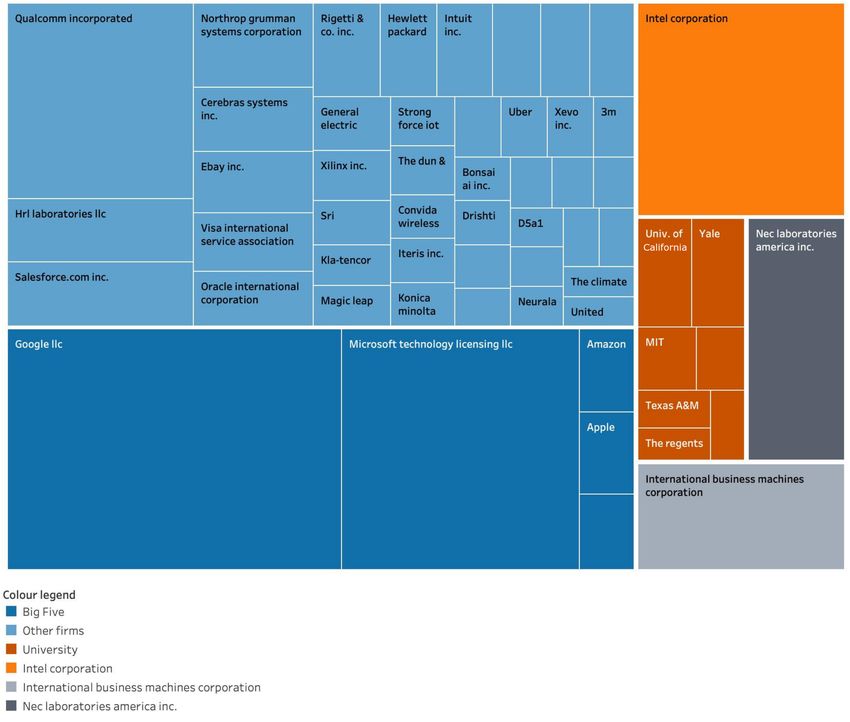
and Brin with investments and legal advice and the California and Texas represent a large share of AI
patent was assigned to Stanford University. patents – mainly with the University of California
system and Texas A&M. Large endowments of top
American universities are key producers of
universities are key for them to stay relevant in
AI technologies. Figure 12 shows that the East
the new AI race and allow them to implement bold
Coast is leading the number of PCT patent
AI visions. MIT recently committed $1 bn (ca.
applications, especially with MIT, Harvard and
€0.8 bn) to create the Stephen A. Schwarzman
Boston University in Massachusetts, but patent
College of Computing which will double MIT’s
applications are also strong in New-York,
academic capability in computing and Artificial
Pennsylvania and Connecticut-based institutions.
Intelligence.
Figure 12: AI patents of US universities
Source: Balland, 2021
The US has a workforce of 1.36 million what one would expect based on its size. Other
software developers but its geography is hotspots include parts of Seattle or Austin.
highly concentrated (Figure 13).
This level of concentration is higher than in
The heart of the Silicon Valley: Sunnyvale & San European regions. It provides agglomeration
Jose (North) is home to 15 200 software economics and network effects that are beneficial
engineers, which is 1 in every 5 jobs and 22 times to the quick scaling-up of complex technologies
such as AI systems.
May 2021
13ATI International Report - USA
Figure 13: Spatial concentration of software developers (data visualisation from data USA)
Source: Data USA, 2021
Notes: RCA= revealed comparative advantage
Figure 14: Spatial concentration of AI professionals
Source: Technopolis Group analysis based on LinkedIn data, 2021
May 2021
14ATI International Report - USA
2.3 Drivers of the US AI ecosystem comparative advantage (RCA) of the US in these
technologies in 2005-2010.
The analysis of the AI ecosystem shows that the
United States has pioneered the AI revolution and The graph clearly shows that the US has very
is still home to an unmatched amount of talent, strong capabilities in some of the core
skills and private capital. The dramatic growth technologies relevant for AI: digital
of the US ecosystem can mainly be explained communication, computer technology, IT
by the extension of early advantage in methods, medical technology, nanotech and
computing technology and the ability to control.
harvest global internet data.
While the US had an RCA of 1.42 in computer
The AI ecosystem was, structurally, very fit for the technology, the EU27 only had an RCA of 0.6. The
ensuing growth of subsequent AI technology. EU27 had relatively low capabilities in digital
Using the principle of relatedness technologies and displayed a stronger command
framework10 it is clear that the US had a of traditional engineering sectors such as
strong pre-existing comparative advantage chemistry and mechanical technologies. The
in technologies that were key ingredients to United States has since doubled down on its
the development and adoption of AI. Figure initial comparative advantage in digital
15 shows the degree of relatedness from a PCT technologies and is now confirming its
patent analysis between 35 technological fields leadership in Artificial Intelligence.
represented as a network, the technology space.
The size of the nodes is given by the relative
Figure 15: The US technological ecosystem in 2005-2010
Source: Balland, 2021
10
Hidalgo et al., 2018; Balland et al., 2019
May 2021
15ATI International Report - USA
The initial comparative advantage of the US the United States. Yahoo!, eBay, Google and
in digital technology did not only provide the Qualcomm were all founded by immigrants. The
skills, talent and technology, but also the most famous entrepreneur in the world, Elon
venture capital needed for AI expansion. Musk, is foreign-born. Half of the Silicon Valley
PayPal is the prime example of employees and startups are founded by immigrants. French-born
founders who have used their private capital to Yann André LeCun is currently Facebook’s Chief AI
build another layer of the ecosystem with the Scientist.
developments of Tesla, Inc., LinkedIn, Palantir
To compete with the US AI ecosystem in the
Technologies, SpaceX, Affirm, Slide, Kiva,
coming decade, other parts of the world will need
YouTube, Yelp and Yammer. The internet
to catch-up in terms of supporting AI technologies,
revolution created billionaires such as Elon Musk
private or public venture capital, risk-taking
(PayPal), Marc Andreessen (Netscape) and
mindset, depth and breadth of internet and
Chamath Palihapitiya (Facebook) who all have had
corporate data, and high-skilled migrant policy.
the capital to re-invest in AI-related projects.
2.4 Role of policy
These investors not only had the capital, but
also the mindset to invest in ‘moonshots’ AI Although the growth of the American AI
ventures. The winner-takes-all characteristic of ecosystem is mainly due to endogenous forces and
AI ventures means that speed is essential. Early resources, the US has recently announced a new
advantages compound more than in any other set of strategic AI policy.
industry. The saying in the software business ‘Ship
Early, Ship Often’ is now truer than ever. Waiting Given the pioneering AI role of American
for the product to be perfect before making it companies and universities, the AI policy of
available to customers is a death sentence. This the Trump administration arrived arguably
has strong implications for public R&D late. Other countries had started to put AI policy
investments in AI that need to adopt a different as an absolute top priority years before, which in
risk management strategy. Money should be this technology space represents a significant time
quickly allocated and risk should not be monitored lag. The noteworthiest plan came from China with
at the project level but at the programme level. its 2017 AI initiative, which proposed multibillion-
Having one project becoming a unicorn while 99 dollar national investments to support moonshot
will fail completely is more of a success than AI projects. The late arrival of a corresponding US
having each project reach ‘safe’ milestones. strategy is demonstrated by a memo sent in spring
2018 by defense secretary Jim Mattis to the White
Besides the technology and venture capital, House. In this strategic memo, Mattis stated that
the US also had access to the key ingredient the United States was not keeping pace with the
of the AI revolution: internet data. As coal ambitious plans of China and other countries, and
powered the machines of the industrial revolution, that it urgently needed an ambitious national AI
such as the steam-engine, data now powers AI policy.
technologies. A good AI system is only as good as
the data it has been trained on. Because it is a The White House responded in February 2019 with
large integrated market using the English an Executive Order signed by President Donald J.
language, US AI champions had the fuel to grow Trump. In this Executive Order, President Trump
at an early stage. They will soon keep building introduced the American Artificial Intelligence
their advantage by using EU internet data. In the Initiative - the United States’ national
EU natural language processing technologies are strategy for maintaining American
more constrained due to cultural diversity and the leadership in AI, later codified into law as
need for various languages to comply with. A great part of the National AI Initiative Act of 2020.
example is Hungary, which launched iWiW, an Among other actions, the American Artificial
online directory that allowed users to search for Intelligence focuses on four key policies and
and connect with friends and friends of friends in practices.
2002, 2 years before Facebook. As soon as The first directive focuses on investment in AI
Facebook entered the Hungarian market, iWiW research and development. The United States
died, and with it, the ability to build an AI layer on federal budget for the fiscal year 2021 (FY 2021)
top of this database. The fragmentation of EU delivered on this request. AI R&D spending at the
AI initiatives is a key reason why the EU is National Science Foundation is about $830 m – ca.
lagging behind the US (and China) in AI €680 m (+70% increase over the FY 2020). The
technologies. Department of Energy’s Office of Science
As with other American innovation success increased their AI investment by $54 m (ca.
stories, American AI leadership would not be €44 m), the US Department of Agriculture by
complete without foreign-born talent. The US $100 m (ca. €82 m) (AI in agricultural systems
AI ecosystem is attracting talent from all over the programme), while the National Institutes of
world. As of 2018, a staggering 40% of the Silicon Health will invest $50 m (€41 m) for new research
Valley – about 800k brains - were born outside of on chronic diseases using AI. The budget for
May 2021
16ATI International Report - USA
Defense AI also increased with the Defense FY 2021. In collaboration with other Federal
Advanced Research Projects Agency (DARPA) agencies, the National Science Foundation
adding $50 m, and the Department of Defense’s launched the National Artificial Intelligence (AI)
Joint AI Center increasing its budget by $48 m in Research Institutes programme.
Figure 16: AI Research Institutes
Source: NSF, 2020
Although these figures show a clear described as a tool to accelerate American AI
commitment to invest in AI R&D they are leadership and that this regulation should not
dwarfed by the American tech giants. hamper and constrain the effective and timely
According to the 2020 EU Industrial R&D development of AI. This led to the development of
Investment Scoreboard, the big 5 (Google, a national AI regulatory policy – the US AI
Microsoft, Amazon, Apple and Facebook) invested regulatory principles - that aims at promoting AI
a mind-blowing €84 bn in overall R&D in 2019. Not based on American values. The 2019’ executive
all of this is oriented toward AI, but our order also specifically directed the National
technological analysis shows that it will be Institute of Standards and Technology (NIST) to
targeting technologies that are to a large extent create “a plan for Federal engagement in the
related to AI. development of technical standards and related
tools in support of reliable, robust, and
The second fundamental policy of this AI
trustworthy systems that use AI technologies”.
initiative is to prepare the American
This led the NIST to develop a plan for Federal
workforce for an AI-dominated world. The
engagement in developing technical standards
goal is to make sure that both the current and the
and related tools by summer 2019.
next generation are capable of taking full
advantage of the opportunities of AI. All federal The fourth critical policy is related to
agencies have therefore been asked to prioritise providing access to high-quality
AI-related apprenticeship and job training cyberinfrastructure and data. This policy aims
programmes. This is also connected to the at making a large variety of AI training and testing
ambition to develop new methods for AI-human datasets accessible and developing open-source
collaborations. software libraries and toolkits. The Federal Data
Strategy was established in 2019 with the goal of
The third key strategy is to increase trust in
“leveraging data as a strategic asset.”
AI technologies to accelerate their adoption
and ensure that the US sets AI technical The American AI policy goes beyond the
standards. It seems that AI regulation is largely mere investment in AI R&D and national
May 2021
17ATI International Report - USA
regulations; it is defensive and geopolitical worrisome. AI technologies have strong network
by nature. The 2019 Executive Order explicitly effects that compound over time and lead to
stated the importance and urgency to protect “our winner-takes-all algorithms. The longer the EU
critical AI technologies from acquisition by waits, the harder it will be to catch up. Because
strategic competitors and adversarial nations.” scale matters so much for AI development, AI
strategy needs to go beyond the Member States
On July 7, 2020, US Secretary of State Mike
level towards a unified EU AI strategy. France,
Pompeo announced that the government was
Germany or Estonia do not stand a chance in the
considering banning Beijing-based TikTok, the
global AI race – but Europe as a whole does.
largest AI unicorn in the world. Pompeo raised the
concern that TikTok was sharing data with Chinese Overall public R&D spending needs to
authorities. A few days later, President Trump increase significantly. The US could build its
announced a decision ordering TikTok’s parent technological advantage on pre-existing digital
company (ByteDance) to divest ownership and technologies and internet VC money. Because the
advised Microsoft to acquire a large share of same amount of private wealth was not created in
TikTok’s American operations. Europe, there is now more than ever a case for
massive public investment. Aiming for moonshots
The ban of Chinese AI in the US directly or
projects also requires the EU to adopt a different
indirectly echoes China's internet censorship
risk management strategy. The metrics for
that has been in place since 1996. China's
success is not that none of the project fails, but
Internet censorship was historically based on
that the portfolio of projects leads to the very best
ideological considerations but turned in practice to
AI systems at a global scale. For maximum
result in a protectionist economic policy that would
efficiency, this investment should be place-based.
plant the seeds to the growth of the AI ecosystem.
AI eco-systems are extremely concentrated in
Chinese internet data has been, in practice, saved,
Europe. It is important to map them and identify
to be harvested by Chinese AI instead of foreign-
the ones that have the most potential to grow
AI. Restricting the use of American internet data
different AI segments: deep learning, machine
to foreign AI companies would have strong
learning, computer vision, all building on slightly
implications in terms of global AI leadership in the
different capabilities.
future.
Europe needs to retain and attract top AI
The next AI policy for the US is not yet clearly
talent. The EU has a critical mass of AI talent but
outlined. The inauguration of Joe Biden as the
there is a net loss of the most talented ones
46th president of the United States took place on
benefiting the US ecosystem. In AI more than in
January 20, 2021, starting a series of Executive
other traditional sectors, attracting the best
Orders to address the most pressing issues of
talent, such as Yann LeCun, Yoshua Bengio or
fighting the coronavirus pandemic and reversing a
Geoffrey Hinton, makes a bigger impact on
series of President Trump policies on climate
technological development than having thousands
change and international relations. Despite these
of proficient AI engineers. The US migration policy
pressing tasks, the new administration has already
has not been pro-migrant lately, and China is still
made some announcements focusing on AI
not able to attract foreign talent at a massive
leadership. While introducing the Executive Order
scale. There is a small window of opportunity for
on Strengthening American Manufacturing,
Europe to send a welcome message and adopt a
President Joe Biden made the statement that
smart visa policy for AI workers. With the
“We’ll also make historic investments in research
increasing amount of remote-work options,
and development — hundreds of billions of dollars
Europe can also double down on the quality of life
— to sharpen America’s innovative edge in
it can offer. European cities have the advantage to
markets where global leadership is up for grabs —
be cities where people want to live.
markets like battery technology, Artificial
Intelligence, biotechnology, clean energy.” European data should be used in priority by
European AI companies. This is probably the
2.5 Lessons for Europe
biggest challenge but also the policy action with
Europe needs an integrated and ambitious AI the highest leverage to close the gap with the US
strategy. AI leadership and sovereignty is critical and China. As Kai-Fu Lee likes to say: “AI is
given that AI can help to tackle climate change usually more improved by more data than better
and other grand challenges. AI can radically AI engineers.” China's Internet censorship led to
transform almost every industry, automate blue the creation of a separate internet world that
and white-collar jobs, and has strong military and allowed Tencent, Baidu, Alibaba and TikTok to
geopolitical considerations as analysed in detail in grow without competing too early with American
the ATI technology watch report on AI11. The giants. This is a key lesson for Europe as EU
growing gap with the US and now with China is internet data is still very free to be harvested. EU
11https://ati.ec.europa.eu/reports/technology-
watch/technology-focus-artificial-intelligence
May 2021
18ATI International Report - USA
data regulations should be developed to increase To influence the impact of AI on society, the EU
the usage of EU data by EU companies. That needs to lead the global race. If we act fast, the
means that new data regulations should at the technological gap with the US and China can still
very least not hurt the small EU companies with close. Member States will need to unite their
complex and restrictive regulations. The amount efforts under a common EU AI strategy,
of regulation may well be proportional to the size coordinate historically high R&D investments,
of the tech giants, but we could also imagine some adopt a high-skilled migrant policy and ensure
form of data tariff in some cases. that EU data powers EU AI ventures.
May 2021
19ATI International Report - USA
Section 3
3 US ecosystem in Nanotechnology
3.1 US leadership in nanotechnology Nanomanufacturing is enabling the transformation
of various other industries including defense,
Nanotechnology is in the strategic focus of the
medicine, transportation, energy, environmental
United States government, in the field of which it
science, telecommunications or electronics. It is
is a global leader both in terms of transnational
also contributing to the performance of the most
patent applications and publications. The US
sophisticated computing and data storage
National Academy of Sciences describes
technologies, which is a very important field in the
nanotechnology as the “ability to manipulate and
times of a data-driven economy. Nanotechnology
characterise matter at the level of single atoms
is multidisciplinary and many research happens at
and small groups of atoms.''12
the intersections of scientific disciplines such as
In 2018, the US accounted for 34.93% of the biology, chemistry, materials science and physics
global patent applications, followed by the EU27 to enable new discoveries14. Key application areas
with a share of 17.31% and Japan (14.48%) as where US research institutes and companies are
indicated in Figure 17. The US has kept this active include 1) advanced nano-engineered
leading position since 2006 as Figure 17 also materials 2) electronics and IT applications –
demonstrates. The patent data shows a nano-scale sensors 3) healthcare,
balanced composition of companies and pharmaceuticals and medical devices –
universities. US authors have also had the highest nanomedicine and nanodevices 4) energy –
share of corporate nanotechnology publications13 nanoparticles in solar cells 5) transport 6)
in the period 2000-2019. environmental remediation15.
Figure 17: Share in global patent applications, PCT + EPO in nanotechnology (2018 – latest available data)
USA Japan China
34,93% 14,48% 10,30%
South Korea Canada Russia
4,18% 2,99% 1,49%
EU27
17,31%
UK
2,84% India
1,19%
Singapore
2,99% Israel
Taiwan
2,69%
1,04%
Source: Fraunhofer ISI calculations
12
https://www.govinfo.gov/content/pkg/CHRG- 14
National Nanotechnology Initiative Strategic Plan, 2016
109hhrg21950/html/CHRG-109hhrg21950.htm 15
https://www.nano.gov/you/nanotechnology-benefits
13
Jan Youtie, 2020
May 2021
20ATI International Report - USA
Figure 18: Share in global patent applications, PCT + EPO in nanotechnology, (2018 – latest available data)
16
USA
14 EU27
Japan
12 China
France
10
South Korea
Spain
Ranking
8 Canada
Singapore
6 UK
Israel
4
Germany
Sweden
2
Belgium
Netherlands
0
2005 2006 2007 2008 2009 2010 2011 2012 2013 2014 2015 2016 2017 2018 2019
Year
Source: Fraunhofer ISI calculations
3.2 Key players of the US nanotechnology facilities with leading-edge fabrication and
ecosystem characterisation tools, instrumentation and
expertise within all disciplines of nanoscale
Key players of the US nanotechnology ecosystem
science, engineering and technology.
include first of all an extensive infrastructure of
research and technology centres, large Another public agency, the Food and Drug
companies, startups and public agencies. Administration (FDA) plays an important role in
fostering and also regulating nanotechnology
Research and technology centres
developments. The Federal Drug Administration
The US National Nanotechnology Initiative strategy for strengthening nanotechnology-
(NNI) has put in place an infrastructure of more related research relies on a robust framework that
than 100 interdisciplinary research and education coordinates regulatory science activities across all
centres and user facilities across the United FDA product centers.
States. These centres provide specialised Figure 19: Locations of the 16 NNCI Sites
equipment and trained staff.
The supported world-class physical user facilities
are the following:
• National Science Foundation - National
Nanotechnology Coordinated Infrastructure16
• Department of Energy’s Nanoscale Science
Research Centres17
• NIST Center for Nanoscale Science and
Technology18
• National Cancer Institute Nanotechnology
Characterisation Laboratory19
The NNCI sites (Figure 19) provide researchers
Source: NNCI Coordinating Office Annual Report, 2020
from academia, small and large companies, and
government with access to university user
16
https://www.nnci.net/ 18
https://www.nist.gov/cnst
17
https://nsrcportal.sandia.gov/ 19
https://ncl.cancer.gov/
May 2021
21ATI International Report - USA
One of the success stories of the NNI is the • Corning
Albany NanoTech Complex at SUNY Albany that • Seagate technologies
demonstrates how public initiatives can transform • Samsung
a stagnating region into a prosperous economic • Dupont
area. Albany is one of the biggest investments in • Global foundries
public-private applied research institutions by the • Agilent Technologies
local government. The complex was established by
According to the analysis of LinkedIn data,
the state government in cooperation with firms
registered professionals with nanotechnology
such as IBM, Advanced Micro Devices, Applied
skills have been employed most beyond the list
Materials and Tokyo Electron.
above also in companies such as the following:
The capital region was formerly described as
• Apple,
‘rustbelt’ and has been written off as a declining
• Thermo Fisher Scientific,
manufacturing area condemned to failure.
• 3M,
Nevertheless, the negative trends were offset by
• Dow,
a focus on high-tech industries such as chip-
• Micron Technology,
making and nanotechnology helping Albany to
• ASML,
become the brainbelt it is today. Their success is
• KLA,
also thanks to their proximity to major cities like
• Western Digital,
Boston and New York City and a thriving
• Google,
educational system20.
• Northrop Grumman.
The rise of the nanotech-cluster in the capital
VC investment and startups
region has been tightly linked to the cooperation
with IBM. The company played a crucial role in the The venture capital sector plays a key role in
successful development of cutting-edge transferring technological knowledge from
technology for commercial wafer, semiconductors research centres to industry and supporting the
and their large-scale production. The New York market uptake of nanotechnology. Many venture
nanocluster is heavily dependent upon capitalists claim that nanotech is one of the great
semiconductors, which is a volatile technology and advanced technology waves that will revolutionise
frequently destabilised by new technological most industries. Several venture capital-backed
innovations or government interventions.21 nanotechnology startups have spun out of
breakthroughs in universities.
Large companies
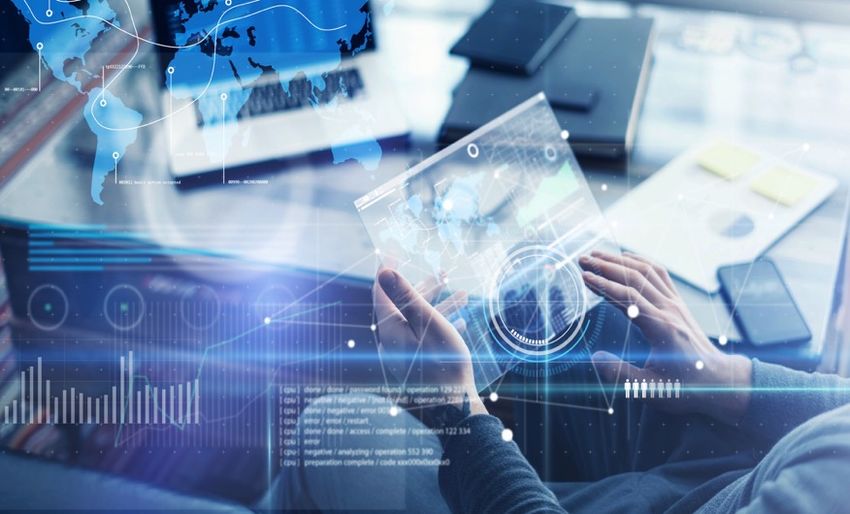
One of the largest private equity investment in the
The top 20 applicants of patents in the field of
period went to Sila Nanotechnologies founded in
nanotechnology consist of eleven companies22.
2011 that is a provider and manufacturer of
The top players registering patents in the United
revolutionary car batteries.
States Patent and Trademark Office in the field of
nanotechnology includes IBM.23 This US-based Another VC backed company is Nanotech
multinational technology company is a leading Industrial Solutions which is the manufacturer of
provider of computer hardware, middleware and nano-sized particles of ‘Inorganic Fullerene-like
software, which also offers hosting and consulting Tungsten Disulfide IFWS2’. Nanotech Industrial
services in the areas ranging from mainframe Solutions has raised a total of €79 m in funding
computers to nanotechnology. Intel Corporation is over 3 rounds. Their latest funding was raised in
the second largest private player in 2019 from a private equity round. Their recent
nanotechnology. It is a multinational technology investors are the London-based EMV Capital and
company manufacturing computer hardware the German Evonik Venture Capital.
including motherboard chipsets, microprocessors,
PredaSAR is an emerging nanosatellite data
modems, mobile phones, central processing units
provider that develops satellite constellations.
and integrated graphics processing units.
Peak Nano Optics has developed a so-called
Other corporations that had most scientific nanolayer gradient refractive index technology
publications in nanotechnology include the which allows for the design and manufacture of
following24: lenses with greater electro-optical performance.
Their solutions enable medical and commercial
• Texas Instruments
sectors to create desired spherical refractive index
• Applied Materials
distributions within the lens.
20 https://www.albany.com/nanotech/from-manufacturing- 22 Wu et al. 2019, p. 10..
to-nanotech/ 23 Wu et al. 2019, p. 12.
21 Wessner and Howell 2018. 24 Yan Youtie, presentation at NSE grantee conference
May 2021
22ATI International Report - USA
Figure 20: Nanotechnology startups (founded after 2005) with the highest total venture capital and private equity
investment in the US (total funding amount in euro)
Sila Nanotechnologies Nanotech Industrial Amprius Seeo Nanoramic Sirrus
provider and manufacturer of revolutionary car Solutions anode out of
batteries nano sized particles of silicon
Inorganic Fullerene-like nanowires for
Tungsten Disulfide IFWS2 lithium-ion
batteries.
Group14 Enumeral N12 SiOnyx Peak
NanoH2O Nano
polymer-based membranes Optics
with a nano-structured
material
Cerulean Pharma
nanotechnology-based therapeutics Light Polymers, UC NuMat
Inc. CEIN
Polarizer Market use
Nanotronics Imaging
and
microscopy and software
Cnano Technology safe
company delivering rapid
carbon nanotubes
testing and analysis
solutions Silatronix Svaya FibeRio
Siluria Technologies FibeRio
Ensysce
material innovation supplies
Onconano Medicine Biosciences
biotech company that
develops pH-activated Lionano Vorbeck Xtalic
compounds Nano Terra material Materials Xtalic
thin electronic
for the Vorbeck offers
Total Funding
18,000,000 285M
Source: Technopolis Group, based on Crunchbase, 2021
Success in nanotechnology research, development Nanotechnology professionals concentrate in
and commercialisation requires a skilled specific states such as San Francisco Bay area,
workforce. The NNI has dedicated a lot of effort to Boston, New York, Washington and Portland (see
strengthen education and outreach through below analysis based on LinkedIn data).
programmes such as the Nanoscale Informal
These professionals are also very much linked to
Science Education Network (NISE Net), a network
specific sectors and industries. In 2020, most
of museums and other institutions.
nanotechnology skilled professionals have been
Most nanotech talent is nurtured at institutes and employed in the higher education and research
universities such as the Massachusetts Institute of sectors followed by industries such as
Technology (located close to Albany), University of semiconductors, biotechnology, chemicals,
California - Berkeley, Stanford, University of defense and space and medical devices.
Illinois, Cornell, Pen State and Georgia Institute of
Technology.
May 2021
23You can also read