AFPIF: The Neutral Case Study - Andrew Owens
←
→
Page content transcription
If your browser does not render page correctly, please read the page content below
AFPIF: The Neutral Case Study
  Andrew Owens
Africa’s Internet Timeline

              1870’s          1990’s             2000             2010              2020

                                                                    HUGE LEAP IN
                                                     START OF
                     FIRST                                           UNDERSEA
                                  FIRST EMAIL      DEREGULATION                      WHERE TO NEXT?
                  TELEPHONE                                        CABLE CAPACITY
                                                     IN AFRICA
 LANDMARK                                                           & PRICE DROP
  EVENTS

                                                        2%                14%              65%
 % INTERNET
PENETRATION

                                  LAUNCH OF
                                                     BIRTH OF                         THE INTERNET
                                PREPAID MOBILE                           CONTENT
                                                   MOBILE MONEY                        OF THINGS
                                    & DATA
INNOVATION

                                                                                       SOURCE: ITU & Teraco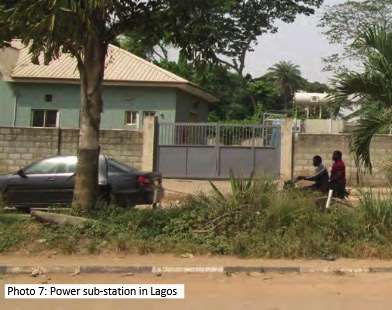
Deregulation Necessity: South Africa Story

• Key to success has been liberalisation on Telco market
• SA Telco deregulated in 2008
• Dark Fibre introduced by DFA in 2009
• Several new Telco's launched 2009 – 2012
• Teraco first neutral facility in Africa established 2009
• ISP’s begun to build own fibre networks
• Submarine cables (SAT3/SAFE 2005, SEACOM 2009, EASSY
  2010)
• International bandwidth pricing drop (2008 – 2013): 2008
  $4000 per 1 Mbps vs today $50.00 per 1Mbps
• Global Telco’s & Content entering SA Google, Akamai,
  Microsoft, Cloudflare, BT, Level3, AT & T etc.)
SA Nuances driving Growth in Colocation

• Many enterprise DC’s are beyond useful life due to power and cooling limitation
• IT loads increasing from 1.5kw per cab to 3kw plus
• Location is key! Access to available space, reliable power key for future growth
• Ever growing computing load = growing cooling load = growing electrical load
• Inability to access additional power from council/landlord
• Business need has evolved over time to a need for 99.999% resilient solution
• Cost of reinvestment massive (R/$, skills, n+1 solution)
• Secondary power as important as primary electrical source. What is your back up to
  Secondary power=more capital?
                     • Eskom/load shedding (3 year reality)
                     • Cable Theft/Transmission failure
                     • Voltage/load fluctuations
• Logistics around diesel storage and securing deliveries in time of need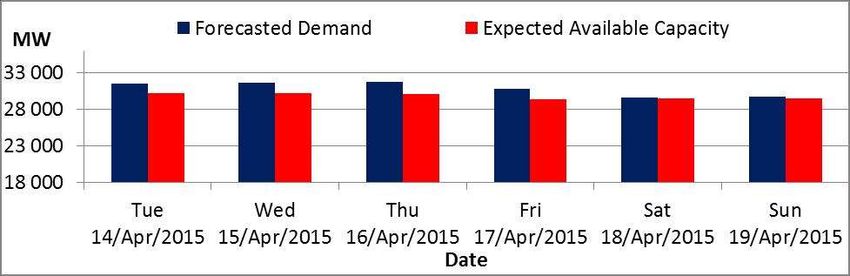
Power…. Southern African Example

Power, Power Power……

•   Eskom – Services Southern Africa Region e.g. South Africa, Swaziland, Lesotho etc.
      •  Ongoing Load Shedding – No leadership and 3x over their budget

      •   Two years behind maintenance e.g. Silo collapsed November 2014

      •   Medupi power station was meant to go live in 2013, only at full capacity in 2018 with
          6x800MW Turbines – only just meet current demand;

      •   Annual power Cost of power estimated more than CPI;

      •   Reality is additional Council power only ready in 2019 which can only meet current
          demand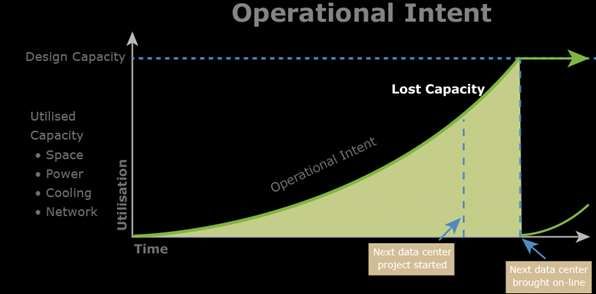
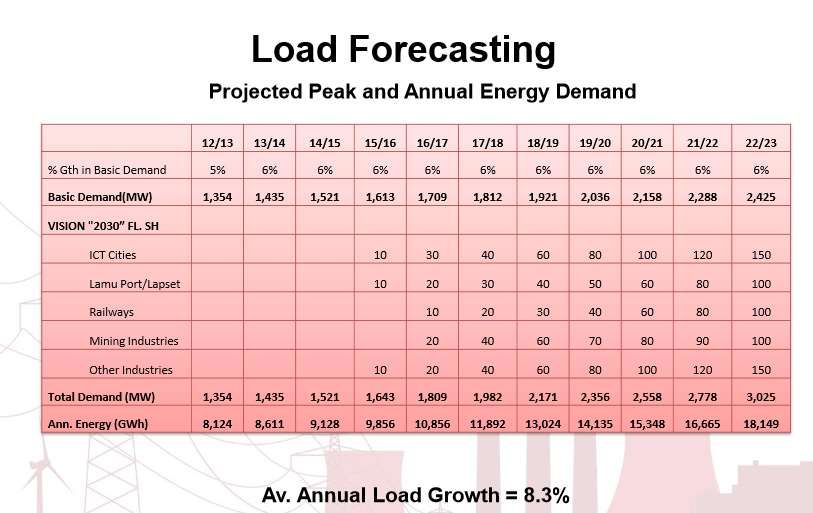
Power…. Kenya Example

Already at 80% of power demand with underestimated annual growth
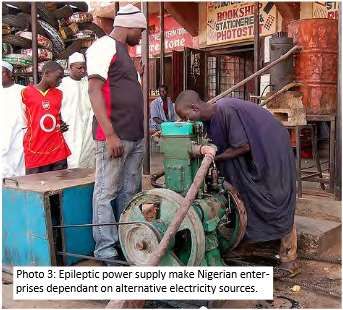
Power…. Nigeria Example

•   Roadmap provides 40,000MW by 2020 of which 200,000MW is actually required to sustain
    growth
•   Currently delivering 4,400MW which peaks at 4,517 MW with a short fall of over 1,482MW
•   Alternative Energy is key to the survival
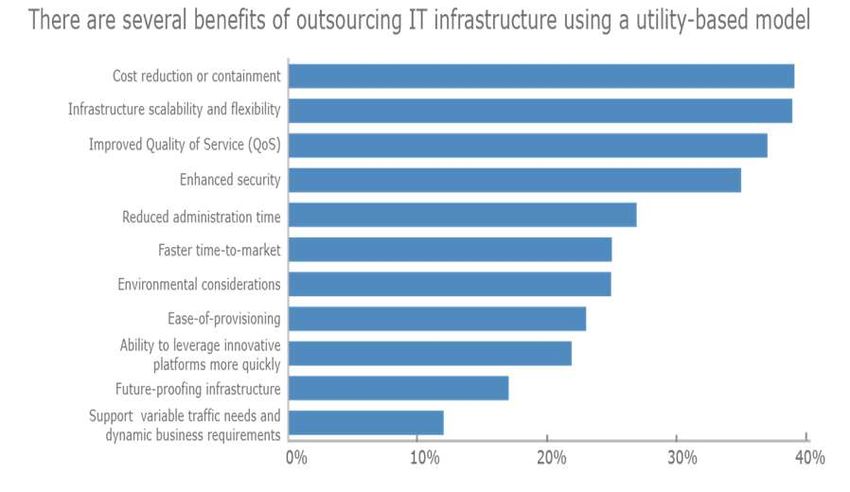
Benefits of Outsourcing IT Infrastructure

                                            Source: Fast Forward: Savvis
Cost of DC Ownership… more than just space

                     • Civil Structure, Substation, Transformers
                     • Power Plants, Cooling, VESDA and Security
                     • Operational and monitoring systems
                          • Capacity requirements over the next 3-8 years
                          • Power requirements – electrical and cooling
                             kw/m2
CAPITAL COSTS
                          • Location – access to sufficient power
                          • Location – access to multiple fibre rings
                     • Average “white space” costs convert at around
                        R200k/m2, which moves to R250k/m2 for Tier III
                        configuration (99.999% uptime) with upgradable
                        power capacity
C U R R E N T   T R E N D S   I N     D A T A     C E N T R E    O U T S O U R C I N G
 Cost of DC Ownership… more than just space

                              • Staffing and operational environment 24*7
                              • Network costs, primary and redundant fibre
                                    connections
                              • Facility rentals
                              • Security
                              • Annual facility and infrastructure maintenance
OPERATING COSTS
                              • Staff skills
                              • Power, Power, Power (100% increase over 5 years)
                                     IT load power plus facilities power (cooling etc.)
                                     A typical DC design 1.4, effective 1.7
                                     Facilities consume between 1 and 2 units of
                                     power for each unit consumed by IT kit
The Facts on our latest JB build
LAND
5% PROF FEES
We are extending our existing 5%
facilities by 5 000m2 and 10MW
DEPLOYMENT
COSTS
• Total of 16 MW of power 15%
30 000m2 of structure CIVILS
20%
10 000m2 operational space COOLING & FIT
OUT
4 100 cabinets 20%
• Total 10 year investment in JB
ELECTRICAL
facility once all phases POWER PLANTS RETICULATION
30% 5%
operational in the region of R1bn
• 16 MW of power equivalent to
30 000 households (actually a net
THE NEW BUILD BY %
saver to the grid)Operational Intent
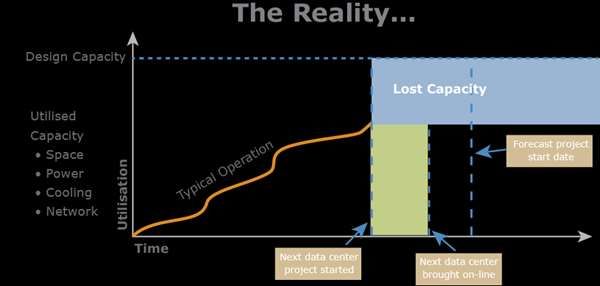
Source: The Elephant in the Room is Lost CapacityThe Reality
Source: The Elephant in the Room is Lost CapacityCarrier/ISP Facility – Transit Effect
EXCHANGE POINT
$120.00FIBRE
PROVIDER A CROSS
CONNECT
CARRIER/ISP $70.00 $120.00FIBRE
ENVIRONMENT PER 1MBPS CROSS
CONNECT
Delivery Times
sometimes
questionable
$70.00
PROVIDER C PER 1MBPS PROVIDER BTeraco’s Secret Sauce: Open, Cost Effective Interconnection
OPEN PEERING
$0.00
PROVIDER A PER
CONNECTION
EXCHANGE POINT
NEUTRAL $50.00FIBRE $0.00 PER
ENVIRONMENT CROSS CONNECTION
CONNECT
SLA Delivery within 72
hours
$50.00FIBRE
PROVIDER C CROSS
CONNECT PROVIDER BEcosystems key to Data Centre Growth!
2010 2011 2012 2013 2014
CT1 JB1 DB1 EXP. EXP.
500m2 1,750m2 2,450m2 3,570m2 6,200m2
DC/FACILITIES
3 35 70 135 185
TERACO
CLIENTS
CARRIERS
CARRIERS CONTENT
CARRIERS
CONTENT MSP’S
LOCAL CARRIERS LOCAL CARRIERS (GLOBAL&LOCAL)
MSP’S FINANCIAL
MSP’S
Market Segment ENTERPRISEThank you – Questions? andrew@teraco.co.za
You can also read