2018 BP EnergyOutlook - Cerna
←
→
Page content transcription
If your browser does not render page correctly, please read the page content below
2018 BP EnergyOutlook
The Energy Outlook considers a range of scenarios…

      Primary energy consumption by fuel                                                                    Carbon emissions

Billion toe                                                                       Billion tonnes CO2

    20                                                                             40
                                          2040
    18
                                                                                   35
    16
    14                                                                             30
                                                                        Renew.*
    12                                                                  Hydro      25
    10                                                                  Nuclear
                                                                                   20
     8                                                                  Coal
     6                                                                  Gas         15                  Evolving transition (ET)
                                                                        Oil                             Internal combustion engine ban (ICE ban)
      4                                                                             10                  Less gas switching
      2                                                                                                 Renewables push (RE push)
                                                                                     5                  Faster transition (FT)
     0
              2016    ET      ICE     Less      RE        FT      EFT                                   Even faster transition (EFT)
                              ban      gas     push                                  0
                                     switch                                              1970    1980      1990   2000   2010   2020       2030          2040
   *Renewables includes wind, solar, geothermal, biomass, andbiofuels
                                                                                                                                2018 BP EnergyOutlook
                                                                                                                                          © BP p.l.c. 2018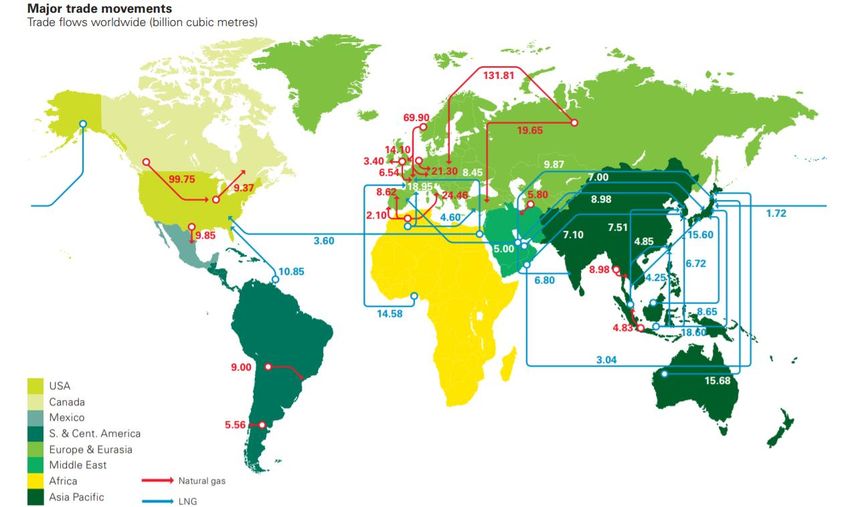
The Energy Outlook considers a range of scenarios…

      Primary energy consumption by fuel                                                                    Gas demand growth
                                                                                                                2016-2040
Billion toe

    20                                                                                     -0,5%           0,0%   0,5%   1,0%       1,5%                2,0%
                                          2040
    18
    16                                                                               Evolving transition

    14                                                                  Renew.*
    12                                                                  Hydro        Less gas switching
    10                                                                  Nuclear
     8                                                                  Coal          Renewables push
     6                                                                  Gas
      4                                                                 Oil           Faster transition
      2
     0                                                                            Even faster transition
              2016    ET      ICE     Less      RE        FT      EFT
                              ban      gas     push
                                     switch

   *Renewables includes wind, solar, geothermal, biomass, andbiofuels
                                                                                                                                2018 BP EnergyOutlook
                                                                                                                                           © BP p.l.c. 2018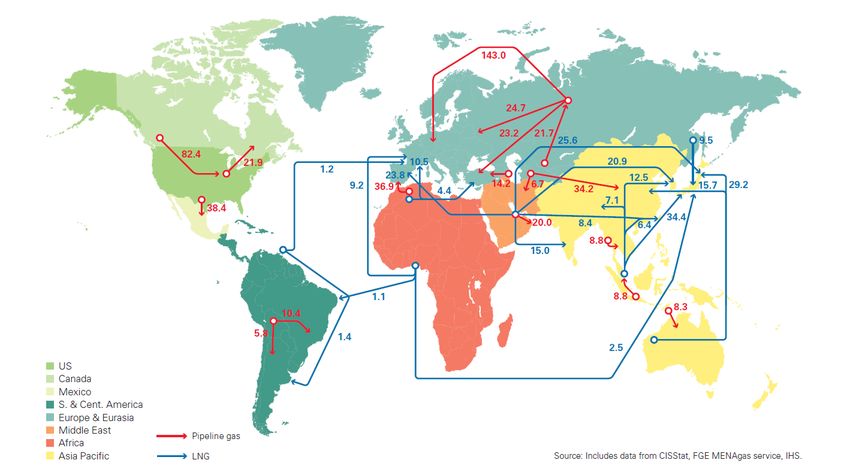
And looks at the energy transition through different lenses
                                                      Primary energy demand
               End-use sector                                 Region                     Fuel
Billion toe

20            Transport                          20       Other               20   Renewables
              Industry*                                   Africa                   Hydro
                                                          Other Asia               Nuclear
              Non-combusted
                                                          India                    Coal
15            Buildings                          15                           15
                                                          China
                                                                                   Gas
                                                          OECD
                                                                                   Oil
10                                               10                           10

  5                                               5                            5

  0                                               0                            0

  *Industry excludes non-combusted use offuels
                                                                                           2018 BP EnergyOutlook
                                                                                                     © BP p.l.c. 2018
Natural gas grows strongly…
Natural gas
Consumption Production Trade
Bcf/d Bcf/d
700 700
N America Europe Pipeline*
China India & Other Asia LNG
600 Middle East CIS 600
Consumed regionally
Africa Other
500 500
400 400
300 300
200 200
100 100
0 0
2016 2040 2016 2040 2016 2040
*Pipeline gas refers to inter-regional pipelinetrade
2018 BP EnergyOutlook
© BP p.l.c. 2018Its growth being largely driven by industrial and power sectors
Gas consumption by sector Gas share by sector
Bcf/d
600 50%
Industry Transport Industry
Non-combusted Buildings
Non-combusted
500 Power
40%
Power
400 Buildings
Transport 30%
300
20%
200
10%
100
0 0%
1990 2000 2010 2020 2030 2040 1990 2000 2010 2020 2030 2040
2018 BP EnergyOutlook
© BP p.l.c. 2018LNG will increase the global availability of gas
LNG exports LNG imports
Bcf/d Bcf/d
80 Middle East 80 China
N America Other Asia
70 70
Russia India
60 Africa 60 OECD Asia
Europe
Australia
50 50 Other
Other
40 40
30 30
20 20
10 10
0 0
1990 2000 2010 2020 2030 2040 1990 2000 2010 2020 2030 2040
2018 BP EnergyOutlook
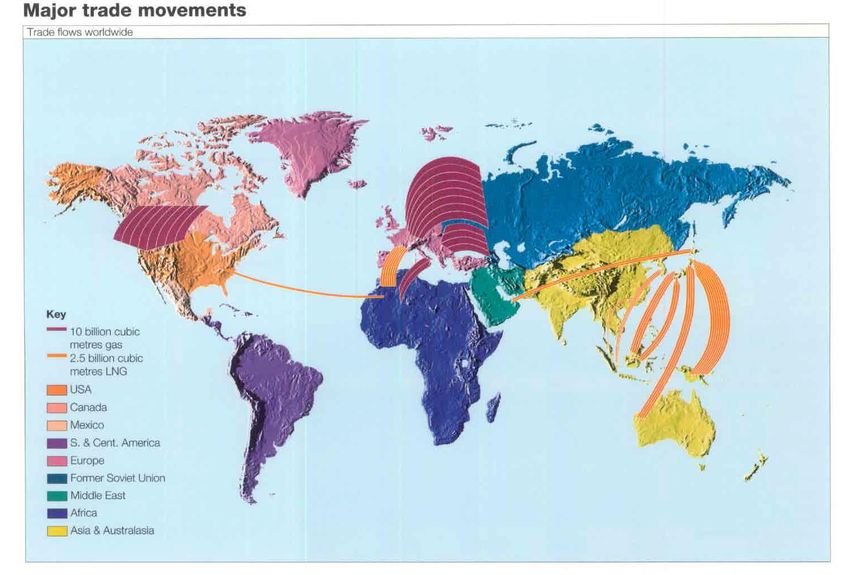
© BP p.l.c. 2018What interregional gas trade looked like 20 years ago (1996)
BP Statistical Review of World Energy
© BP p.l.c. 2018What interregional gas trade looked like 10 years ago (2006)
BP Statistical Review of World Energy
© BP p.l.c. 2018And what it looks like today (2016)
BP Statistical Review of World Energy
© BP p.l.c. 2018What the LNG industry looks like now*
Toho Gas NGC Trinidad
BP Sonatrach JERA Tohoku Electric, Trafigura Jovo
Botas Beijing Gas NationalGrid
Total Enagas Kuwait Petroleum Cheniere PTT
Petronas Vitol Uniper Novatek Guangzhou Gas Gunvor
Sempra INPEX
Shell ADNOC Southern LNG
Hokkaido Gas AES Pertamina
Hoegh LNG Gas Natural Fenosa GNL Chile
Eni EGAS Chevron BW ConocoPhillips Golar
Pakistan State Oil SLNG DEPA H Energy
GSPC Toho Gas Excelerate
Tokyo Gas Fluxys LNG
YPF PGNIG Egegaz Elengy
Statoil Gazprom BHP Kogas
Mitsubishi
RWE Chugoku Electric
Osaka Gas Santos ExxonMobil Anadarko
Samsung
Woodside Sonangol Glencore PLN CPC QatarPetroleum
EDF SK Corp NNPC Vopak Pavillion Hunt Oil GAIL Huadian Corporation
Marathon
Kansai Electric Ophir Mitsui Itochu Kinder Morgan
CNOOC Gasunie CNPC Polskie LNG
Indian Oil Engro Corp Sinopec Petronet
Repsol *List non exhaustiveLNG markets characteristics have changed
Contract length Contract size
Share of total
Share of total
100% 100%
>2 Bcm
75% >10 years 75%
50% 50%As LNG trade becomes more flexible
80 35%
Sport and short term LNG
70 30%
60 Share of total LNG trade
25%
50
20%
40
15%
30
10%
20
10 5%
0 0%
2000 2002 2004 2006 2008 2010 2012 2014 2016
Source GIIGNL annual reports
Short term LNG is defined as contracts of less than 4 years
© BP p.l.c. 2018Disclaimer This presentation contains forward-looking statements, particularly those regarding changes to the fuel mix, global economic growth, population and productivity growth, energy consumption, energy efficiency, mobility developments, policy support for renewable energies, sources of energy supply and growth of carbon emissions. Forward-looking statements involve risks and uncertainties because they relate to events, and depend on circumstances, that will or may occur in the future. Actual outcomes may differ depending on a variety of factors, including product supply, demand and pricing; political stability; general economic conditions; demographic changes; legal and regulatory developments; availability of new technologies; natural disasters and adverse weather conditions; wars and acts of terrorism or sabotage; and other factors discussed elsewhere in this presentation. BP disclaims any obligation to update this presentation. Neither BP p.l.c. nor any of its subsidiaries (nor their respective officers, employees and agents) accept liability for any inaccuracies or omissions or for any direct, indirect, special, consequential or other losses or damages of whatsoever kind in connection to this presentation or any information contained in it.
2018 BP EnergyOutlook
© BP p.l.c. 2018You can also read