Supplement of Simultaneous detection of ozone and nitrogen dioxide by oxygen anion chemical ionization mass spectrometry: a fast-time-response ...
←
→
Page content transcription
If your browser does not render page correctly, please read the page content below
Supplement of Atmos. Meas. Tech., 13, 1887–1907, 2020
https://doi.org/10.5194/amt-13-1887-2020-supplement
© Author(s) 2020. This work is distributed under
the Creative Commons Attribution 4.0 License.

Supplement of
Simultaneous detection of ozone and nitrogen dioxide by oxygen anion
chemical ionization mass spectrometry: a fast-time-response sensor
suitable for eddy covariance measurements
Gordon A. Novak et al.

Correspondence to: Timothy H. Bertram (timothy.bertram@wisc.edu)

The copyright of individual parts of the supplement might differ from the CC BY 4.0 License.
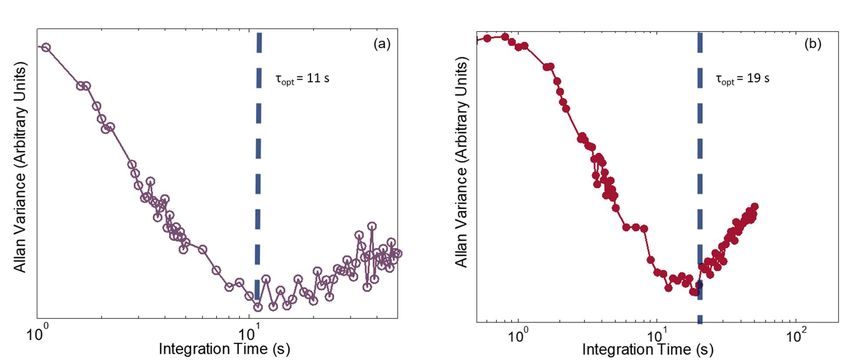
Table S1: Operational ion optic voltages and chamber pressures for the three front end chambers of the Ox-CIMS. Ion
declustering strength is primarily determined by the voltage difference between the Skimmer and BSQ Front. The
nomenclature of Brophy and Farmer. (2016) is used for ion optic component labelling.
Table S2: Calculated binding enthalpies in kcal mol-1 for and reagent ions to water (H2O), hydrogen peroxide
( ), methyl hydrogen peroxide ( ), and nitric acid ( ) in kcal mol-1. Calculations were performed with the
MP2/aug-cc-pvdz-PP theory and basis set.
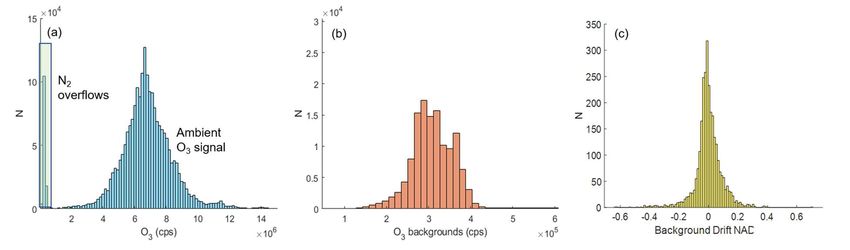
Figure S1: Distribution of 1 Hz reagent ion signal as the sum of ( ∙ ) during the full ambient sampling
period from Scripps Pier. Absolute sensitivity to O and NO scales directly with the magnitude of reagent ion signal. Mean
 3 2
reagent ion signal during the campaign was 1.45 x 10 7 cps corresponding to an absolute sensitivity to O and NO of 1.8 x
 3 2
105 and 1.05 x 10⁵ cps ppbv-1 respectively at a specific humidity of 8 g kg-1.
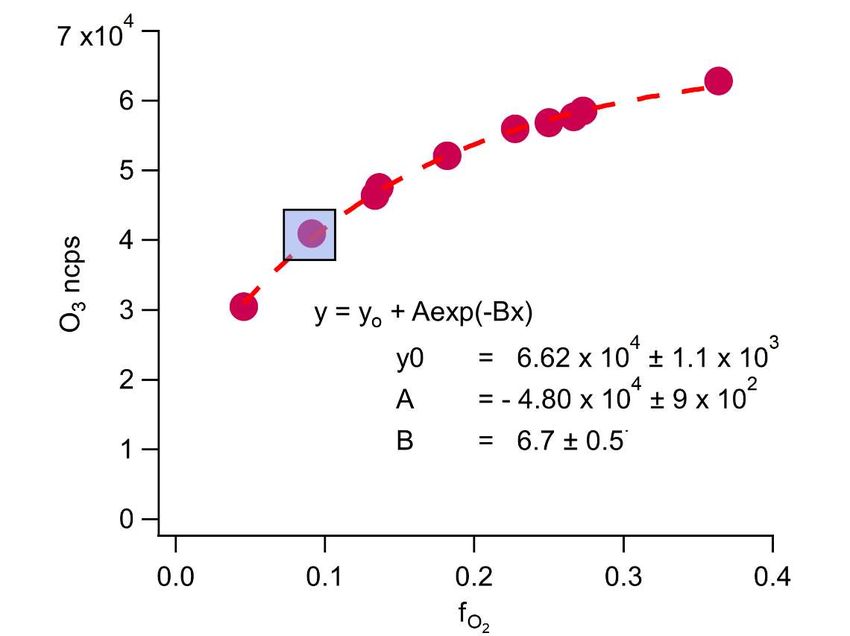
Figure S2: Normalized count rate of background signal at the sum of —m/Q 60 and —m/Q 48 as a function of
oxygen fraction in the reagent ion precursor flow ( ), with least squares exponential fit line. Reagent ion flow was
varied while the inlet was overflowed with zero air containing 380 ppmv CO 2, to isolate the background production of
 in the reagent ion generation source. The background O3 production was 1.5 ppbv at of 0.08 (blue square
overlay) used during ambient sampling.
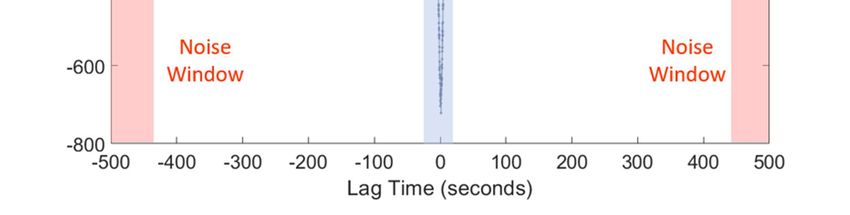
Figure S3: (a) Distribution of observed count rates of the sum of - (-60 m/Q) and (-48 m/Q) during the full sampling
period from Scripps Pier. The green shaded region shows periods of dry UHP N 2 overflow of the sampling line. (b)
Distribution of observed count rates during dry N 2 overflow periods overflow only. Count rates during overflow periods
show high consistency between overflow periods with a mean of 3.1 x 10 5 and standard deviation of 5.0 x 10⁴ counts per
second. Residual during overflow periods is from generation in the reagent ion source rather than off gassing from
instrument surfaces. (c) Distribution of normalized adjacent differences of the mean summed and signal during
each three-minute overflow period. The NAD of overflow periods is a measure of point to point stability of the background
over the full campaign. The 1 σ deviation of the NAD distribution is 9% which gives an upper limit of the variability between
subsequent O3 backgrounds. A 9% variability in the background corresponds to 110 pptv O3 at mean overflow signal of
3.1 x 10⁵ cps.
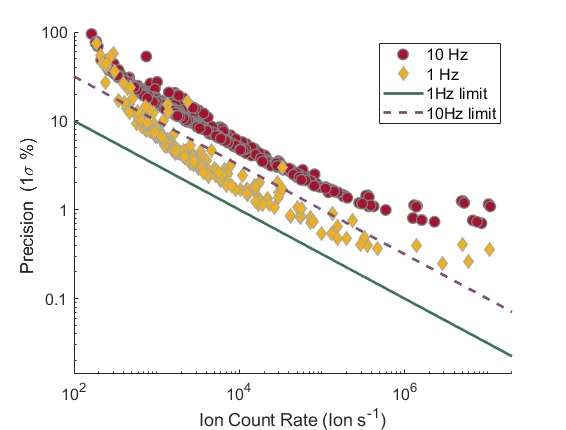
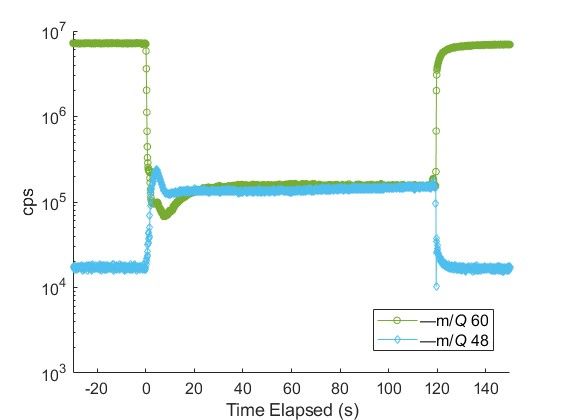
Figure S4: Background count rate of ozone detected as at —60 m/Q and as at —48 m/Q during an N2 overflow
background determination period during ambient sampling at Scripps Pier. Overflow of dry N2 was started at 0 s and
stopped at 120 s. During N2 overflow periods during field sampling, no CO2 was added to drive the reaction product to .
This leads to the detection of a portion of the O3 background signal as during N2 overflow which must be accounted for.
Count rates of were of similar magnitude to the signal during N2 overflow periods during field sampling. From lab
calibrations the sensitivity to at 0 ppmv CO2 and 0 g kg-1 SH is approximately a factor of three higher than .
Accounting for the background signal at increases the mean O3 background during field sampling by 0.6 ppbv (from
approximately 0.7 to a 1.3 ppbv total O3 background).
500
 = 0.75%

 400

 300
 Frequency

 200

 100

 0
 -0.03 -0.02 -0.01 0 0.01 0.02 0.03 0.04
 Normalized Adjacent Difference
Figure S5: Distribution of normalized adjacent differences of 10 Hz O3 signal during a 2-minute dry N2 overflow period
during ambient sampling at Scripps Pier. The 1σ upper limit of precision is 0.75% corresponding to 7.5 pptv precision in
the 1.3 ppbv background O3 signal. Precision limitations from background O3 generation in the ion source are unlikely to
be significant in the overall precision of the instrument during ambient sampling where precision is 300 pptv at 40 ppbv
ambient O3 concentrations.
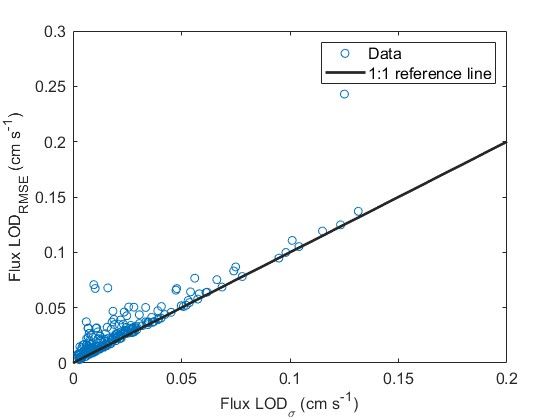
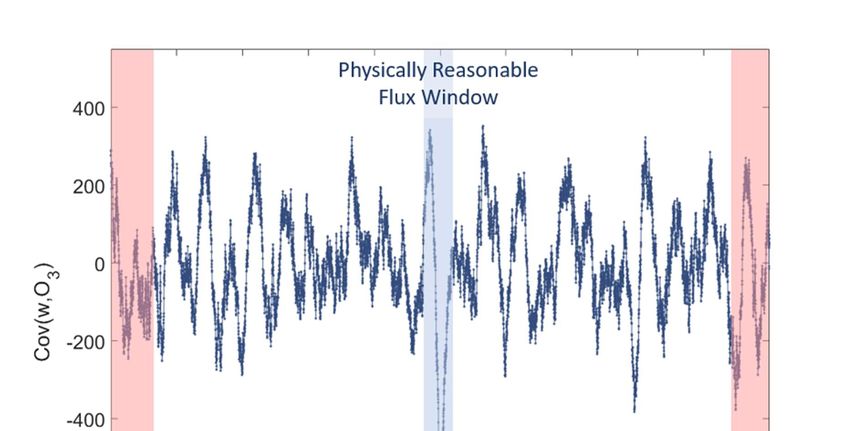
Figure S6: Allan variance determination of optimal averaging time for (a) O 3 and (b) NO2 for sampling of a constant
calibration source in lab for approximately 10 minutes with 10 Hz data collection. The minimum of the Allan variance
curve is the optimum averaging time ( ) that results in the lowest achievable LOD. For O3 was 11 s, and for NO2
 was 19 s.
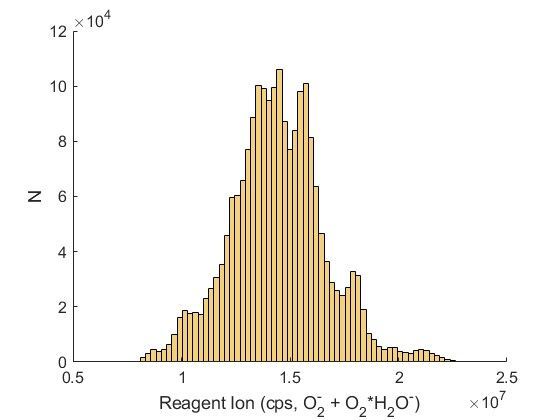
Figure S7: Regression of O3 signal against H2O2 from laboratory sampling of approximately 8 ppbv O3 with fast
introduction of a H2O2 source up to 40ppb. Linear regression shows a loss of 0.06 ppbv of the O3 signal per ppbv H2O2
added. H2O2 is detected as an adduct with the parent ion at —m/Q 66. The ( ) adduct at —94 m/Q is
observed respond with increase with H2O2 introduction but has a persistent high signal which is attributed to a ubiquitous
 ( ) ( ) adduct.
Figure S8: Short-term instrument precision from distribution of normalized adjacent differences against ion count rate for
10 Hz and 1 Hz data averaging. Normalized adjacent differences were calculated for all masses -30 to -250 m/Q for a 27-
minute ambient sampling period. Precision is reported as 1σ of the NAD distribution for each mass. Ion count rates are the
mean unnormalized count rate over the 27-minute sampling period.
Figure S9: Histogram of determined lag times determined as the maximum (MAX) absolute magnitude of the
autocovariance and from the maximum absolute magnitude of a 10 point moving median (AVG) of the autocovariance over
a ±5 s lag window.
Figure S10: Calculation of cross-covariance at very long lag times (-500 to -485 & 485-500 s) used to determine the flux
LOD via the LODRMSE and LODσ methods. Covariance in the physically reasonable flux window of lag times (-3 to 3 s) is
well resolved from the covariance magnitude at long lag times driven by noise.
Figure S11: Ozone auto-covariance for 10 Hz O3 signal for a single flux averaging period. White noise only contributes to
the auto-covariance at a lag of 0 points. Auto-covariance at other lag times is from real long-term coherence in the signal,
either from atmospheric variability or instrument drift.
Figure S12: Ozone flux limit of detection from for 27-minute flux periods determined by the LOD RMSE and LODσ methods.

References
Brophy, P. and Farmer, D. K.: Clustering, methodology, and mechanistic insights into acetate chemical
ionization using high-resolution time-of-flight mass spectrometry, Atmos. Meas. Tech., 9(8), 3969–3986,
doi:10.5194/amt-9-3969-2016, 2016.
You can also read