AFRICAN MARKETS REVEALED - SEPTEMBER 2020 - Stanbic IBTC Bank
←
→
Page content transcription
If your browser does not render page correctly, please read the page content below
AFRICAN
  MARKETS
  REVEALED
  SEPTEMBER 2020

• Steven Barrow • Ferishka Bharuth • Mulalo Madula • Angeline Moseki • Fausio Mussa • Jibran
Qureishi • Dmitry Shishkin • Gbolahan Taiwo

                                                                 www.standardbank.com/research
1
Standard Bank   African Markets Revealed
                September 2020

                Recovering, but not out of the woods
                • The worst of the pandemic will arguably be reflected in Q2:20 GDP growth
                  outcomes. Of the countries in our coverage, we see only a handful of economies
                  escaping recession in 2020.
                • Economic growth in Q2:20 contracted by 6.1% y/y, 3.3% y/y, and 3.2% y/y in
                  Nigeria, Mozambique and Uganda respectively. The Ghanaian economy too
                  contracted by 3.2% y/y in Q2:20, even worse than the 0.4% y/y contraction that
                  we forecast for our bear scenario in the May edition of this publication.
                • The more diversified economies and those with large subsistence agriculture sectors
                  could post mild, yet positive, growth in 2020. Most East African countries fall into
                  this bracket. Egypt too might also avoid a technical recession this year.
                • However, Nigeria, Angola, Zambia and even Botswana, being overly reliant on just a
                  few sectors to drive growth, will most likely contract this year. The only question is
                  by how much?
                • Tourism-dependent economies will take a hit. We still don’t see any meaningful
                  recovery in tourism until a global vaccine is at hand. The weakness in the tourism
                  sector is mostly a BOP problem rather than a growth problem for many African
                  countries. However, the service value chain that relies on a robust tourism sector too,
                  will most likely weigh down growth in these economies.
                • Despite leading economic indicators implying an improvement in business confidence
                  and economic activity in H2:20, we ought to remain cautious given the many
                  unknowns of the pandemic. Still, as most authorities have relaxed domestic
                  containment measures and as external demand for exports has recovered, economic
                  activity has picked up, albeit from a trough in Apr. The outlook though is clouded.
                • Fixed income strategy: as central bank MPCs have eased policy and as global risk
                  appetite has improved, local fixed income markets have rallied since May. Of the
                  markets in our coverage, Uganda, Egypt, Ghana and even Kenya have seen a
                  resumption in foreign portfolio inflows. However, owing to the upcoming elections in
                  Ghana and Uganda, fiscal slippage risks are elevated. Hence, we would wait for
                  better entry levels on both FX and yields. We still favour the Kenya Infrastructure
                  Bonds (KENIBs). Also, given the relative attractiveness of EGP real yields, it may be
                  time to look at those government bonds more closely.
                • FX strategy: given that we see limited scope for the NGN being devalued, we are
                  comfortable selling the USD/NGN NDFs. We see a higher probability of the CBN
                  providing FX supply to the market without necessarily allowing the NAFEX rate to
                  materially adjust higher. Of course, the CBN would be conscious of providing FX
                  liquidity to investors, that would swiftly exit the market, thereby, compounding
                  external account pressures. However, significantly lower OMO yields present little
                  incentive for foreign portfolio investors to stay in the market. We also remain
                  constructive on the EGP and are still sellers of the USD/EGP NDFs. But for the ETB
                  and AOA, we see value in buying the NDFs given the historical appreciation of the
                  real effective exchange rates, combined with the likely pressure that will manifest
                  from the IMF to allow the exchange rates to adjust.

                1
Standard Bank African Markets Revealed
September 2020
GDP growth outlook: recovery expected but outlook clouded
Macroeconomic forecasting inherently comes with its own complexities, now
exacerbated by the unknowns of the pandemic. We therefore present a scenario-based
analysis to outline the various pre-conditions for our forecasts to be accurate.
The IMF now expects GDP growth in Sub-Saharan Africa (SSA) to contract by 3.2% y/y
in 2020, before recovering to 3.4% y/y in 2021. Admittedly, the pandemic has
brought about a confluence of factors that have weighed down growth in most
economies in our coverage.
The pandemic initially dislocated global supply chains which inevitably disrupted trade
and subsequently made it cumbersome for most firms to source raw materials. This has
been compounded by public health restrictions and lockdowns. An abrupt halt to cross-
border travel has dented tourism-dependent economies, and the sharp slide in oil has
spurred external and fiscal pressures for oil-exporting nations.
However, most governments have now begun to ease curfews and lockdowns. So, off a
low base, of course economic activity has started to recover. Figure 1 shows that since
Jun and Jul, most Purchasing Managers Indexes (PMI) indicate some improvement in
business confidence and private sector economic activity.
Figure 1: Purchasing Managers Index
60
50
Index
40
30
20
Aug 17 Aug 18 Aug 19 Aug 20
Egypt Uganda Mozambique
Kenya Nigeria Zambia
Source: IHS Markit
The IMF turned even more bearish on its outlook for SSA when it reviewed its growth
projections in Jun. The expected 3.2% y/y contraction for 2020 is the worst on record
since data collection began. Arguably, Q2:20 GDP growth will probably reflect the worst
of the pandemic. So far, from the latest available data, GDP growth in Q2:20 has
contracted by 6.1% y/y, 3.3% y/y, and 3.2% y/y in Nigeria, Mozambique and Uganda
respectively. Notably, economic growth in Ghana and Rwanda contracted by 3.2% y/y
and 12.4% y/y respectively in Q2:20. These outcomes were far worse that our bearish
scenario estimates.
Even for economies for which we currently don’t anticipate a contraction for the full
year 2020, it is highly probable that GDP growth would have contracted in Q2:20.
Figure 2 shows that while we expect growth in Kenya, Uganda, Tanzania, and Côte
d’Ivoire to decline meaningfully from 2019 levels, we don’t expect them to contract in
2020.
But African countries can’t be said to be a one size fits all. Those economies more
diversified than others, such as the ones above, will probably be a lot more resilient. But
others such as Nigeria, Angola and even Botswana that are heavily concentrated and
2Standard Bank African Markets Revealed
September 2020
reliant on one or a few sectors, don’t really have a hedging mechanism to weather the
storm. All three are set to contract in 2020, it is just a question of how much.
Other economies such as Zambia, Mozambique and even Namibia came into 2020 with
longstanding macroeconomic vulnerabilities, now exacerbated by the pandemic. For
them, economic growth recovering will be protracted.
It would seem wiser to await Q2:20 GDP outcomes before forecasting 2020 GDP
growth for the countries we cover but we choose the more pre-emptive route. Whilst
the growth outlook for 2020 would depend on just how poor Q2:20 GDP was, we also
ought to appreciate certain idiosyncrasies, in various economies across the continent,
that could underpin their resilience despite the pandemic.
For instance, East African economies, being well diversified, also have large subsistence
agricultural sectors accounting for nearly a third of economic activity. So, while the
dislocation of global supply chains in the immediate aftermath of the pandemic had
disrupted commercial agricultural exports, subsistence farming has remained robust.
Figure 2: Standard Bank Research growth forecasts vs the IMF
Tanzania
Ethiopia
Cote d'ivoire
Kenya
Egypt
Ghana
Uganda
Senegal
Malawi
Rwanda
Mozambique
Angola
Nigeria
DRC
Zambia
Namibia
South Africa
Mauritius
Botswana
-15 -10 -5 0 5 10
% y/y
2020 GDP growth (IMF) 2020 GDP growth (SB Research)
Source: IMF; Standard Bank Research
Notwithstanding desert locust invasions potentially destroying harvests in the Eastern
and Horn of Africa region, the weather has been broadly favourable for the agricultural
sub-sector this year. The pandemic hasn’t truly affected subsistence farming.
Admittedly, some economies will face severe headwinds associated with lower oil prices.
For instance, the Angolan economy has been contracting since 2016. Hence, given the
sharp decline in oil prices, structural deficiencies will most likely be exacerbated, which
thereby will result in a rather protracted economic recovery path.
To reiterate, other economies that rely on the tourism sector too could suffer. Despite
many African economies opting to re-open their international airspace between Jul and
Sep, we’d foresee little meaningful pick-up in tourist arrivals until a vaccine is in effect.
Economic activity should modestly recover from H2:20 as domestic containment
measures are lifted and as external demand from key trade partners recovers. However,
the damage during Q2:20 could prove protracted. Jobs lost then are unlikely to be
3Standard Bank African Markets Revealed
September 2020
restored soon, considering the acute cashflow shortages. Scaling back on wage costs
could be a primary strategy to safeguard profitability. One should therefore be most
cautious about GDP growth numbers for H2:20 and even H1:21 where significant and
favourable base effects would unwind. Critically, the nature of the pandemic crisis still
spells a highly uncertain outlook, notwithstanding the recent pick-up in most leading
economic indicators from Jun 20.
Has viral testing been adequate?
From the outset here, we must point out that we’re neither epidemiologists nor virus
specialists. However, arguably any further domestic curfews or lockdowns would present
notable downside risks to our economic growth outlook for H2:20 and 2021. Still, our
base case scenarios do not factor in recurring lockdowns.
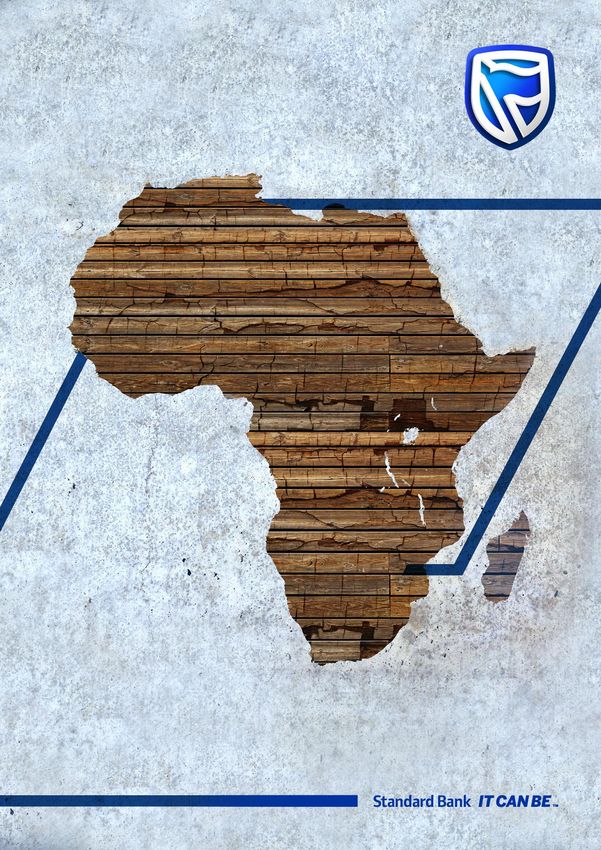
The Oxford Stringency Index in Figure 3 indicates the severity of various countries’
public health restrictions. Uganda, Kenya, Ethiopia, Morocco, Rwanda and Angola have
had quite stringent restrictions — but Tanzania, Zambia, Senegal, Côte d’Ivoire,
Mauritius and Ghana less so.
Figure 3: Oxford Stringency Index
Mauritius
Tanzania
Cote d'Ivoire
DRC
Senegal
Zambia
Ghana
Botswana
Namibia
Nigeria
Malawi
Mozambique
Egypt
UK
Canada
USA
Rwanda
Morocco
Kenya
Angola
South Africa
Ethiopia
Uganda
0 20 40 60 80 100
Index
Source: Our World in Data
There is confusion about the rate of infection and even fatalities not rising as
exponentially on the African continent as elsewhere. Medical experts have suggested
that the continent’s youthful demographic may be in play here.
However, Figure 4 shows how new infections are a function of the number of samples
tested. The more tests, the more cases. Still, the curve has begun to reportedly flatten
but the only way to know for sure would be through adequate testing. The Tanzanian
government, for instance, hasn’t reported new cases since the end of Apr, which could
hardly be assumed to be correct.
As at 31 Aug, South Africa had cumulatively conducted 62.3 tests per 1,000 people
compared to 1.9, 3.0, 8.3, and 8.4 in Nigeria, Mozambique, Uganda and Kenya
respectively. Only Morocco at 52.4 and Rwanda at 31.6 were anywhere close to South
Africa, when assessing cumulative Covid-19 tests per 1,000 people. However,
comparatively, testing in Africa remains well below advanced economies, as the UK and
US have tested 211.0 and 258.3 tests per 1,000 people.
4Standard Bank African Markets Revealed
September 2020
Furthermore, given the weak health infrastructure across most of Africa, the health
system may well not withstand a rapid rise in cases. This concern would abide until a
vaccine is found. Anecdotal evidence though implies no indications of an overburdened
healthcare system. Bed capacity still seems adequate, but this could be a function of the
large number of asymptomatic cases. Most Ministries of Health have asymptomatic
cases at an average of around 85% of all active cases.
Figure 4: Covid-19 testing
Nigeria
Malawi
Mozambique
Cote d'Ivoire
Zambia
Zimbabwe
Ethiopia
Uganda
Kenya
Senegal
Tunisia
Ghana
Rwanda
Morocco
South Africa
UK
Russia
USA
0 50 100 150 200 250 300
Cumulative total per thousand
Source: Our World in Data
Indeed, Figure 5 shows the rate of recoveries as notable, perhaps underscoring why the
health system hasn’t been overburdened. In any case, a health crisis is not the typical
economic shock we model as a rule. Hence, a fair degree of uncertainty will persist until
there is a medical solution and a widely distributed, and widely accepted one, for Africa.
Figure 5: Covid-19 recoveries
120 000
100 000
80 000
60 000
40 000
20 000
0
Uganda
Namibia
DRC
Rwanda
Zambia
Botswana
Cote d'ivoire
Morocco
Nigeria
Senegal
Ghana
Kenya
Ethiopia
Mozambique
Egypt
Positive cases Recoveries
Source: Various Ministry of Health departments; John Hopkins
Fiscal policy: near-term expansionary bias
Policymakers have been expected to do all it takes to mitigate and curb the negative
impact from the pandemic on economic growth. Critically, fiscal policies have had to
become swiftly expansionary — but at the risk of being downgraded by credit rating
5Standard Bank African Markets Revealed
September 2020
agencies. And, many economies lacked healthy fiscal positions even before the
pandemic.
The subsequent urgency to raise social and healthcare spending, in addition to the
likelihood that fiscal revenues would slide, will probably result in significantly wider fiscal
deficits in 2020 and perhaps even in 2021.
For instance, in Botswana, the government has established a Covid-19 relief fund
amounting to 1.1% of GDP to fund a wage subsidy of 50% of workers’ salaries, for
businesses affected by the pandemic. That said, due to the conservative fiscal posture
that the government tend to adopt, this wider budget deficit would still predominantly
be financed via domestic savings in Botswana.
Already there have been notable revisions in fiscal budgets for some countries. In
Ghana, the government now expects the budget deficit to widen to 11.4% of GDP in
2020, from their initial target of 4.7%. They had been keen to maintain a fiscal deficit
responsibility rule below 5.0% of GDP over the past 3-y. However, concerningly, they
now don’t expect to return within this 5.0% threshold until 2024. Of course, with
elections coming up in Dec 20, fiscal slippage risks are elevated, and it seems like the
consolidation path may be gradual too.
In Egypt, the FY2020/21 budget estimates seem way too ambitious, especially amidst
the economic shortcomings induced by the pandemic. This perhaps doesn’t come as a
surprise, considering that the authorities had already finalized most of their budget
estimates by around Mar 20. Therefore, the planned fiscal deficit of 6.3% of GDP for
FY2020/21 will probably be revised higher, perhaps before end Sep. Bear in mind that
the Egyptian government provided a fiscal support package worth 2.0% of GDP to
mitigate the detrimental economic impact. Additionally, the authorities have also
provided a raft of tax holidays and the option for the payment of taxes in instalments,
for certain affected sectors. The market also remains concerned that military and
defence related expenditure would probably have to increase, following parliamentary
approval to engage in military action, in neighbouring Libya.
Kenyan authorities too have struggled to consolidate public finances despite the
promises of the last 3-y. Covid-19 and the subsequent slowdown in economic activity
will perhaps delay such consolidation by at least 1-y. Still, 2021 is a pre-election year
and we struggle to see how the government could lower its fiscal deficit at least until
2023. We’d even expect a significant revision to FY2020/21 fiscal estimates in the
Budget Review Outlook Paper (BROP) in Oct.
The Zambian government will publish the FY2021 budget earlier this year, on 25 Sep.
The FY2020 budget was initially expected to decline to 5.0% of GDP, from an outturn
of 6.4% in the previous fiscal year. Hence, notable revisions are likely in the 2020
budget. However, the 2021 budget will perhaps be the more important focus, especially
given that the IMF has had reservations on Zambia’s management of public finances for
the better part of the last 3-y. The Zambian government’s request for a Rapid Credit
Facility (RCF) from the IMF was not approved due to the debt position being classified
as unsustainable by the multilateral agency.
We noted in May both Zambia and Angola as being at risk of a technical default over the
coming year or two. The market has seen this as possible for Zambia as far back as two
years ago already. However, Zambia has muddled through, even though FX reserves
have barely budged. The ongoing external debt restructuring process perhaps bodes
well for Zambia, if successful. But we aren’t clear if an IMF funded programme would
need to be in place for external creditors to agree to a restructuring. Nevertheless, the
fiscal position and plans to consolidate will probably be the primary precursor for the
IMF to even begin negotiations on a programme. Of course, 2021 being an election
year in Zambia, and the recent poor track record on scaling back on public expenditure,
implies little fiscal consolidation over the coming year according to us.
6Standard Bank African Markets Revealed
September 2020
In Angola, due to lower oil prices, fiscal and external pressures will increase. However,
these pressures should be alleviated by the recent suspension of Angola’s debt service
from the Paris Club until Dec 20, in addition to the World Bank’s Debt Service
Suspension Initiative (DSSI). According to media reports, under the DSSI, around
USD2.6bn in interest payments could be deferred. Also, based on media reports again,
Angola may also benefit from debt restructuring talks with China, with most of this debt
contracted on commercial terms. Commercial debt accounts for 80% of Angola’s debt
stock. The potential savings on debt service owed to China being reported are worth a
notable USD22.0bn. Crucially, the revised budget published in Jul indicates a decline in
external debt service costs to USD4.5bn from USD7.0bn initially, perhaps reflecting
some of these debt service relief initiatives.
Figure 6: External debt service as a percentage of exports
40
30
20
10
0
Angola
Namibia
DRC
Rwanda
Tunisia
Uganda
Botswana
Mauritius
Zambia
Ghana
Kenya
Morocco
Nigeria
Mozambique
Egypt
2017/18 2018/19 2019/20
Source: Various Ministries of Finance; Standard Bank Research
Monetary policy: on hold
Back in Mar/Apr when the world was looking to policymakers to step in and mitigate
the health crisis, there was a stark contrast between the countercyclical support options
of African policymakers, compared to advanced economies. In the latter, monetary
policy has probably run out of road. However, in African economies, it could be the
opposite. There was room to adjust monetary policy, although not sufficient space for
expansionary fiscal policies. Most MPCs have cut key benchmark rates and even slashed
reserve ratio requirements since Mar. Of the countries from our coverage, it was only
the Banque Centrale du Congo’s MPC which has hiked rates by a whopping 11 ppts, to
18.5%.
Most MPCs are now expected to remain neutral until H2:21. However, an easing bias
will likely persist. There has been a pick-up in economic activity from Jun, albeit from a
low base in Apr, which could embolden most MPCs to stand pat. However, in those
markets where policymakers are not entirely convinced of an economic recovery, further
cuts are still possible, but we’d foresee little scope for that from current levels.
Underlying inflation pressures remain subdued in most economies; the modest recovery
in economic activity since Jun won’t be sufficient to bring about durable demand-driven
inflation pressures. In some countries where core inflation has been edging higher, it’s
been largely because of higher public transport costs due to social distancing rules. This
effect will fade but in other countries such Angola, Zambia, Nigeria, Ethiopia and even
Ghana, structural problems abide, resulting in somewhat stickier inflation.
7Standard Bank African Markets Revealed
September 2020
Inflation will probably remain elevated in markets such as Ethiopia where governments
continue to monetize deficits. We will also keep an eye on M2 money supply growth or
even the monetary base for say Zambia and Angola which look the more prone to be
tempted into monetizing their deficits.
Figure 7: Annual M2 money supply growth
45
40
35
30
25
%
20
15
10
5
0
Jan-18 Oct-18 Jul-19 Apr-20
Angola Zambia
Source: Bloomberg, Bank of Zambia
The earlier interest rate cuts in the year continue to split opinion in terms of their
effectiveness. Asset quality has deteriorated, thus, cutting rates won’t do enough to
spur private sector credit growth. But cutting rates and improving liquidity in various
interbank markets was perhaps pivotal in avoiding a banking crisis, in our view.
Fixed income strategy: tactical opportunities
Despite the swift transition to expansionary fiscal policies which has also resulted in
larger domestic borrowing plans, most local fixed income markets have rallied since
May.
In Mar/Apr when portfolio outflows rose due to the acute deterioration in global risk
sentiment, local fixed income markets sold off. However, as central banks have eased
policy since, local fixed income markets have rallied. Of course, the excess liquidity
availed by the looser monetary policy across various economies has largely been
channelled towards government paper, rather than extended to the private sector in the
form of loans. And so, aggregate demand has weakened, and asset quality for
commercial banks has faltered. Hence, local banks mostly prefer investing in
government paper despite the expectation of wider fiscal deficits.
We continue to hold the Kenya Infrastructure Bonds (KENIBs) in our shadow portfolio.
Moreover, due to elevated fiscal slippage risks ahead of elections in Ghana and Uganda,
we prefer to remain somewhat cautious for now and await better entry levels, for both
yields and FX. However, the longer end of the curve in Egypt deserves a closer look
given the relative appeal of real yields. In Zambia, while its perhaps tempting to
potentially explore the 2-5y government bond tenors, we are happy to revisit this trade
once there is more clarity on the FY2021 budget and IMF discussions.
8Standard Bank African Markets Revealed
September 2020
Figure 8: Real 10-y government bond yield
20
15
10
%
5
0
-5
Uganda
Tunisia
Namibia
Tanzania
Rwanda
Zambia
Malawi
Ghana
Botswana
Lesotho
Mauritius
Egypt
Kenya
Nigeria
Nigeria
Morocco
Source: Bloomberg; Standard Bank Research
G10 view: global recession; short and deep but with legacy effects
The epicentre of the pandemic-induced recession would have been in Q2:20; the
rebound in H2:20 should therefore prove substantial, if not enough to avoid a dramatic
fall of near 7% in GDP for the year in advanced countries. Around two-thirds of this
decline will likely be made up next year, assuming that major nations can roll out a
vaccine in early 2021.
Still, the recovery is likely to be gradual and the legacy effects of the pandemic will
persist for years if not decades. Legacy effects could include sharp increases in
government and private debt, higher precautionary savings, lower productivity, and
more. This would imply that advanced economies will have lost some of their productive
potential long after the pandemic is over. Policymakers realise that the support they are
providing will have to persist for a long time on the monetary side and scaled back very
gradually on the fiscal front. The 2008 global financial crisis (GFC) consensus, such as it
is that, seems to imply that governments had tightened fiscal policy too fast in the
aftermath of that crisis. They would probably not look to make that mistake again.
Market pricing shows that a very elongated period of low rates is baked into
expectations. In the US, Fed Chair Powell has said that rates would stay low for years.
The Overnight Interest Swap (OIS) market, for instance, puts this at five-years plus and
we don’t see that as too pessimistic.
Figure 9: Low rates for 5-plus years
1
0.8
0.6
%
0.4
0.2
0
1 YR 2 YR 3 YR 4 YR 5 YR 7 YR 10 YR 12 YR 15 YR 20 YR 25 YR 30 YR 40 YR 50 YR
US Overnight Interest Swaps (OIS) curve
Source: Bloomberg
9Standard Bank African Markets Revealed
September 2020
What’s more, the Fed could prove to be the first of the major central banks to hike
policy rates. The ECB’s lesson from the GFC is to refrain from tightening policy too
quickly. Policy rates could therefore stay at zero in the Eurozone for a decade.
Government bond yields will be nailed down by low policy rates, with not even inflated
budget deficits likely to lift yields materially. The next significant test of the bull market
in government bonds probably won’t occur until central banks start to slow their bond
purchases. A repeat of the infamous ‘taper tantrum’ of 2013, when the Fed signalled
less bond-buying support, hit emerging markets hard. We don’t expect a repeat because
investor positioning towards EM assets is lighter and the Fed’s recent change to its
longer-run monetary policy strategy suggests a greater tolerance for higher inflation
and hence extended treasury purchases. In our view, there is unlikely to be a rise in
treasury yields that adversely impacts risk assets, such as emerging market bonds and
currencies. Could a surge in the value of the dollar do the damage instead? We don’t
think so. In fact, we expect the dollar to undergo a significant long-run downtrend that
sees it lose around a quarter of its value in the coming years against currencies from
other advanced nations.
Figure 10: Dollar expected to enter a downtrend
150
140
130
120
110
100
90
1973 1978 1983 1988 1993 1998 2003 2008 2013 2018
USD Trade-weighted index (major currency index)
Source: BIS
The dollar tends to undergo multi-year trends; the last being a rally of some 40%
against other major currencies which began in 2011. This has left the dollar overvalued.
More significantly, downtrends usually occur when the US undertakes significant fiscal
easing that exacerbates the country’s twin deficit problem, leaving the country more
dependent on inflows of capital.
Our sense is that inflows of capital to the US could be compromised by the US’s very
low rate structure and the way in which the Trump administration has undermined
confidence in the US as a dominant global power with its efforts to reverse globalisation
and multilateralism. The Covid-19 shock did not lead to a surge in the dollar against
other major developed currencies, unlike the GFC, which we think is indicative of the
US’s declining appeal during times of stress.
If the dollar is proving less attractive in a crisis, we think some of its assets, such as
equities, might also be less attractive than previously in periods when global risk
aversion is low. US stocks are undoubtedly expensive relative to most other markets,
while some other regions, specifically the Eurozone, have seen policymakers take
important proactive steps during the Covid-19 crisis, that make their assets more
attractive. One example of this is the European Commission’s plans to issue euro debt in
significant size to pay for Covid-19 aid across the region.
Our call for dollar weakness is not dependent on the outcome of the US presidential
election on 3 November. We are assuming a victory for Democrat Party candidate Biden
10Standard Bank African Markets Revealed
September 2020
but, should this prove wrong, we suspect that any early lift for the dollar, conditioned
on expectations for more US tax cuts, would soon disappear. Indeed, any such cuts
during a second term for President Trump, would only exacerbate the US’s twin deficit
problem and lead to even more weakness for the dollar over the long haul.
The bottom line is that economic and financial market developments in advanced
countries should be consistent with a positive backdrop for emerging market assets. Of
course, hiccups could occur, such as a second major Covid-19 wave that lifts risk
aversion, or a quick end to central bank support from the likes of the Fed. But, at this
stage we think the risks of such adverse events are relatively low.
FX strategy: EGP likely to continue shining
Most exchange rates seem to have stabilized, following the sudden deterioration in
global risk sentiment in Mar, which resulted in a dampening of confidence and sharp rise
in foreign portfolio outflows.
However, as global risk appetite has come around, local units have found some much
needed stability. The UGX, EGP and even the GHS have benefited from a resumption in
foreign portfolio inflows.
Unfortunately, moral suasion in some markets has effectively compounded USD liquidity
shortages. For the non-oil exporting economies, Tanzania, Malawi and Zambia are
exhibiting these deficiencies. In Tanzania and Malawi, we don’t see a fundamental issue
with the Balance of Payments (BOP). Thus, these USD liquidity issues are largely
manifesting in the respective central bank’s reluctance to supply USD to the market. In
Zambia, despite higher copper prices, the dollarization of mining taxes that now ought
to be paid directly to the BOZ, is most likely resulting in USD liquidity issues.
Meanwhile, not surprisingly, the outlook for the NGN continues to split opinion,
following the external pressures that have transpired, as international oil prices
collapsed. We have recommended selling the 12-m USD/NGN NDF, a trade that has
since delivered a direct return of 4.4% in USD terms, in our shadow portfolio. Clearly, as
advocates for selling USD/NGN NDFs, we see little scope for the CBN to devalue the
NGN. We see a higher likelihood of the CBN resuming FX sales to BDCs at current FX
levels, rather than allowing the official or the NAFEX rates, to move higher. Indeed,
following the resumption of international flights, FX sales resumed, albeit with
restrictive conditions to engage in forwards.
Admittedly, even if the CBN was to sufficiently provide FX liquidity to clear the current
backlog, they are obviously concerned that most investors will be quick to exit the
market straight away. After all, OMO yields are probably too low to embolden portfolio
investors to retain their holding in NGN assets. The CBN would probably have to make
these yields more attractive to retain foreign holdings in the NGN fixed income market.
Another market where we are happy to sell the NDFs, is for USD/EGP. We
recommended this position in May and it has since delivered a direct USD return of
8.0% in our shadow portfolio. Real EGP yields remain very attractive on a relative basis
to other markets on the continent. In fact, we get the sense that the Central Bank of
Egypt’s MPC is advertently looking to maintain attractive real yields by way of retaining
foreign portfolio investors invested in government paper. Bear in mind that this offshore
investment is currently heavily concentrated at the shorter-end of the curve. We will
continue holding this position in our shadow portfolio.
We have been recommending buying NDFs for USD/ETB and USD/AOA. At the time of
writing, our ETB trade recommendation had provided a direct USD return of 6.4%, while
the AOA trade had lost 0.3%. The ETB is overvalued on a real effective basis and with
inflation likely to remain sticky, as the government continues to monetize their deficit,
we continue to see an ETB depreciation bias on a multi-year basis. Similarly, for the
11Standard Bank African Markets Revealed
September 2020
AOA, the central bank could temporarily manage the currency in a tight range as the
USD linked bond repayments fall due in Q4:20. However, thereafter we suspect that the
AOA will begin to depreciate again, driven by both IMF pressure under their programme
as well as due to worsening external account shortfalls.
Political calendar
Earlier this year, due to the pandemic, the Ethiopian government postponed elections
supposed to be held in Aug to a later date in 2021. However, regional elections were
held earlier this month in Tigray, which the government has termed as unconstitutional
and illegal. These tensions will only be compounded as the government prepares for
elections next year.
Political tensions in Côte d’Ivoire are also heightened. President Outtara’s
announcement to run for a third term has received mixed reactions. According to the
constitution, a two-term limit for the president is permissible. However, the government
has argued that since the constitution was reformed in 2016, Outtara’s term count
should be reset. This decision has already resulted in demonstrations. Of course, given
that the post-election violence from 2011 is still very fresh in people’s minds, these
recent developments will create anxiety for investors.
Ghana too is gearing up for elections in Dec, and, judging by history, political stability is
likely. The two major parties, the National Patriotic Party (NPP) and the National
Democratic Congress (NDC), have over the past 25-y alternated power every 8-y. Even
if the elections went the opposition’s way, we wouldn’t foresee any significant shifts in
economic policy especially given the track record of the opposition candidate, a former
president.
Elections in Tanzania will be closely watched by the international community. The
government has in the recent past been accused by human rights groups of muzzling
the opposition and media. Consequently, the government has faced obstacles in
sourcing external concessional funding, which has inevitably delayed the
implementation of infrastructure projects.
African Eurobonds
African Eurobonds have rallied sharply since May, making it very hard to justify new
recommendations at this stage. We benefited from this rally, as we had shifted to a 12%
overweight position in our SBAFSO index in May.
Figure 11: Weekly return SBAFSO vs EMBI
10
5
0
-5
%
-10
-15
-20
Mar 20 Jun 20 Sep 20
EMBI Index SBAFSO Index
Source: Bloomberg; Standard Bank Research
12Standard Bank African Markets Revealed
September 2020
However, with the upcoming US elections, it’s perhaps wise to reduce this exposure
given the risk that global sentiment could deteriorate in Q4:20. We have therefore
opted to re-align our portfolio to a 4% overweight position.
Notably, we have shifted to an underweight position in Côte d’Ivoire and Zambia. We
have also reduced our overweight position to 1% from 2% previously for Ghana, Egypt,
Kenya, Nigeria, Angola and Senegal.
Our bias favours the hard currency credits of the more diversified economies like Ghana,
Egypt and Kenya. However, in markets like Angola and Zambia where there is clearly an
elevated probability of default over the near- to medium term, we are keen to reduce
exposure. That being said, a further muddle-through, combined with an external debt
restructure in Zambia and debt service suspension savings in Angola, could make these
two credits outstanding contrarian trades.
Hedging CNY exposure
Trade conducted between Africa and China is still predominantly done in USD. Yet, for
importers, it is often cheaper to hedge CNY exposure than to hedge USD exposure.
Standard Bank offers forwards that allow African importers to hedge CNY exposure.
Indicative CNY forward prices
Historical prices Forward prices
-12m -6m -3m spot +3m +6m +12m
CNY/BWP 1.55 1.68 1.67 1.67 1.66 1.66 1.65
CNY/GHS 0.75 0.81 0.82 0.86 0.89 0.92 0.97
CNY/KES 14.53 14.86 15.09 16.07 16.08 16.14 16.26
CNY/MUR 5.09 5.54 5.68 5.87 5.83 5.80 5.75
CNY/ZAR 2.12 2.52 2.46 2.38 2.39 2.40 2.42
CNY/UGX 514.10 535.14 527.78 543.81 549.29 553.96 572.79
Source: Bloomberg Standard Bank Research
13Standard Bank African Markets Revealed
September 2020
African Eurobonds
Spread, bps Spread change, bps Total Return, %
Name Moody's/Fitch Mid Price Mod Dur Yield, % Over UST Z-Spread 1 wk YTD 12mths 1 wk YTD 12mths
ANGOL 9.5% 12-NOV-2025 Caa1/CCC 91.085 3.8 11.86 1,166 1,153 -1 733 670 0.2 -16.0 -11.3
ANGOL 8.25% 09-MAY-2028 Caa1/ 84.610 5.1 11.31 1,099 1,083 2 580 535 0.0 -15.8 -11.4
ANGOL 8% 26-NOV-2029 Caa1/CCC 81.663 5.8 11.25 1,087 1,069 13 570 -0.6 -18.0
ANGOL 9.375% 08-MAY-2048 Caa1/ 81.529 8.1 11.62 1,103 1,081 0 455 421 0.1 -19.0 -14.7
ANGOL 9.125% 26-NOV-2049 Caa1/CCC 80.610 8.3 11.43 1,083 1,061 -2 439 0.2 -18.4
REPCAM 9.5% 19-NOV-2025 /B 105.136 3.3 8.01 784 772 13 300 228 -0.3 -0.2 4.9
REPCON 3% 30-JUN-2029 /CCC 77.418 3.4 12.84 1,266 1,245 2 518 541 0.1 -5.4 -2.9
EGYPT 6.125% 31-JAN-2022 B2/B+ 103.247 1.3 3.64 351 332 -7 121 93 0.2 3.1 5.2
EGYPT 5.577% 21-FEB-2023 B2u/B+ 104.274 2.2 3.71 358 349 2 126 75 0.0 3.3 6.4
EGYPT 4.55% 20-NOV-2023 B2u/B+ 101.668 2.9 3.98 383 375 1 157 0.0 2.6
EGYPT 6.2004% 01-MAR-2024 B2u/B+ 105.843 3.1 4.35 419 411 -1 184 103 0.1 1.8 6.4
EGYPT 5.75% 29-MAY-2024 B2u/B+ 104.734 3.3 4.34 418 409 3 0.0
EGYPT 5.875% 11-JUN-2025 B2/B+ 104.889 4.0 4.70 448 440 -5 163 93 0.2 2.6 7.4
EGYPT 7.5% 31-JAN-2027 B2/B+ 108.410 5.0 5.89 558 548 6 185 126 -0.3 2.1 6.9
EGYPT 6.588% 21-FEB-2028 B2u/B+ 102.764 5.8 6.12 573 564 1 161 123 -0.1 3.3 6.9
EGYPT 7.6003% 01-MAR-2029 B2u/B+ 106.847 6.2 6.53 612 599 7 172 131 -0.4 2.7 6.7
EGYPT 7.0529% 15-JAN-2032 B2u/B+ 100.253 7.6 7.02 645 634 14 191 -1.0 0.4
EGYPT 7.625% 29-MAY-2032 B2u/B+ 102.497 7.5 7.30 674 661 14 -1.1
EGYPT 6.875% 30-APR-2040 B2/B+ 97.033 10.3 7.15 641 628 5 166 128 -0.6 0.8 5.1
EGYPT 8.5% 31-JAN-2047 B2/B+ 102.077 10.5 8.30 753 742 11 206 161 -1.2 -2.5 2.6
EGYPT 8.7002% 01-MAR-2049 B2u/B+ 102.104 10.6 8.50 773 762 17 212 171 -1.7 -3.1 1.6
EGYPT 8.875% 29-MAY-2050 B2u/B+ 103.026 10.4 8.59 784 771 15 -1.5
EGYPT 7.903% 21-FEB-2048 B2u/B+ 96.757 10.8 8.20 740 731 11 201 163 -1.2 -2.5 1.8
EGYPT 8.15% 20-NOV-2059 B2u/B+ 98.157 11.2 8.31 747 740 0 202 -0.1 -2.9
ETHOPI 6.625% 11-DEC-2024 B2/B 103.011 3.6 5.81 562 553 1 256 178 0.0 -0.4 4.5
GABON 6.375% 12-DEC-2024 /CCC 97.972 2.8 7.09 694 684 42 356 176 -1.1 -2.0 6.4
GABON 6.95% 16-JUN-2025 Caa1/CCC 98.735 3.9 7.27 706 696 31 308 158 -1.1 -2.0 6.9
GABON 6.625% 06-FEB-2031 Caa1/CCC 95.252 6.7 7.33 688 674 16 -1.0
GHANA 7.875% 07-AUG-2023 B3/B 107.993 2.6 4.86 473 463 1 154 136 0.0 3.3 5.6
GHANA 8.125% 18-JAN-2026 B3/B 102.807 3.5 7.35 716 705 15 257 214 -0.4 0.8 4.6
GHANA 6.375% 11-FEB-2027 B3/B 93.921 4.4 7.78 753 743 25 -1.0
GHANA 7.875% 26-MAR-2027 B3u/B 99.289 4.3 7.76 752 740 17 264 214 -0.7 -0.2 4.3
GHANA 7.625% 16-MAY-2029 B3/B 95.133 5.5 8.50 815 801 21 267 237 -1.1 -1.3 2.3
GHANA 10.75% 14-OCT-2030 B1/BB- 123.515 5.9 7.17 678 661 -5 185 160 0.3 2.4 5.4
GHANA 8.125% 26-MAR-2032 B3u/B 93.219 6.6 9.00 855 837 22 269 246 -1.3 -2.7 0.6
GHANA 7.875% 11-FEB-2035 B3/B 89.914 7.8 9.20 862 847 16 -1.2
GHANA 8.627% 16-JUN-2049 B3/B 89.337 9.4 9.74 907 889 15 245 231 -1.3 -4.3 -1.9
GHANA 8.95% 26-MAR-2051 B3u/B 91.744 9.2 9.81 915 896 17 243 212 -1.5 -3.8 0.3
GHANA 8.75% 11-MAR-2061 B3/B 89.379 10.0 9.81 909 895 15 -1.4
IVYCST 5.375% 23-JUL-2024 Ba3/B+ 101.802 3.4 4.85 467 459 2 226 164 0.0 0.4 4.2
IVYCST 2.5% 31-DEC-2032 /B+ 97.234 5.2 6.28 596 574 0 203 176 0.0 1.3 4.2
IVYCST 6.375% 03-MAR-2028 Ba3/B+ 103.821 5.2 5.66 532 523 -2 171 118 0.1 2.6 7.1
IVYCST 6.125% 15-JUN-2033 Ba3/B+ 99.629 8.1 6.17 558 546 1 149 92 -0.1 3.0 8.8
KENINT 6.875% 24-JUN-2024 /NR 105.117 3.2 5.35 519 509 -9 210 156 0.4 1.5 5.2
KENINT 7% 22-MAY-2027 B2u/B+ 102.670 4.5 6.43 617 605 -8 214 179 0.4 1.2 4.6
KENINT 7.25% 28-FEB-2028 B2u/B+ 103.171 5.7 6.70 633 622 -3 228 153 0.2 -0.4 5.7
KENINT 8% 22-MAY-2032 B2u/B+ 103.929 7.0 7.46 694 681 4 201 148 -0.2 0.5 5.8
KENINT 8.25% 28-FEB-2048 B2u/B+ 102.081 10.9 8.06 726 717 2 169 119 -0.4 0.8 6.7
MOROC 4.25% 11-DEC-2022 /BBB- 105.535 2.1 1.70 157 148 -7 93 80 0.2 2.8 4.1
MOROC 5.5% 11-DEC-2042 /BBB- 128.304 13.8 3.63 260 268 1 86 52 -0.4 7.6 10.4
MOZAM 5% 15-SEP-2031 Caa2u/ 85.428 6.6 9.74 929 917 -5 312 0.4 -4.9
REPNAM 5.5% 03-NOV-2021 Ba2/BB 101.651 1.1 3.97 384 361 -20 224 187 0.3 1.5 3.5
REPNAM 5.25% 29-OCT-2025 Ba2/BB 101.045 4.3 5.01 478 468 3 210 153 -0.1 0.5 4.6
NGERIA 5.625% 27-JUN-2022 B2/B 101.906 1.6 4.49 436 423 2 217 185 0.1 1.6 3.8
NGERIA 6.375% 12-JUL-2023 /B 103.987 2.5 4.84 470 461 10 206 156 -0.2 1.7 4.8
NGERIA 7.625% 21-NOV-2025 B2/B 107.604 4.2 5.89 566 556 6 185 178 -0.2 2.4 4.3
NGERIA 6.5% 28-NOV-2027 B2/B 99.965 5.6 6.50 615 604 7 181 168 -0.4 2.4 4.6
NGERIA 7.143% 23-FEB-2030 B2/B 100.590 6.7 7.06 660 646 12 161 165 -0.7 3.6 4.5
NGERIA 8.747% 21-JAN-2031 B2/B 107.524 6.8 7.68 719 705 9 173 190 -0.7 3.0 3.0
NGERIA 7.875% 16-FEB-2032 B2/B 100.514 7.4 7.81 725 713 9 177 194 -0.6 2.3 2.1
NGERIA 7.696% 23-FEB-2038 B2/B 95.438 9.3 8.19 753 738 12 185 196 -1.1 0.5 0.2
NGERIA 9.248% 21-JAN-2049 B2/B 104.734 10.2 8.79 805 792 11 190 183 -1.1 -0.3 1.1
NGERIA 7.625% 28-NOV-2047 B2/B 93.425 10.7 8.23 745 734 7 168 170 -0.8 1.3 1.3
RWANDA 6.625% 02-MAY-2023 /B+ 103.959 2.3 4.99 486 476 -10 222 254 0.3 1.4 1.8
SENEGL 6.25% 30-JUL-2024 Ba3/ 105.692 3.4 4.62 444 436 7 248 192 -0.2 -0.6 2.8
SENEGL 6.25% 23-MAY-2033 Ba3/ 103.984 8.0 5.77 518 507 5 145 86 -0.5 3.1 9.0
SENEGL 6.75% 13-MAR-2048 Ba3/ 100.796 12.3 6.68 576 576 5 117 71 -0.7 4.9 10.5
SOAF 5.875% 30-MAY-2022 Ba1/BB 106.127 1.6 2.15 202 188 -16 84 64 0.3 3.0 4.6
SOAF 4.665% 17-JAN-2024 Ba1/BB 103.502 3.0 3.54 338 329 7 160 177 -0.2 2.2 2.6
SOAF 5.875% 16-SEP-2025 Ba1/BB 108.377 4.3 4.00 376 368 -5 163 154 0.2 2.1 3.5
SOAF 4.875% 14-APR-2026 Ba1/BB 103.276 4.8 4.21 392 385 -4 157 144 0.2 2.5 4.1
SOAF 4.85% 27-SEP-2027 Ba1/BB 101.630 5.8 4.57 419 411 -5 172 157 0.3 1.5 3.1
SOAF 4.3% 12-OCT-2028 Ba1/BB 96.565 6.6 4.82 437 428 -4 170 156 0.2 1.4 3.0
SOAF 4.85% 30-SEP-2029 Ba1/BB 98.994 7.1 4.99 447 439 -4 154 0.2 2.2
SOAF 5.875% 22-JUN-2030 Ba1/BB 105.812 7.3 5.11 456 449 -1 162 155 0.1 1.5 2.6
SOAF 6.25% 08-MAR-2041 Ba1/BB 100.723 11.5 6.18 533 529 -1 179 190 0.0 -2.3 -4.1
SOAF 5.375% 24-JUL-2044 Ba1/BB 89.628 12.6 6.21 527 528 -3 170 194 0.1 -2.0 -5.7
SOAF 6.3% 22-JUN-2048 Ba1/BB 97.378 12.6 6.50 556 557 1 189 202 -0.3 -3.9 -6.4
SOAF 5.65% 27-SEP-2047 Ba1/BB 90.442 12.7 6.40 545 546 -3 181 197 0.2 -3.0 -5.9
SOAF 5% 12-OCT-2046 Ba1/BB 85.148 13.1 6.15 517 520 -1 182 196 -0.1 -3.5 -6.3
SOAF 5.75% 30-SEP-2049 Ba1/BB 90.475 12.9 6.48 551 553 -5 179 0.4 -3.0
Continue on the next page
14Standard Bank African Markets Revealed
September 2020
African Eurobonds (continued)
Name Moody's/Fitch Mid Price Mod Dur Yield, % Over UST Z-Spread 1 wk YTD 12mths 1 wk YTD 12mths
BTUN 5.75% 30-JAN-2025 B2 *-/B 92.907 3.7 7.69 749 741 15 191 100 -0.5 3.7 10.1
BTUN 8.25% 19-SEP-2027 B2 *-/WD 97.360 5.2 8.77 844 832 -3 201 148 0.1 3.1 8.4
ZAMBIN 5.375% 20-SEP-2022 /CC 57.251 1.6 37.76 3,764 3,755 -135 1810 1959 2.8 -10.3 -8.4
ZAMBIN 8.5% 14-APR-2024 /CC 56.461 2.4 28.84 2,871 2,859 -58 1099 1189 2.0 -9.0 -5.5
ZAMBIN 8.97% 30-JUL-2027 /CC 56.967 3.7 22.67 2,248 2,231 -51 720 771 2.3 -7.1 -5.0
SB Africa Eurobond (incl. SA) B+ 6.5 7.53 710 687 5 230 209 -0.2 -1.0 2.0
SB Africa Eurobond (excl. SA) B+ 6.2 7.94 752 729 6 241 213 -0.3 -1.4 2.4
Figure 12: African sovereign USD bonds (spread over US Treasuries versus modified duration)
2500
2000
1500
Congo '29
Bps
1000
Mozam '31
RepCam '25
500 Ethop ' 24
Rwanda '23
0
0 2 4 6 8 10 12 14
Modified duration
Angola Cote d'Ivoire Gabon Ghana Egypt Kenya Morocco
Namibia Nigeria Senegal South Africa Tunisia Zambia
Source: Bloomberg; Standar Bank Research
15Standard Bank African Markets Revealed
September 2020
Figure 13: African and broader EM bonds (spread over US Treasuries versus credit rating)
Zambia '27
2000
1500
RepCon '29
Bps
Angola '29
1000
Mozam '31
RepCam '25
Tunisia '25
Gabon '31
Kenya '32
Egypt '29 Ghana '30
CI '33 Nigeria '30
Ethop '24
500 Senegal '33
Namibia Rwanda '23
S. Africa'25
'29
Morocco '42
72
0
A+ A A- BBB+ BBB BBB- BB+ BB BB- B+ B B- CCC CC C RD
Fitch credit rating
Source: Bloomberg; Standard Bank Research
Figure 14: Spread over UST: SB African Eurobond index vs EMBI Global
1 250
1 150
1 050
950
850
Bps
750
650
550
450
350
250
Sep-19 Oct-19 Nov-19 Dec-19 Jan-20 Feb-20 Mar-20 Apr-20 May-20 Jun-20 Jul-20 Aug-20 Sep-20
SB Africa Sovereign Index EMBI Global Index
Source: Bloomberg; Standard Bank Research
16Standard Bank African Markets Revealed
September 2020
Figure 15: UST spread: African sovereign Eurobonds vs other regions
1200
1100
1000
900
800
700
Bps
600
500
400
300
200
100
Sep-19 Nov-19 Dec-19 Feb-20 Apr-20 May-20 Jul-20 Sep-20
SBAFSOSP LatAm CEE Asia ME
Source: Bloomberg; Standard Bank Research
Figure 16: Africa oil credits vs EM oil credits
1550
1350
1150
950
750
550
350
Sep-19 Nov-19 Dec-19 Feb-20 Apr-20 May-20 Jul-20 Sep-20
SBAFSOSP Africa: oil Africa: non oil EM (ex Africa): oil
Source: Bloomberg; Standard Bank Research
Recommended trades: performance
Open trades
Positions Entry date Entry yield, % Entry FX Latest yield, % Latest FX Total return, %
Since inception 1-month
Zambia: buy ZAMGB '26 18-Nov-16 24.50 9.81 32.47 19.93 -3.0 -2.6
Egypt: buy Egypt '27 23-Nov-17 15.88 17.69 14.44 15.76 72.7 1.6
Egypt: sell USD/EGP 12-m 28-May-20 14.92 15.87 10.09 15.75 8.1 1.3
NDF
Nigeria: sell USD/NGN 12- 22-Jun-20 18.06 387.80 17.71 385.75 4.6 4.8
m NDF
Ethiopia: buy USD/ETB 24- 06-Aug-20 12.10 35.42 14.83 36.70 6.3 3.4
m NDF
Kenya: buy KenGB '31 24-Aug-20 11.24 108.00 11.12 108.04 1.8 1.8
Angola: buy USD/AOA 12-m 09-Sep-20 26.15 620.75 24.30 622.17 -0.3
NDF
Source: Bloomberg; Standard Bank Research
17Standard Bank African Markets Revealed
September 2020
Namibia
Namibia: remaining stuck in recession
Medium-term outlook: recession protracted Composition of GDP by demand
15.0
We reduce our GDP growth forecast to a contraction of 6.3%
y/y for 2020, from a contraction of 2.4% y/y, and see growth 10.0
of 3.0% y/y in 2021, instead of 2.6% y/y. The 2020 GDP
5.0
contraction will likely deepen due to muted domestic demand
conditions on account of the pandemic. That said, the Ministry
%, y/y
0.0
of Finance seems less optimistic, forecasting a contraction of
6.6% y/y and 1.1% y/y for 2020 and 2021 respectively. -5.0
-10.0
Economic disruptions will have a far-reaching impact.
Unsurprisingly, the first seven months of this year have seen a -15.0
pronounced slump in sectors such as mining, agriculture, 2014 2015 2016 2017 2018 2019 2020f 2021f
construction, tourism, wholesale and retail trade as well as PCE GCE GFCF
transport and storage. The mining index declined by 26.4% y/y Inventories Netex GDP
in Jul, from an increase of 2.7% y/y in Jun and a decline of
9.8% y/y in Jan. Moreover, amid depressed global demand, Source: Source: Namibia Statistics Agency; Standard Bank Research
weak commodity prices in Q2:20 would have undermined main
exports such as copper, precious stones and metals. In Jun,
exports slid by 3.9% y/y. Contribution to GDP by sector (% of GDP)
The government had eased restrictions in Aug due to the 2013 2016 2019
comparatively low rate of reported infections (1,000 cases Mar- Agriculture 7.8 6.8 6.9
Jul). However, the surge in cases from late Jun to mid-Aug saw 10.7 7.9 9.5
Mining and quarrying
the government having to revert to stricter containment
12.6 12.6 13.1
measures in late Aug. Of course, these stricter lockdown Manufacturing
measures will not only deepen the economic contraction but Construction 3.5 3.3 2.3
also prolong it. Wholesale and retail trade 10.3 11.6 9.2
Financial intermediation 6.8 7.0 7.9
Our base case now sees significant declines in Q2:20 and 5.3 5.2 5.7
Real estate activities and business services
Q3:20, which could see the economy contract by 11.5% y/y
Public administration 10.9 11.4 12.2
and 8.9% y/y in Q2:20 and Q3:20 respectively, averaging a
negative 6.3% y/y for 2020. However, in mid-Sep, authorities Education 9.2 9.1 9.4
opted not to extend the state of emergency that had been in Source: Namibia Statistics Agency
place since Mar; which bodes well with the anticipated economic
recovery from Q4:20 onwards.
Even with some recovery in economic activity in 2021, GDP
growth is likely to stay around 3.0% y/y until 2023. Tourism indices
175
Even should restrictions be lifted sooner, our bull scenario still
forecasts a contraction of 5.3% y/y in 2020, then growth of
3.9% y/y next year, and thereafter reverting to the 5.0% y/y 150
pace of 2010-2015 by late-2022.
Index, 2015 = 100
125
To revive tourism, Namibia has re-opened the Hosea Kutako
International Airport for international travel at the start of Sep. 100
75
50
Jan-15 Sep-15 May-16 Jan-17 Sep-17 May-18 Jan-19 Sep-19 May-20
Room occupancy Arrivals
Source: Source: Namibia Statistics Agency
18Standard Bank African Markets Revealed
September 2020
Medium-term economic growth scenarios
Namibia
Rwanda
Q1:20 Q2:20 Q3:20 Q4:20 Q1:21 Q2:21 Q3:21 Q4:21 Q1:22 Q2:22 Q3:22 Q4:22 Q1:23 Q2:23 Q3:23 Q4:23
Base scenario
GDP (% y/y) pa -0.8 -11.5 -8.9 -3.9 -0.2 7.8 5.0 0.1 1.8 3.8 4.3 2.0 0.5 2.7 4.6 5.4
CPI (% y/y) pe 2.4 2.2 2.3 2.7 2.9 3.9 4.1 4.1 4.7 4.7 4.7 4.7 4.6 4.5 4.8 4.8
Policy interest rate (%) pe 5.25 4.00 3.75 3.75 3.75 3.75 4.25 4.50 5.50 5.75 6.00 6.00 6.00 6.00 6.00 6.25
3-m rate (%) pe 5.20 4.75 4.50 4.25 3.85 3.85 4.45 4.75 5.75 5.90 6.20 6.20 6.20 6.20 6.20 6.20
6-m rate (%) pe 5.60 4.85 4.75 4.45 4.00 4.00 4.65 4.90 5.90 6.00 6.35 6.40 6.40 6.40 6.40 6.40
USD/NAD pe 17.80 17.38 16.90 16.50 16.25 16.00 15.75 15.50 15.57 15.64 15.71 15.79 15.46 15.14 15.61 16.07
Bull scenario
GDP (% y/y) pa -0.8 -10.3 -7.7 -2.7 0.8 8.3 5.3 1.4 3.5 5.6 6.0 3.8 2.2 4.4 6.4 7.1
CPI (% y/y) pe 2.4 2.7 3.0 3.4 3.7 4.6 4.8 4.9 5.3 5.5 5.2 5.2 5.1 5.0 5.3 5.3
Policy interest rate (%) pe 5.25 4.00 4.00 4.00 4.00 4.25 4.50 5.00 5.50 5.75 6.00 6.00 6.00 6.00 6.00 6.50
3-m rate (%) pe 5.20 4.75 4.50 4.25 3.85 3.85 4.45 4.75 5.75 5.90 6.20 6.20 6.20 6.20 6.20 6.20
6-m rate (%) pe 5.60 4.85 4.75 4.45 4.00 4.00 4.65 4.90 5.90 6.00 6.35 6.40 6.40 6.40 6.40 6.40
USD/NAD pe 17.80 17.38 16.00 15.50 15.38 15.25 15.13 15.00 15.02 15.04 15.06 15.08 15.18 15.29 15.40 15.51
Bear scenario
GDP (% y/y) pa -0.8 -12.8 -10.8 -5.6 -1.4 6.1 3.8 -0.6 1.1 3.3 3.8 1.5 0.0 2.2 4.1 4.9
CPI (% y/y) pe 2.4 1.6 1.9 2.3 2.6 3.5 3.8 3.9 4.5 4.5 4.5 4.5 4.4 4.3 4.6 4.5
Policy interest rate (%) pe 5.25 4.00 4.25 4.25 4.50 4.75 5.25 5.25 6.00 6.25 6.50 6.50 6.50 6.50 6.50 6.50
3-m rate (%) pe 5.20 4.75 4.50 4.25 3.85 3.85 4.45 4.75 5.75 5.90 6.20 6.20 6.20 6.20 6.20 6.20
6-m rate (%) pe 5.60 4.85 4.75 4.45 4.00 4.00 4.65 4.90 5.90 6.00 6.35 6.40 6.40 6.40 6.40 6.40
USD/NAD pe 17.80 17.38 18.25 17.50 16.85 16.30 15.88 15.50 15.55 15.59 15.63 15.67 15.77 15.88 15.99 16.05
Source: Namibia Statistics Agency; Bank of Namibia; Ministry of Finance; Bloomberg; Standard Bank Research
Notes: pa - period average; pe - period end
Long-term growth performance Mining production
14.0 650.0
12.0
550.0
10.0
8.0 450.0
Index, 2015 = 100
%, y/y
6.0
350.0
4.0
2.0 250.0
0.0
150.0
-2.0
1982 1986 1990 1994 1998 2002 2006 2010 2014 2018
50.0
GDP growth Decade average Jan-13 Jul-14 Jan-16 Jul-17 Jan-19 Jul-20
Diamonds Uranium
Source: Namibia Statistics Agency
Source: Source: Namibia Statistics Agency
19Standard Bank African Markets Revealed
September 2020
Balance of payments: C/A deficit widening Current account developments
Namibia
2.4
The C/A deficit will likely widen to 4.6% of GDP this year and
5.3% in 2021, from 2.1% in 2019. 1.6
0.8
The trade deficit too could widen this year on already restrained
import demand, exacerbated by containment measures in South 0
USD bn
Africa. Exports have dropped sharply, with minerals displaying the -0.8
sharpest slide. Furthermore, the SACU revenue pool will likely
-1.6
contract significantly, though the reduction in flows to Namibia
will most likely only be meaningfully lower in 2021. Bear in mind -2.4
that the downward revisions for this year will be deducted next
-3.2
year.
-4
2012 2014 2016 2018 2020f
FX reserves increased to USD2.1bn in Jul, from an average of
USD1.8bn Apr-Jun. But, the reinstatement of the lockdown in late Trade Services Income Transfers C/A
Aug might undermine this recovery and thus we expect them to
Source: Bank of Namibia; Standard Bank Research
end 2020 at USD1.9bn, covering what we estimate as 5.4-m of
imports. In 2021, we expect FX reserves to reach USD2.1bn by
year-end, covering about 4.5-m of imports, which is still adequate
to secure the NAD’s 1-to-1 link to the ZAR.
FX reserves
Perhaps the risk here might be if the government cannot service
2.6
the Eurobond redemption falling due in 2021 from the Sinking
Fund and look to utilise FX reserves. But then again, the
2.3
government maintains two sinking funds in South African rand
and US dollars, with balances of ZAR1.3bn and USD360m 2.0
respectively to cover upcoming maturities on sovereign bonds.
Authorities indeed have a tendency of drawing on these funds for
USD bn
1.7
financing purposes. Recall that Namibia issued two 10-y
Eurobonds in 2011 and 2015. The government will likely opt for 1.4
a repayment of the Eurobond maturing next year, rather than
refinancing, which could sharply crimp FX reserves. 1.1
0.8
Jan-10 Feb-12 Mar-14 Apr-16 May-18 Jun-20
FX reserves
Source: Bank of Namibia
FX outlook: USD/NAD still headed lower USD/NAD: forwards versus forecasts
20.0
At its Aug meeting, the Bank of Namibia’s Monetary Policy
19.0
Committee emphasized its aim to retain the 1-to-1 link between
the NAD and ZAR. We do not see the bank abandoning that link 18.0
any time soon. Therefore, the NAD will keep tracking the rand’s 17.0
path. 16.0
USD/NAD
15.0
The rand is expected to reclaim some ground as global financial 14.0
market turmoil eases — but its ultimate path depends on SA 13.0
policy reforms to support higher growth and government debt
12.0
stabilisation. Our G10 strategist forecasts USD weakness in 2021,
11.0
which too should support the rand.
10.0
Aug-15 Nov-16 Feb-18 Apr-19 Jul-20 Oct-21
We see the USD/ZAR at 16.50 by year-end and15.50 by end-
History Forwards Forecast
2021. Investor expectations for growth and fiscal policy
interventions will likely drive the medium-term rand trajectory.
Source: Bloomberg; Standard Bank Research
The currency would however remain vulnerable should the fiscal
trajectory not be sustainable as the global economy rebounds.
20Standard Bank African Markets Revealed
September 2020
Monetary policy: to stand pat Inflation and interest rates
Namibia
15.0 7.5
Unless the South African Reserve Bank cuts SA policy rates again,
we’d expect Namibia to hold on rates this year, perhaps only 7.0
changing tack in H2:21. Indeed, the 25 bps cut in Aug might be 12.0
6.5
the end of the easing cycle.
6.0
9.0
Since Jan, the Namibia MPC has cut the repo rate by a cumulative 5.5
%, y/y
%
275 bps, taking it to 3.75%. From its Aug meeting statement 5.0
6.0
which covers the economic disruptions of the pandemic, the
4.5
committee said that the current rate is appropriate to support
domestic economic activity but also acknowledged the importance 4.0
3.0
of not undermining savings and investment decisions. 3.5
Furthermore, it reiterated its aim to retain the 1-to-1 link between 0.0 3.0
the ZAR and NAD. Jan-12 Jun-13 Nov-14 Apr-16 Sep-17 Feb-19 Jul-20
Headline Food BON Repo (rhs)
Headline inflation has been benign, averaging 2.1% y/y in the
first 7-m of this year, compared to an average of 4.3% y/y over Source: Bank of Namibia; Namibia Statistics Agency
the same period in 2019. At 1.6% y/y, the Apr 20 reading was
the lowest on record since mid-2005. We now see headline
inflation broadly remaining below 3.0% y/y this year due to soft
domestic demand. It is likely to average 2.7% y/y in 2020 and Money supply growth
3.7% y/y in 2021. However, this is still below the mid-point of
20.0
the 3% - 6% y/y target range.
The anticipated acceleration in headline inflation next year, 15.0
combined with some economic recovery in 2021, could sway the
MPC into hiking the policy rate, which might see the repo rate at 10.0
4.50% by end-2021.
%, y/y
5.0
Food inflation has been rising at an average of 0.6% m/m since
the beginning of this year. It is the only sub-index that has
averaged higher than 0.3% m/m. It rose to 1.0% m/m in Jul, 0.0
from 0.4% m/m in Jan. Meanwhile, transport inflation has stalled
since Apr and is now in deflation, matching fuel prices declines. -5.0
Jan-11 Mar-12 May-13 Jul-14 Sep-15 Nov-16 Jan-18 Mar-19 May-20
Despite the acute NAD weakness in recent months and some
marginal increases in oil prices, the passthrough seems limited so M2
far.
Source: Bank of Namibia
Yield curve outlook: suspended bull-steepening Yield curve changes
12.0
The 25 bps cut in policy rates at the BON’s Aug meeting might
have been the end of this easing cycle. However, the policy rate
trajectory will depend largely on the policy path of the SARB. But
10.0
there’s still a bias for yields to remain at current levels for the next
4-m. Headline inflation is broadly subdued, demand for credit by
YTM (%)
the private sector too has declined as growth of credit extended to 8.0
businesses eased due to the pandemic. Ample liquidity with
commercial banks could be deployed and drive bond yields lower.
Although while we see bond yields lower, T-bill yields may be 6.0
trading sideways, which could suspend the steepening of the yield
curve we had anticipated.
4.0
91-d 182-d 364-d 4-y 7-y 10-y 15-y 20-y
Though the borrowing strategy is to meet funding needs largely
from the domestic market, the 2020/21 budget deficit is 29-Aug-19 31-Jul-20 6-m forecast
significantly large to be sourced from the domestic market, as is
Source: Bank of Namibia; Standard Bank Research
usual. Hence, T-bill yields are unlikely to drop as much as the repo
rate.
21You can also read