AIR QUALITY IN MONTRÉAL - Environmental Assessment Report 2018 Service de l'environnement - Ville de Montréal

Page created by Elizabeth Buchanan
 
CONTINUE READING
AIR QUALITY IN MONTRÉAL - Environmental Assessment Report 2018 Service de l'environnement - Ville de Montréal
Environmental Assessment Report 2018

AIR QUALITY
IN MONTRÉAL
Service de l’environnement
AIR QUALITY IN MONTRÉAL - Environmental Assessment Report 2018 Service de l'environnement - Ville de Montréal
Air Quality Monitoring
                              The Network in Short                                                                                                QA/QC Program

The Réseau de surveillance de la qualité de l’air (RSQA) (the Network)                                                        The Service de l’environnement continues its long-term work to
consists of 15 monitoring stations equipped with analyzers for the                                                            renovate its monitoring stations and enhance their functionalities and
continuous monitoring of pollutant concentrations such as fine                                                                aesthetics, while conforming to applicable construction and safety codes.
particulate matter, ozone, sulphur dioxide, nitrogen oxides and carbon                                                        The Network is involved in an ongoing quality assurance and quality
monoxide. The results obtained allow us to draw an annual portrait and                                                        control (QA/QC) improvement process to comply with the guidelines
follow the evolution of the situation of these pollutants over the years in                                                   of Environment and Climate Change Canada’s National Air Pollution
Montréal. Moreover, real-time information on air quality in Montréal is                                                       Surveillance (NAPS) program, of which it belongs. The NAPS relies on
available on the Network’s Web site at rsqa.qc.ca.                                                                            some 300 stations throughout Canada.

   RSQA Monitoring Stations on
   the Island of Montréal in 2018
                                                                                                                                                                        Rivière-des-Prairies
                                                                                                                                                                   NOX O3 CO PM 2.5 PM 10
                                                                                                                                                                      VOC PAH BC          55
                                                                                                                                         Fire Station 17                                                                 Saint-Jean-Baptiste
                                                                                                                                         Montréal-Nord                                                                        RDP-PAT
                                                                                                                                        NOX O3 CO PM 2.5                                                                 NOX O3 SO 2 PM 2.5
                                                                                                                                           PM 10 TSP                      Anjou
                                                                                                                                                         17                                                             3 PM 10 TSP VOC
                                                                                                                                                                    PM 2.5 PM 10 TSP
                                                                                                                                                                                        6              Chénier, Anjou
                                                                                                                                                                                                7 NO SO PM VOC
                                                                                                                                                                                                    X  2  2.5

                                                                                                                                                Saint-Joseph
                   Sainte-Anne-de-Bellevue                                                                                                 Rosemont-La Petite-Patrie
                                                                                                        Décarie Interchange                  NOX O3 SO 2 PM 2.5
                    NOX O3 SO 2 PM 2.5
                         PM 10 TSP VOC                                                                      Mont-Royal                         PM 10 TSP VOC       80                  Hochelaga-Maisonneuve
                       99                                                Montréal Airport, Dorval       NOX O3 CO PM 2.5
                                                                                                                              28                                                               PM 2.5 PM 10 TSP
                                                                                                                                                                                      50
                                                                         NOX O3 CO PM 2.5 VOC 66

                                                                                                                                                                         St-Dominique, Ville-Marie
                                                                                                                                                                   31 NOX O3 CO SO 2 PM 2.5 VOC

                            BC      Black Carbon                                                              Notre-Dame, Le Sud-Ouest
                                                                                                                                                  101
      Pollutants measured

                            CO      Carbon Monoxide                                                        NOX PM 2.5 PM 10 TSP VOC PAH                    Richelieu, Le Sud-Ouest
                            NO X    Nitrogen Monoxide and Dioxide                                                                           102
                                                                                                                                                          PM 2.5 PM 10 TSP PAH
                            O3      Ozone                                                                                         104
                            PAH     Polycyclic aromatic hydrocarbon                                 Saint-Patrick, Le Sud-Ouest                   103
                                                                                                                                                        York/Roberval, Le Sud-Ouest
                            PM2.5   Particulate Matter (diameter < 2.5 microns)                       PM 2.5 PM 10 TSP PAH
                            PM10    Particulate Matter (diameter < 10 microns)                                                                            NOX O3 PM 2.5 PM 10                     RSQA monitoring station
                            SO2     Sulphur Dioxide                                                                                                           TSP PAH
                            TSP     Total Suspended Particulates                                                                                                                                  Turcot project monitoring station
                            VOC     Volatile Organic Compounds

                                                                                                                       2
AIR QUALITY IN MONTRÉAL - Environmental Assessment Report 2018 Service de l'environnement - Ville de Montréal
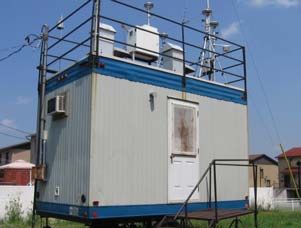
Facility Upgrading                                                                Turcot Project

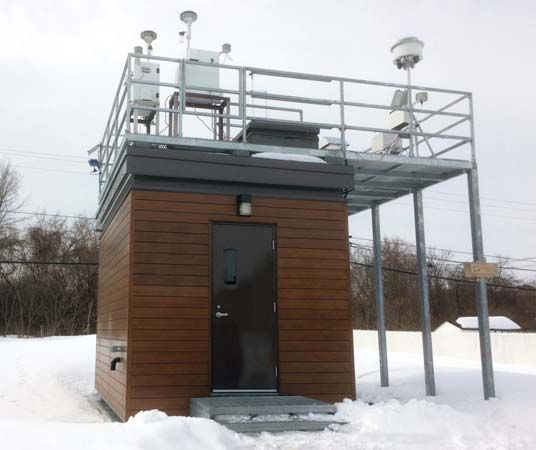
Station 55, located in Rivière-des-Prairies since 1998, has undergone a          Work on the rebuilding of the Turcot Interchange continued throughout
major rejuvenation at the end of 2018. The transition between the two            2018. Station 102 was yet again the one that recorded the most
buildings was completed in less than two weeks, which resulted in a              exceedances of the 30 μg/m3 standard set by the Ministère de
minimum loss of data and fewer days of downtime during which the                 l’Environnement et de la Lutte contre les changements climatiques
station was unfit for service. This station is the Network’s most complete       (MELCC) for average daily concentrations of fine particulate matter
in terms of equipment. Indeed, it is categorized as being Tier 1 according       (PM2.5). These exceedances of the standard are due to the traffic, the
to the NAPS program criteria, meaning that all of the parameters                 various road works carried out and the truck traffic nearby.
recommended by the program are monitored (reference method,
characterization and continuous monitoring for PM2.5, O3, NOx, CO, COV            Exceedances of the Standard for Fine Particulate Matter (PM2.5)
[polar and non-polar], PAH and PM10).
                                                                                        Stations               101               102           103          104

                                                                                        Total 2016              1                13              1            3

                                                                                        Total 2017              0                 4              0            1

                                                                                        Total 2018              2                 7              2            3

                                                                                 Highlights
                                                                                   •    Station 101: Near the new storage site for excavation and
                                                                                        backfilling materials
                                                                                   •    Station 102: Continuation of the demolition and construction
                                                                                        work at the heart of the new Interchange
                                                                                   •    Station 103: Dismantling of the exit ramp near the station
                                                                                   •    Station 104: Presence of work upstream of the Lachine Canal

                                                                                                   Air Quality Index (AQI) by Turcot Project
                 Station 55                                                                              Monitoring Station in 2018
        Rivière-des-Prairies
                                                                                                                                 283

                                                                                                                                                     206
                                                                                                        193
                                                                                  241

                                                                                                              139

                                                                                                                                                            137

             Continuing Education
                                                                                        102

                                                                                                                     29

                                                                                                                                                                  22
                                                                                                                                       71
                                                                                              15

                                                                                                                                             7

In June 2018, the Network’s team attended the 111th Annual                              101                   102                      103                  104
Conference of the Air & Waste Management Association (AWMA) in
                                                                                                               Monitoring Stations
Hartford, Connecticut. The event brought together the majority of global
actors in the field of air quality. The conference, among other benefits,               Number of AQI days                Good         Acceptable    Poor
allowed us to learn more about new analysis techniques, emerging
pollutants such as nanoparticles, the impact of atmospheric chemistry on
air quality as well as the use of satellite measures to obtain air quality       The data are available online at the Web site of the Ministère des
forecasts and an overview of their health effects. Team members are also         Transports, formerly known as the Ministère des Transports, de la
involved in the organization of the AWMA’s 112th Annual Conference to            Mobilité durable et de l’Électrification des transports (MTMDET), at
be held in Quebec City from June 25 to 28, 2019.                                 seti-media.com/infopopulation/rsqa_turcot.

                                                                             3
AIR QUALITY IN MONTRÉAL - Environmental Assessment Report 2018 Service de l'environnement - Ville de Montréal
@ Shutterstock
       Canadian Ambient Air Quality Standards (CAAQS)
The Canadian ambient air quality standards (CAAQS) deal with fine                The results of the past 5 years for SO2 show a constant improvement
particulate matter (PM2.5), ozone (O3), sulphur dioxide (SO2) and nitrogen       and are compliant with the 2020 standard. The variation is very slight
dioxide (NO2) since 2017. These standards are the core of the Air Quality        since last year.
Management System (AQMS) promoted by the Canadian Council of
Ministers of the Environment. These data are presented in micrograms             Sulphur Dioxide (SO2) Concentrations Expressed in ppb
per cubic metre (μg/m3) or parts per billion (ppb).
                                                                                            3-year average of the annual 99th percentile of the daily
Since 2012, an improvement in PM2.5 concentrations has been observed                               maximum 1-hour average concentrations
in Montréal’s ambient air. The situation is similar to last year and the                       Standard = 70 in 2020 Standard = 65 in 2025
results are below the standards to be attained by 2020.                           2012–2014       2013–2015       2014–2016       2015–2017         2016–2018
                                                                                       23              23              21             18                 17
Fine Particulate Matter (PM2.5) Concentrations Expressed in μg/m3
                                                                                             Arithmetic average over a single calendar year of all
                                                                                                       1-hour average concentrations
            3-year average of the annual 98 percentile of the daily
                                           th
                                                                                              Standard = 5.0 in 2020 Standard = 4.0 in 2025
                       24-hour average concentrations
               Standard = 28 in 2015 Standard = 27 in 2020                           2014            2015            2016            2017               2018

  2012–2014       2013–2015      2014–2016       2015–2017       2016–2018            1.1             0.9             0.7             0.8               0.6

      25               24             21             20               20

             3-year average of the annual average concentrations                 The 3-year averages for NO2 show little variation between 2012 and
               Standard = 10 in 2015 Standard = 8.8 in 2020                      2018. The concentrations recorded in 2016–2018, i.e. 45 ppb, are far
  2012–2014       2013–2015      2014–2016       2015–2017       2016–2018       below the 2020 standard, but just above the standard for 2025 (42 ppb).
                                                                                 The use of fossil fuels in motor vehicles and home heating systems is
      9.6             9.4            8.6            7.5*              7.4
                                                                                 the main source of NO2 emissions. As regards the yearly average, it lies
* 2015–2017, corrected value                                                     below the 2020 and 2025 standards despite a slight increase in 2018.

                                                                                 Nitrogen Dioxide (NO2) Concentrations Expressed in ppb
The trend for O3 is rather stable with 3-year averages varying between
55 and 58 ppb from 2012 to 2018. The concentrations recorded are                              3-year average of the annual 98th percentile of the
always below the 2020 standard.                                                                 daily maximum 1-hour average concentrations
                                                                                               Standard = 60 in 2020 Standard = 42 in 2025
                                                                                  2012–2014       2013–2015       2014–2016       2015–2017        2016–2018
Ozone (O3) Concentrations Expressed in ppb                                             44              46              45             45                45

                3-year average of the annual 4th highest daily                                 Arithmetic average over a single calendar year of
                  maximum 8-hour average concentrations                                               all 1-hour average concentrations
               Standard = 63 in 2015 Standard = 62 in 2020                                     Standard = 17 in 2020 Standard = 12 in 2025
 2012–2014        2013–2015      2014–2016      2015–2017        2016–2018           2014            2015            2016            2017               2018
      55              55              56             58               57              9.5             8.4             10.0           10.3               10.4

                                                                             4
AIR QUALITY IN MONTRÉAL - Environmental Assessment Report 2018 Service de l'environnement - Ville de Montréal
Portrait of Air Quality
                  Air Quality Index (AQI) by Station                                                            Wood Burning By-law

Did you know that human activities were responsible for poor air quality                     The By-law concerning solid fuel-burning devices and fireplaces
days in Montréal? For instance, fireworks were responsible for the poor                      (15–069), adopted August 24, 2015, is two-pronged.
air quality recorded during the evenings of July 11–12, 14–15 and 21,
2018. The concentrations of fine particles increased during the fireworks                    The first prohibits the use of any solid fuel-burning appliance on
and then only decreased after midnight, which explains the 2-day count.                      the territory of Montréal during a smog warning, and this, since the
All of these occurrences have in common the stagnation of pollutants                         adoption of the By-law in 2015.
due to low or no circulation of air masses.
                                                                                             The second, effective since October 1, 2018, prohibits the use of
Other than for smog days, the events responsible for poor air quality                        any solid fuel-burning device or fireplace, unless it is recognized by
days in Montréal in 2018 are:                                                                an organization identified in schedule B of the By-law, as part of a
                                                                                             certification process (CSA/B415.1-10 or EPA), establishing that it has an
  •    industries in the east end of Montréal (station 3);                                   emission rate no greater than 2.5 g/h of particles into the atmosphere.
  •    the fleet work yards of Montréal-Nord (station 17);
                                                                                             Nevertheless, the By-law authorizes the exceptional use of any solid
  •    highway traffic (stations 28 and 103);
                                                                                             fuel-burning device (compliant or not) during electricity outages of
  •    the activities of the Port de Montréal and traffic on                                 more than three hours.
       Notre-Dame Est Blvd. (station 50);
                                                                                             For more information on By-law 15–069, please consult the Web site at
  •    wood burning in the winter (station 55);
                                                                                             www.ville.montreal.qc.ca/woodburning.
  •    the Loto-Québec fireworks (stations 7, 50 and 80);
  •    other human activities with a local scope (all stations).

   Air Quality Index (AQI)
   by Monitoring Station in 2018                                                                                                                        166
                                                                                                                                                              6

                                                                                                                                                              55

                                                                                                                12
                                                                                                                                                                  180         East    7

                                                                                                                                                                                178
                                                                                                          173                                                      9
                                                                                                                                                                                      3
                                                                                                                   17
                                                                                                                                                              79                          177
                                                                                                                        180                                        7

                                                                                                                                    5                                   275

            3                                                                                           North
                                                                                                                              167
                                                                                            18                                      80             17
      211                                                                  7
            99                                   West                                 162                                               193   93
                 151                                                 173
                                                                                             28                                                    50
                                                                           66                                                       4
                                                                                184               185                                                   248
                                                                                                                              150
                                                                                                 Downtown                           31

                                                                                                               7                        211
                    Distribution of AQI Days
                                                                                                         168
                  Good           Acceptable              Poor                                               103

            Only those stations that continuously measure fine                                                     190
            particulate matter (PM 2.5 ) are shown.

                                                                                      5
AIR QUALITY IN MONTRÉAL - Environmental Assessment Report 2018 Service de l'environnement - Ville de Montréal
Poor Air Quality Days                                                                          Poor Air Quality Days in Montréal in 2018

                                                                                           12

                                                                                           10       3
In 2018, 41 poor air quality days were recorded, of which 6 smog days,
on the territory of Montréal. Fine particulate matter is responsible for
                                                                                           8                  2
all poor air quality days distributed over 9 months during the year.
April, August and October were exempt from any poor air quality days.                      6
                                                                                                                                                                                     1
As far as smog days are concerned, they occurred in January, February                               9
                                                                                           4
and December. Despite a slight increase in the number of poor air                                             7
                                                                                                                                                5                                    5
quality days compared to 2017 (34), it’s important to understand that                      2
                                                                                                                                                                             3
                                                                                                                  2                         2
their number fluctuates from one year to another depending on                                                                      1                            1
                                                                                           0
weather conditions (wind speed and direction, length of winter with its                             J         F   M        A       M        J    J         A    S        O   N       D
varying temperatures).                                                                                                                      Month
                                                                                                                      Smog                                Other causes
An analysis of the results obtained since 2013 shows that the number
of smog days is decreasing. Over the past few years, the majority of
smog occurrences observed in Montréal were recorded in the wintertime                                     Poor Air Quality Days in Montréal Since 2013
and were caused by a heavy concentration of fine particulate matter.
                                                                                           70
In Québec, the key drivers for smog days are residential wood burning,
industrial activities and transportation. During a smog occurrence, the                    60
fine particulate matter remains at ground level when there is no wind and                  50
when there is a change in temperatures. A mild spell may result in some
                                                                                           40
smog, which was the case for some of the episodes observed in 2018,                                                   53               57
                                                                                           30            38
when temperatures exceeded the freezing point during a few hours.
                                                                                           20                                                                       27        35
                                                                                                                                                     21
                                                                                           10            15           10               7             8              7
                                                                                            0                                                                                    6
                                                                                                        2013       2014             2015        2016            2017         2018
                                                                                                                      Smog                                Other causes

                                                                                                Poor air quality or smog?
                                                                                                A day is deemed poor in terms of air quality as soon as fine
                                                                                                particulate matter concentrations (PM2.5) exceed 35 μg/m3 for at
                                                                                                least 3 hours in a given station. A day is characterized as a smog
                                                                                                day when concentrations of PM2.5 exceed 35 μg/m3 during at least
                                                                                                3 hours over more than 75% of the agglomeration’s territory. During
                                                                                                a smog day, concentrations of PM2.5 generally remain high for
                                                                          @ Shutterstock

                                                                                                24 hours and sometimes longer.

PRODUCTION                                                 PHOTOGRAPHY                                                         2nd quarter 2019
Ville de Montréal                                          Ville de Montréal unless otherwise indicated                        ISSN 1925-685x (print)
Service de l’environnement                                                                                                     ISSN 1925-6868 (PDF)
Division de la planification et du suivi environnemental   COVER                                                               Legal deposit – Bibliothèque et Archives nationales
Réseau de surveillance de la qualité de l’air (RSQA)       IStock                                                              du Québec, 2019

INFORMATION                                                GRAPHIC DESIGN
environnement@ville.montreal.qc.ca                         Service de l’environnement

                                                            ville.montreal.qc.ca/RSQA
AIR QUALITY IN MONTRÉAL - Environmental Assessment Report 2018 Service de l'environnement - Ville de Montréal AIR QUALITY IN MONTRÉAL - Environmental Assessment Report 2018 Service de l'environnement - Ville de Montréal
You can also read