AIR QUALITY MANAGEMENT FOR DECISION MAKERS IN INDIAN CITIES - TRAINING MANUAL TRAIN4CLEANAIR (T4CA)
←
→
Page content transcription
If your browser does not render page correctly, please read the page content below
Train4CleanAir (T4CA)

Air Quality Management for
Decision Makers in Indian Cities
Training Manual
As a federally owned enterprise, GIZ supports the
German Government in achieving its objectives in the field
of international cooperation for sustainable development.

Published by:
Deutsche Gesellschaft für
Internationale Zusammenarbeit (GIZ) GmbH

Registered offices:
Bonn and Eschborn

Support to India‘s National Clean Air Programme
Deutsche Gesellschaft für
Internationale Zusammenarbeit (GIZ) GmbH
Ground Floor, B-5/1, Safdarjung Enclave
New Delhi-110029, India
T +91 11 4949 5353
F +91 11 4949 5391
I www.giz.de/india                                                    Train4CleanAir (T4CA)
Author:

                                                               Air Quality Management for
Dr. Gary Haq, SEI Affiliated Researcher, SEI York Centre
Prarthana Borah, India Director, Clean Air Asia

Reviewed by:
GIZ India
Clean Air Asia India                                         Decision Makers in Indian Cities
With support from Bloomberg Philanthropies

Design:
www.padmasiddhi.com

Photo Credits:                                                         Training Manual
stockphoto

GIZ is responsible for the content of this publication.

New Delhi, August 2021
INTRODUCTION
National Clean Air Programme (NCAP), launched in 2019, is India’s flagship program for better air quality. NCAP
designated 122 cities as non-attainment from 21 states and 2 union territories (Chandigarh and Delhi) based on the
ambient monitoring data from the network operated by Central Pollution Control Board (CPCB). As of August 2021,
the number of non-attainment cities has increased to 132. NCAP in its first round of activities aims to increase
the capacity of the Pollution Control Boards both CPCB and SPCBs to measure, evaluate and manage air pollution.
This includes improving capacity in preparation of an information baseline for emissions and assessment of source
contributions, communication strategies to maintain and disseminate information, clean technology assessments and
review, management development on inspection monitoring, awareness generation and designing strategies for air
pollution mitigation.

Train for Clean Air (T4CA) is a regional training approach that aims to assist cities to create and implement Clean
Air Plans (CAPs) and make informed policies and decisions. It includes standardized modular training courses
customized for different stakeholders – decision-makers, technical staff, researchers, NGOs, and the media. Deutsche
Gesellschaft für Internationale Zusammenarbeit (GIZ) in partnership with Clean Air Asia in 2008 developed T4CA
modules for an international audience. Clean Air Asia has used these modules to conduct several trainings to build
the capacity of officials and strengthening implementation and monitoring of clean air action plans of different cities
of Asia.

Support to the National Clean Air Programme, the Deutsche Gesellschaft für Internationale Zusammenarbeit (GIZ)
GmbH under the Indo-German Development Cooperation and Bloomberg Philanthropies supported Clean Air Asia
to develop five training manuals based on the T4CA manuals. Since the implementation of CAPs lies with the city,
officials involved in the mitigation of air pollution in need of capacity development could benefit through these
manuals.

This manual titled Air Quality Management (AQM) for Decision Makers in Indian Cities is designed for a specific
group of decision and policymakers whose functions encompass establishing the legal and regulatory framework for
AQM, clean air action planning, championing air quality improvement and mitigation of climate change impacts and
gaining support from national government agencies and development organizations for AQM.

The training manual shall support the decision-makers and strengthen their knowledge on air quality management
and be able to make decisions on city development and help better air quality in India.

                                                                                                                          |1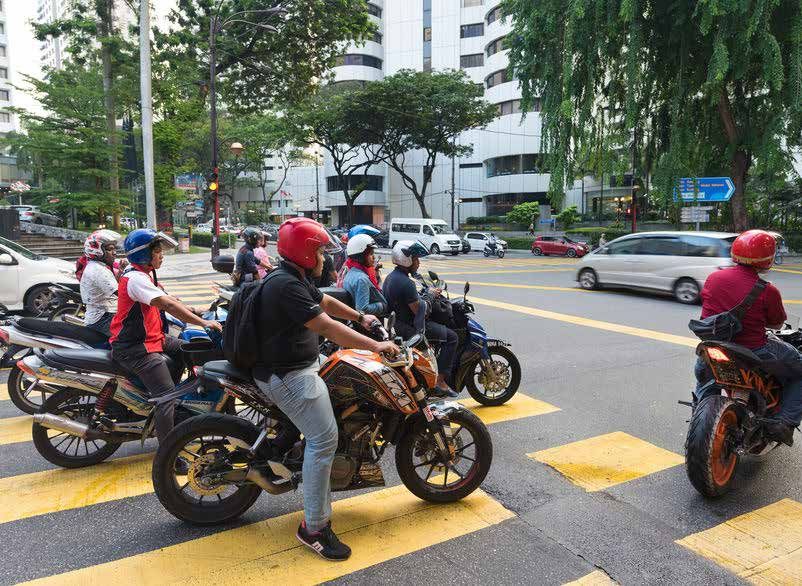
4.1.4 Sulphur dioxide                                               38

           Table of Contents
                                                              4.1.5 Hazardous air pollutants                                      39
                                                        4.2   Air Pollution Impacts On Ecosystems                                 40
                                                        4.3   Economic Impacts Of Air Pollution                                   40
                                                        4.4   Health Impact Assessment                                            41
     Table of Abbreviations                        4
     List of Tables, Figures and Boxes             5    5     Air Quality Management                                              44
                                                        5.1   Air Quality In Indian Cities                                        47
     1.     Urban Air Pollution                    7    5.2   Ambient Air Quality Guidelines And Standards                        48
     1.1    Introduction                           7          5.2.1 WHO air quality guidelines                                    48
     1.2    Government Initiatives                 8          5.2.2 Ambient air quality standards                                 49
     1.3    National Clean Air Action Programme    10   5.3   Air Pollution Legislation In India                                  50
     1.4    City Development And Air Pollution     12   5.4   National Ambient Air Quality Standards                              50
                                                              5.4.1 Industry standards                                            51
     2      Air Pollution: The Silent Killer       13         5.4.2 National air quality index                                    52
     2.1    From The Local To Global Scale         15         5.4.3 Role and responsibilities of decision maker                   53
            2.1.1 Household                        15   5.5   Emissions                                                           54
            2.1.2 Urban                            16   5.6   Air Quality Monitoring                                              55
            2.2.3 Peri-urban                       17   5.7   Air Pollution Control Measures                                      58
            2.2.4 Regional and transboundary       17         5.7.1 City-specific air quality management plan                     59
                                                              5.7.2 Assessment of ten clean air action plans                      60
     3      Types Of Air Pollution                 22         5.7.3 Construction and demolition                                   63
     3.1    Types Of Air Pollutants                22         5.7.4 Transport                                                     64
     3.2    Criteria Air Pollutants                23         5.7.5 Open waste burning                                            69
            3.2.1 Particulate matter               23         5.7.6 Households                                                    70
            3.2.2 Sulphur dioxide                  23         5.7.7 Industry                                                      72
            3.2.3 Nitrogen oxides                  24   5.8   Air Pollution Control Measures In Air Quality Management            73
            3.2.4 Ozone                            24         5.8.1. Effectiveness of Indian air pollution control measures       73
            3.2.5 Carbon monoxide                  25         5.8.2 CNG in Delhi                                                  75
            3.2.6 Lead                             26         5.8.3 Surat emission trading scheme                                 75
            3.2.7 Ammonia                          26         5.8.4 A Smart Personal Air Quality Monitoring System in Chennai     75
            3.2.8 Other pollutants                 26         5.8.5 Air quality monitoring during the 2015 Hong Kong marathon     76
     3.3    Factors Affecting Air Quality          27         5.8.6 A simple interactive model for better air quality             77
            3.3.1 How did it get there?            27         5.8.7 Use of AERMOD and ADMS-URBAN for PM monitoring in New Delhi   78
            3.3.2 How much pollutants are there?   27         5.8.8 USEPA environmental benefits mapping and analysis program     78
            3.3.3 Topography                       27         5.8.9 Hong Kong’s air pollution index                               80
            3.3.4 Stack height                     28         5.8.10 Handbook for clean air management in smaller cities          80
     3.4    Emission Sources                       28
            3.4.1 Stationary sources               28   6     Urban Air Pollution And Climate Change                              82
            3.4.2 Area sources                     29   6.1   Short-Lived Climate Pollutants                                      82
            3.4.3 Mobile sources                   30         6.1.1 Black carbon                                                  82
            3.4.4 Natural sources                  30         6.1.2 Ground-level ozone                                            84
                                                              6.1.3 Methane                                                       84
     4      Air Pollution Impacts                  31         6.1.4 Hydrofluorocarbons                                            85
     4.1    Human Health Impacts                   32   6.2   What Are Co-Benefits?                                               85
            4.1.1 Particulate matter               35   6.3   Opportunities For Co-Benefits In India                              86
            4.1.2 Ground-level ozone               38
            4.1.3 Nitrogen dioxide                 38   7     Annex I                                                             87

2|                                                                                                                                     |3
Table of Abbreviations                                            List of Tables, Figures and Boxes
     ASEAN    Association of Southeast Asian Nations                  Table 1:  General classification of gaseous air           Figure 17: Clean Air Scorecard Tool 		                46
     AQI      Air Quality Index                                                 pollutants 				22                               Figure 18: Air quality index 			                      52
     AQG      Air Quality Guideline
                                                                      Table 2: Classification of Inorganic Organic              Figure 19: Actions in clean air action plans to
     AQM      Air Quality Management
     CH4      Methane                                                           Pollutants (adapted from WHO) 		          27               reduce transport, stationary, and
     CO2      Carbon Dioxide                                          Table 3: Impacts of air pollution 			               32               waste emissions			                         63
     COPD     Chronic Obstructive Pulmonary Disease                   Table 4: Health impacts of air pollutants 		        33    Figure 20: Source of contamination from solid waste
     CPCB     Central Pollution Control Board
                                                                      Table 5: Mortality count due to air pollution       36               mismanagement 			                          69
     EU       European Union
     GBD      Global Burden of Disease                                Table 6: WHO air quality guidelines		               48    Figure 21: Distribution of population exposure to
     GDP      Gross Domestic Product                                  Table 7: Different air quality standards 		         51               PM2.5 in 2015 and projected emissions
     GHG      Greenhouse Gases                                        Table 8: Common objectives for air quality                           for 2030 and 2050 			                      73
     GRAP     Graded Response Action Plan
                                                                                monitoring 				55                               Figure 22: Contribution from outside sources to
     H2S      Hydrogen Sulphide
     H2SO4    Sulphuric Acid                                          Table 9: International Guidelines for air quality 		                 ambient PM2.5 concentrations 		            74
     HC       Hydrocarbon                                                       monitoring 				56                               Figure 23: (A) Gas sensors calibration set up
     HF       Hydrogen Fluoride                                       Table 10: UNEP’s 25 Clean Air Measures 		           60               and (B) SPAMS 				                         76
     HFC      Hydrofluorocarbons
                                                                      Table 11: Overview of policy measures to control 		       Figure 24: Sensor Field Performance Test 		           77
     HIA      Health Impact Assessment
     LRI      Lower Respiratory Infections                                      transport emissions 			                   67    Figure 25: Screenshot of the BenMAP – CE software     78
     Km       Kilometre                                                                                                         Figure 26: EPA BenMAP website 			                     79
     MNO3     Manganese Oxide                                                                                                   Figure 27: BenMAP Process Diagram 		                  79
     MoEFCC   Ministry of Environment, Forest and Climate Change
                                                                      Figure 1: Overview of the National Clean Air              Figure 28: Short-lived climate pollutants and
     NO       Nitrogen Oxide
     NAAQ     National Ambient Air Quality Standards                             Programme 				10                                          their lifetime in the atmosphere 		        83
     NAAQM    National Ambient Air Quality Monitoring                 Figure 2: Air pollution from emissions to exposure 14
     NAMP     National Air Quality Management Program                 Figure 3: Air pollution from the local to the
     N2O      Nitrous Oxide
                                                                                 global level 				                         15   Box 1:    National Air Quality Monitoring
     NCAP     National Clean Air Programme
     NCR      National Capital Region                                 Figure 4: The pH scale			                            19             Programme 				10
     NMVOC    Non-Methane Volatile Organic Compounds                  Figure 5: Acid deposition process 			                19   Box 2:    National Action Plan on Climate Change 10
     NH3      Ammonia                                                 Figure 6: The Greenhouse Effect 			                  20   Box 3:    Climate Smart Cities Assessment
     NOX      Nitrogen Oxides
                                                                      Figure 7: Temperature changes around the world                      Framework 				                         11
     O3       Ozone
     OCEMS    Online Continuous Emission/Effluent Monitoring System              (1901-2018) 				21                             Box 4:    Air Pollution and the Sustainable
     OECD     Organisation for Economic Cooperation and Development   Figure 8: Size comparison particulate matter                        Development Goals 			                  12
     PAH      Polycyclic Aromatic Hydrocarbons                                   particles 				23                               Box 5:    Air pollution death in Indian Cities   37
     PAN      Peroxyacetyl Nitrate
                                                                      Figure 9: Formation of tropospheric ozone 		         25   Box 6:    Factors considered in setting air
     Pb       Lead
     PCB      Poly Chlorinated Biphenyls                              Figure 10: Sources of pollutant air emissions        28             quality standards 			                  49
     PFC      Per Fluoro Carbons                                      Figure 11: Air pollution and health 			              32   Box 7:    Air quality enforcement procedure in
     PM       Particulate Matter                                      Figure 12: Attributable deaths to PM2.5 pollution in                the European Union 			                 53
     S        Sulphur
                                                                                   India (2015) by source 			              35   Box 8:    Air Quality Enforcement Procedure in
     SPCB     State Pollution Control Board
     SF6      Sulphur Hexafluoride                                    Figure 13:   Direct and indirect market costs of                    the USA 				                           54
     SO2      Sulphur Dioxide                                                      outdoor air pollution 			               40   Box 9:    City-specific Air Quality Management
     SO3      Sulphur Trioxide                                        Figure 14:   Costs and benefits of the US                           Plans for 122 Non-attainment cities
     USD      United States Dollar
                                                                                   Clean Air Act 				                      41             under NCAP 				                        58
     USEPA    United States Environmental Protection Agency
     VOC      Volatile Organic Compounds                              Figure 15:   The health impact assessment procedure       Box 10:   Transport Control in Singapore 		      65
     WHO      World Health Organization                                            in air quality management 		            42   Box 11:   Smart Cities Programme			              66
                                                                      Figure 16:   Key component of air quality management 45   Box 12:   Black carbon Emissions in India 		     84

4|                                                                                                                                                                                         |5
Air Quality Management for
      Decision Makers in Indian Cities                                                                                         1. Urban Air Pollution
                                                                Target Audience

                                                                This manual is aimed at decision and policymakers
                                                                whose functions encompass establishing the legal
                                                                and regulatory framework for air quality management
                                                                (AQM), clean air action planning, championing
                                                                air quality improvement and mitigation of climate
                                                                change impacts and gaining support from national
                                                                government agencies and development organizations
                                                                for AQM.

                                                                Contents of Manual

                                                                In the manual, Air Quality Management for Decision
                                                                Makers in Indian Cities, participants will examine the
                                                                causes of air pollution, the different types of air
                                                                pollution which exist as well as the basic stages in air
                                                                quality management system. The manual contents
                                                                include:                                                   1.1 Introduction                                                                Indian cities have high annual mean concentrations
                                                                • Causes of air pollution                                                                                                                  of PM2.5 which exceeded the 40µg/m3 limit set by the
                                                                • Range of air pollutants and their impact on human        From smog in cities to smoke in the home, air                                   National Air Quality Standards (NAAQS). In 2015,
                                                                  health and environment                                   pollution poses a threat to human health and the                                an estimated 670 million people in India were exposed
                                                                • Steps of air quality management                          environment. Around 91% of the world’s population                               to PM2.5 concentrations that did not comply with the
                                                                • Air pollution control measures                           now live in areas with unhealthy outdoor air, causing                           NAAQS.4
                                                                • Co-benefits of addressing urban air quality and          4.2 million premature deaths each year.1 In India,
                                                                  climate change                                           air pollution is responsible for an estimated 1.2                               It is often the poor and socially marginalised who
                                                                                                                           million premature deaths each year and is costing                               tend to suffer disproportionately from the effects
                                                                                                                           the economy an estimated 3% of Gross Domestic                                   of deteriorating air quality because they live and
                                                                Objectives of the Manual                                   Product (GDP).2                                                                 work near sources of pollution. Polluted air kills an
     Learning Objectives                                                                                                                                                                                   estimated 600,000 children (under the age of five)
                                                                The manual can be used to support training around          Urban air pollution affects the health, wellbeing and                           every year.5
     Goal                                                       Air Quality Management for Decision Makers in Indian       life chances of hundreds of millions of men, women
                                                                Cities. With the help of this manual participants can:     and children every day. In particular, exposure to                              The health impacts of air pollution are well
     This manual enables participants involved in decision      • Assess the importance of actions and measures            fine particulate matter (PM2.5) pollution has been                              documented; however, new evidence suggests a link
     making roles to develop basic understanding of                aimed at reducing air pollution in cities               identified as the largest risk to human health. This                            between air pollution and dementia6 and Alzheimer’s
     air pollution and the key components required to           • Link city development with air quality management        is due to their small size (less than 2.5 micrometres                           disease, and changes in behaviour.7 In London,
     develop a programme to manage urban air pollution             (AQM) and pollution control                             (μm)),which enables PM2.5 particles to penetrate deep                           researchers found a link to air pollution levels and
     and to achieve better air quality. By working through      • Review the organizational structures needed in the       into the lungs where they can cause serious negative                            increases in petty crime such as shoplifting and pick-
     this manual participants will gradually achieve a higher      city government for a better integrated AQM             health impacts.                                                                 pocketing.
     level of understanding of urban air pollution and the      • Develop future policies to support AQM in cities
                                                                                                                           1   WHO (2020) https://www.who.int/health-topics/air-pollution#tab=tab_2
     measures to be taken to monitor air quality and to                                                                    2   State of Global Air (2019) India, Health Effects Institute, USA
     prevent and control urban air pollution in India.                                                                     3   Lim, S.S., Vos, T., Flaxman, A.D., Danaei, G., Shibuya, K., Adair-Rohani, H., AlMazroa, M.A., Amann, M., Anderson, H.R., Andrews, K.G., Aryee,
                                                                                                                               M., Atkinson, et al (2012) A comparative risk assessment of burden of disease and injury attributable to 67 risk factors and risk factor clusters in
                                                                                                                               21 regions, 1990–2010: a systematic analysis for the Global Burden of Disease Study 2010. The Lancet 380, 2224–2260.
                                                                                                                           4   IIASA/CEEW (2019) Pathways to achieve national ambient air quality standards in India. International Institute for Applied Systems Analysis/
                                                                                                                               Council on Energy, Environment and Water, New Delhi, India.
                                                                                                                           5   UNICEF (2016) Clear air for children. United Nations Children’s Fund, New York, USA.
                                                                                                                           6   Killin, L. O. J. et al. (2016) Environmental risk factors for dementia: a systematic review. BMC Geriatrics, 16:175.
                                                                                                                           7   Pascencia-Villa, G. et al. (2016) High-resolution analytical imaging and electron holography of magnetite particles in amyloid cores of Alzheimer
                                                                                                                               disease. Science Report, 6:24873.

6|                                                                                                                                                                                                                                                                                       |7
Exposure to poor quality air can increase the                               1.2 Government Initiatives                                                    28 July 1998 directed that all public transport
                                                                                                                                                               vehicles comprising of taxis, three wheelers, and
     stress hormone cortisol, which can influence risk
     perception. Higher levels of risk taking is one reason                      Due to the rapid growth of the industrial sector                              buses in Delhi were to run only on Compressed
     why there is a rise in criminal activity on polluted                        and increased vehicle transport, many developing                              Natural Gas (CNG) after April 2001.
     days.8                                                                      countries face the threat of air pollution and                           •    Vehicles are a major contributor to air pollution in
                                                                                 experience its health and economic impacts. In India,                         India. To keep vehicle pollution levels in check, the
     The state of air quality in cities is closely connected                     outdoor air pollution is responsible for millions                             government introduced the Bharat Stage Emission
     to the earth’s global climate and ecosystems. Many of                       of premature deaths with high economic cost.                                  Standards (BSES). BSES are emission standards
     the causes of air pollution (i.e. combustion of fossil                      To address air pollution and climate change, the                              instituted by the Government of India to regulate
     fuels) are also sources of greenhouse gas (GHG)                             government has taken several actions.                                         the output of air pollutants from internal
     emissions. Air pollution can affect the regional                                                                                                          combustion engines and spark-ignition engines.
     climate, Black carbon is among the pollutants that                          • In 1981, the Government of India enacted the Air                            The standards and the timeline for implementation
     deposits on snow and ice, darkening surfaces. This                            (Prevention and Control of Pollution) Act to 		                             are set by the CPCB under MoEFCC. The
     causes greater absorption of sunlight and faster                              prevent and control air pollution in India.                                 standards, which are based on European
     melting, threatening future water availability and                          • In 1984-85, the CPCB initiated the National                                 regulations, were first introduced in 2000.
     ecosystem productivity.9 Black carbon, a PM created                           Ambient Air Quality Monitoring (NAAQM)                                      Progressively stringent norms have been rolled
     through the burning of fossil fuels (such as diesel)                          Network to assess the present and anticipated                               out since then. In October 2010, Bharat stage III
     and biomass, not only affects human health but is                             air pollution impacts through air quality survey                            norms have been enforced across the country. In
     also responsible for glacial melting of Himalayan and                         monitoring programmes. Over the years, the                                  thirteen major cities, Bharat Stage IV emissions
     Tibetan Plateau.10                                                           number of stations has increased, and the                                   have been in place and are enforced for the whole
                                                                                   programme was renamed the NAMP.                                             country from April 2017. In 2016, The Indian
     Policies that reduce air pollution can be beneficial for                    • The 1986 Environment (Protection) Act further                               Government announced that the country would
     the global climate and human health; lowering the                             emphasized the need to reduce air pollutant 		                              skip the BS-V norms and adopt BS-VI norms by
     burden of disease attributable to air pollution while                         emissions.                                                                  April 2020.
     contributing to the near- and long-term mitigation of                       • Under section 18(1)(b) of Air (Prevention and                          •    In 2015, Ministry of Environment Forest and
     climate change.                                                               Control of Pollution) Act, 1986 CPCB directed                               Climate Change, Government of India (MoEFCC,
                                                                                   the implementation of forty-two (42) measures to                            GoI) submitted its Intended Nationally Determined
     This manual addresses the causes of air pollution and                         mitigate air pollution in major cities including Delhi                      Contributions (INDCs) on climate change with the
     the different types of air pollution such as outdoor,                         and NCR comprising of action plan to counter air                            objectives of a cleaner and climate friendly
     indoor, and transboundary. It examines the issue of                           pollution include control and mitigation measures                           economic development, reduction in emission
     urban air pollution in India and outlines the key stages                      related to vehicular emissions, resuspension of road                        intensity, promotion of non-fossil fuel based
     in an air quality management (AQM) system. An                                 dust and other fugitive emissions, biomass/                                 energy resources, development of additional
     effort has been made to address India specific issues                         municipal solid waste burning, industrial pollution,                        carbon sink of 2.5 to 3 billion tons of CO2
     and contextualise material based on standards and                             construction and demolition activities.11                                   equivalent through additional forest and tree cover
     norms adopted by the Government of India.                                   • In 1988, the motor vehicle act was enacted with                             by 2030, among other measures.
                                                                                   road safety standards and pollution control 		                         •    In 2016, the Government of India published
                                                                                   measures, among others.                                                     Construction and Demolition Waste Management
                                                                                 • On 19 January 1998, the Ministry of Environment                             Rules (C&D rule) to tackle the issues of pollution
                                                                                   and Forests (MoEF) established the Environmental                            and waste management.
                                                                                   Pollution (Prevention and Control) Authority                           •    In 2018, MoEFCC issued a Dust Mitigation
                                                                                   (EPCA) for the National Capital Region (NCR)                                notification making mandatory dust mitigation
                                                                                   of Delhi. The EPCA was given the authority to                               measures in infrastructure projects and demolition
                                                                                   control and tackle environmental pollution. This                            activities in the country.
                                                                                   included taking the necessary steps to control                         •    In 2019, the National Green Tribunal (NGT)
                                                                                   vehicle pollution in the NCR. Based on                                      directed state pollution control boards to install air
                                                                                   various public interest litigation (PIL) and on the                         quality monitoring stations and to report to the
                                                                                   recommendation of EPCA, the Supreme Court on                                CPCB on the installation of the stations by 1st
                                                                                                                                                               April 2020.12

     8    Bondy, M., Roth, S. and Sager, L. (2018) Crime is in the air: the contemporaneous relationship between air pollution and crime.
          LSE Working Paper, London School of Economics, London.
     9    Lacombe, G., Chinnasamy, P., and Nicol, A. (2019) Climate risk
          and solutions: adaptation frameworks for water resource planning, development and management in South Asia. International Water
          Management Institute, Colombo, Sri Lanka.
     10   Li, C. et al. (2016) Sources of black carbon to the Himalayan–Tibetan Plateau glaciers. Nature Communications, 7: 12574.
     11   Ministry of Environment, Forest and Climate Change (2019). National Clean Air Programme. ttp://moef.gov.in/wp-content/uploads/2019/05/NCAP_		   12    Times of India. 2019. Air pollution: Get ‘assessed’ monitoring stations in a year, says NGT. https://timesofindia.indiatimes.com/city/delhi/air-pollution-
          Report.pdf                                                                                                                                            get-assessed-monitoring-stations-in-a-year-says-ngt/articleshow/72152635.cms

8|                                                                                                                                                                                                                                                                                                                           |9
1.3 National Clean Air Action Tenure Target National Mission for a Green India, National Mission for Sustainable Agriculture, and National Mission
Programme Mid-term five (5) years
action plan to begin with
National level target of
20-30% reduction of
on Strategic Knowledge for Climate Change15. In 2016, India ratified the UN Paris Agreement to combat
keeping 2019 as base year. PM2.5 and PM10 climate change. The Paris Agreement requires all Parties to put forward their best efforts through
Further extendable concentration by 2024.
On the 10 January 2019, the Indian Ministry to 20-25 years in “nationally determined contributions” (NDCs). NDCs embody efforts by each country to reduce national
long-term after
of Environment, Forest and Climate Change mid-term emissions and adapt to the impacts of climate change. The Paris Agreement (Article 4, paragraph 2)
review of
(MoEFCC) launched a five-year national clean air outcomes. requires each Party to prepare, communicate and maintain successive NDCs that it intends to achieve.16
action programme (NCAP) to tackle the problem
of pollution (see Figure 1).The overall objective
of the NCAP is to take comprehensive mitigation
Objectives Box 3: Climate Smart Cities Assessment Framework
actions to prevent, control and abate air pollution Stringent Multi-sectoral
& Collaborative.
while supporting the national air quality monitoring implementation
of mitigation Mainstreaming
programme (see Box 1) and strengthening awareness measures for
prevention, control
and integration
into the exixting
policies and
and capacity. and abatement of air
pollution. programmes of GoI
Augment and strenghthen air including NAPCC.
quality monitoring network Use Smart Cities framework to
across the country. launch NCAP in the 43 smart
Augment public awareness and cities falling in the list of 102
capacity building measures. non-attainment cities.
Figure 1: Overview of the National Clean Air Programme13
Box 1. National Air Quality Monitoring Programme
The National Air Monitoring Programme (NAMP) consists of 703 manual operating stations covering
307 cities/towns in 29 Indian states and six Union Territories. NAMP activities include determining
the status and trends of ambient air quality; ascertaining whether the prescribed ambient air quality
standards are violated; and identifying non-attainment cities. Under NAMP, four air pollutants have
been identified for regular monitoring at all locations. These are sulphur dioxide (SO2), nitrogen dioxide
(NO2), suspended particulate matter (PM10), and fine particulate matter (PM2.5). In addition, there are 134
real-time Continuous Ambient Air Quality Monitoring stations (CAAQMS) in 71 cities across 17 states,
monitoring eight pollutants (PM10, PM2.5, SO2, nitrogen oxides(NOx),ammonia (NH3), carbon monoxide
(CO), ozone (O3), and benzene).
NCAP initially identified 102 non-attainment cities NCAP’s approach includes collaborative, multi-scale
that were not meeting the annual average ambient and cross-sectoral coordination between the relevant
air quality standards for PM10. These cities have central ministries, state governments and local bodies.
been identified based on ambient air quality data This includes coordination with existing policies
obtained (2011-2015) under National Air Quality and programmes, such as the National Action Plan
Monitoring Programme (NAMP), a further 20 cities on Climate Change (NAPCC) (see Box 2) and the
were added in August 2019, increasing the total Climate Smart Cities Assessment Framework (see
number of non-attainment cities in India to 122.14 Box 3). Under NCAP, the 122 non-attainment cities
(See Table 1) NCAP has set a tentative national level have to develop city specific action to implement
target of 20-30% reduction of PM (PM2.5 and PM10) mitigation actions.
concentrations by 2024 using 2017 as the base year.
In 2019, the Ministry of Housing and Urban Affairs launched the Climate Smart Cities Assessment
Framework for 100 identified Smart Cities under Smart City Mission.17 Out of 100 Smart Cities, 54
Box 2. National Action Plan on Climate Change smart cities are also identified as non-attainment cities (see Table 2). This assessment framework is
aimed at helping smart cities to take actions to tackle climate change and be more responsive and less
Launched in 2008, NAPCC included eight core “national missions” which represents a multi-pronged, vulnerable to climate change. The Framework has 30 indicators across five sectors: (i) energy and green
long-term and integrated approach for achieving key goals in the context of climate change. These buildings; (ii) urban planning and biodiversity and green cover; (iii) mobility and air; (vi) water resource
include: National Solar Mission, National Mission for Enhanced Energy Efficiency, National Mission on management; and (v) waste management. It addresses both mitigation and adaptation.
Sustainable Habitat, National Water Mission, National Mission for Sustaining the Himalayan Ecosystem,
15 Government of India (2008) National Action Plan on Climate Change. New Delhi, India.
13 Government of India (2019) National Action Clean Air Programme. New Delhi, India. 16 UNFCCC (n.d.) What is the Paris Agreement? United Nations Framework Convention on Climate Change, Berlin, Germany.
14 The Times of India (2019) 20 more cities added to CPCB’s ‘polluted list’. 18 August 2019. 17 See: https://smartnet.niua.org/csc/assessment-overview.html
10 | | 11
Health and wellbeing of people and the planet are                 As a country develops further, environmental controls                    This decline in community risk leads to the richest
       1.4 City Development And Air                                                   at the heart of the SDGs. However, the deaths and                 are tightened and community-level risks (urban air                       countries contributing to global risks such as climate
       		 Pollution                                                                   disabilities caused by air pollution and its close links          pollution) tend to decline. In wealthy cities, strict                    change due to the higher per capita GHG emissions.20
                                                                                      to climate change means it is a threat to delivering on           regulation and the implementation of abatement
       India is a vast country with an emerging economy.                              the SDG vision of a better world.18                               technology reduce polluting emissions to ensure they                     In recent years, medium and small towns and cities
       With its burgeoning population and widespread                                                                                                    meet health guidelines.                                                  in India have witnessed a rise in air pollution. The
       poverty, India faces enormous challenges in meeting                            The environmental risk to human health changes                                                                                             NCAP sets out an approach to better air quality in
       commitments associated with poverty reduction,                                 as a city develops, moving from the household to                  Policies and investments supporting cleaner transport,                   India’s cities, by reducing PM concentrations in 122
       and eradication of hunger under the UN Sustainable                             community and global scale. Air pollution becomes                 energy-efficient housing, power generation, industry                     non-attainment cities with the implementation of
       Development Goals (SDGs) (see Box 4).                                          a public health concern, GHG emissions increase                   and better municipal waste management can                                clean air action plans.
                                                                                      while the severity of the household water quality and             effectively reduce key sources of urban air pollution.
       The 17 SDGs aim to end extreme poverty and                                     sanitation problems decline.19
       create a healthy, sustainable world by the year 2030.

            Box 4. Air Pollution and the Sustainable Development Goals

            SDG 3, 7,11 and 13 and relevant targets are closely linked to air pollution. The targets include reduction
                                                                                                                                                             2. Air Pollution:
            in pollution, reducing related deaths and disabilities, change in fuels for reducing air pollution and other
            actions to combat climate change.                                                                                                                   The Silent Killer
                                          Good health and well-being are a basic building block for people to achieve their
                                          potential in school, at work and at home. Every step taken to reduce air pollution
                                          is a step towards achieving this goal.

            Access to clean and affordable energy is key to getting people out of poverty and
            enabling sustainable economic development. Three billion people cook and heat
            their homes with dirty fuels. This results in air pollution that kills almost four
            million people each year, mainly women and children. Clean and renewable energy
            can save lives and boost economic development.

                                          Sustainable cities and communities are crucial in an urbanised world. In 2016,
                                          more than half of urban dwellers were exposed to outdoor air pollution levels at
                                          least 2.5 times above World Health Organization safe levels. Policies that make
                                          cities smart, resilient and green-through urban planning, technology and citizen
                                          participation-can provide better air quality and transform the urban landscape.                               Air pollution is the contamination of the air we                         of these air pollutants exceed the capacity of natural
                                                                                                                                                        breathe with harmful substances, such as gases, dust,                    processes to convert or disperse them, they can cause
                                                                                                                                                        fumes and odour. The use of fossil fuels (coal, oil                      damage to human health and the environment (see
                                                                                                                                                        and gas), changes in land use and industrial activities                  Figure 2).21
            Many of the air pollutants that affect human health also contribute to heating the                                                          all produce polluting air emissions. When emissions
            atmosphere. Actions to improve air quality-such as switching to cleaner energy,
            cooking and transport solutions-will also address the climate emergency.

       18   UNEP (2019) Air Pollution and the Sustainable Development Goals. United Nations Environment Programme, Nairobi, Kenya.
       19   McGranahan, G. Jacobi, P. Songsore, J. Surjadi, C., Kjellen, M. (2001) The Citizens at Risk: From Urban Sanitation to Sustainable Cities,   20   Schwela, D. et al. (2008) Urban Air Pollution in Asian Cities, Earthscan, London.
            Earthscan, London.                                                                                                                          21   EEA (2003) EEA Signals 2003. European Environment Agency, Copenhagen, Denmark.

12 |                                                                                                                                                                                                                                                                                      | 13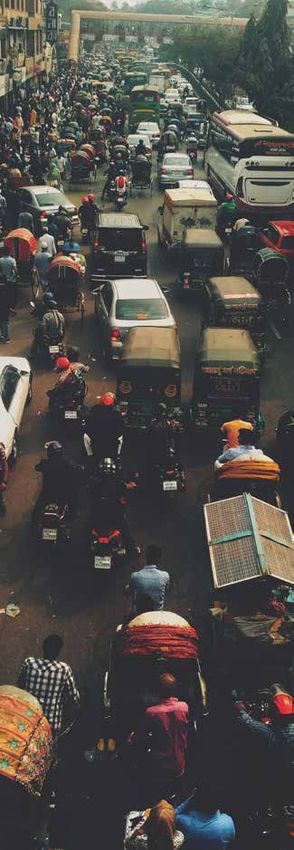
at the household, urban, peri-urban, regional and
2.1 From The Local To Global global scale (see Figure 3). Where and how long
Scale gases remain in the atmosphere determines the type
of pollution they cause. Moderately long-lived gases
Apart from the physical state of pollutants (such contribute to urban and regional air pollution, such
as gaseous or particulate matter) it is important to as smog over a city or acid rain impact over a region.
consider the geographical location and distribution Long-lived pollutants such as GHG contribute to
of the emission sources. Air pollution can occur global heating and represent global scale air pollution.
Waste Burning Forest Fires Greenhouse Gases
(Acidification)
Traffic
Open Cooking
Figure 2: Air pollution from emissions to exposure22
Air pollution occurs both indoors and outdoors. location and soil composition. The Indo-Gangetic
Indoor air pollution is caused mainly by the plain is essentially landlocked with the Himalayas HOUSEHOLD URBAN PRE-URBAN REGIONAL GLOBAL
household burning of solid fuels such as wood, dung, preventing polluted air from escaping to the north,
agricultural residues, coal, and charcoal for cooking and dry alluvial soil further contributing to wind- Figure 3: Air pollution from the local to the global level
and heating. Outdoor air pollution, also called blown dust.
ambient air pollution, is due to polluting emissions 2.1.1 Household and paints, or from contaminated soil.
from human activities such as use of motor vehicles, Evidence suggests that poor air quality is threatening Indoor air pollutants can be grouped into four 3. Biological agents include mildew, moulds, fungi,
and natural sources such as dust storms. the health and wellbeing of Indian citizens.24 Air categories: or bacteria. Furthermore, biological allergens
pollution is now the second largest risk factor such as dust mites may cause an allergic reaction
India has some of the worst urban air pollution levels contributing to disease in India after malnutrition. 1. Combustion contaminants comprise a large in vulnerable people.
in the world.23 Main sources of air pollution include group of gaseous and particulate pollutants that 4. Other contaminants are specific groups of
road transport, construction, biomass burning, diesel In 2015, India recorded 268,000 deaths caused by may be emitted from all types of combustion. chemicals such as pesticides or asbestos.
generators, commercial and domestic fuel use. biomass fuel burning with 169,000 deaths caused by The composition and magnitude of the
coal combustion from both thermal electric power combustion contaminants emissions depend On a global scale, indoor air pollution is responsible
Data from NAMP has shown that PM concentrations plants and industry. Anthropogenic PM2.5 contributed on the combustion efficiency. Smoke from for the premature death of 3.8 million people due to
exceeded NAAS across the country. Other pollutants to 100,000 deaths while agricultural burning combustion processes may contain thousands exposure to household air pollution from inefficient
such as sulphur oxides (SOx), nitrogen oxides (NOx) contributed to 66,000 deaths; and transport, diesel, of substances, many of which damage human cooking practices using polluting stoves together with
and ozone (O3) mostly meet national standards. and kilns contributed to over 65,000 deaths.25 health. solid fuels and kerosene.26 Around 3 billion people
2. Volatile organic compounds (VOC) may be worldwide cook using polluting open fires or simple
Urban areas in the Indo-Gangetic plain are at a emitted to indoor air from many sources. These stoves fuelled by kerosene, biomass (wood, animal
particular disadvantage due to their geographical include building materials, household products dung and crop waste) and coal.
22 EEA (2003) ibid.
23 India State-Level Disease Burden Initiative Air Pollution Collaborators (2019) Lancet Planet Health,3: e26–39 http://dx.doi.org/10.1016/ S2542-
5196(18)30261-4
24 India State Level Disease Burden Initiative Collaborators. Nations within a nation: variations in epidemiological transition across the states of India,
1990–2016 in the Global Burden of Disease Study. Lancet 2017; 390: 2437–60.
25 HEI (2018) Air pollution from many sources creates significant health burden in India. Health Effects Institute, USA. 26 WHO (2018) Household air pollution and health, World Health Organization, Geneva.
14 | | 15Smoke from biomass fuels and coal contains a range Smog 2.1.3 Peri-urban
of health-damaging pollutants including PM2.5 that Smog is a combination of smoke and fog and has a It is often assumed that ambient air quality in rural
penetrate deep into the lungs. In poorly ventilated high content of air pollutants. Smoke is an aerosol areas is better than that in towns and cities. While
dwellings, indoor smoke can be a hundred times originating from combustion. Its noxious mixture this may be true for some primary gaseous air
higher than acceptable levels for small particles, which of air pollutants that can be seen as a haze in the pollutants emitted directly from urban sources, it
are set for outdoor air. Exposure is particularly high air. It often stays for an extended period of time is not necessarily true for PM2.5. For ground level
among women and children in rural areas, who spend over densely populated cities or urban areas, such O3 (a secondary air pollutant that is formed in the
more time indoors. as London, New York, Los Angeles, Mexico City, atmosphere through photochemical reactions) the
Houston, Toronto, Athens, Beijing and Hong Kong. levels are often lower in urban areas than in suburban
Although household air pollution is common it is areas and the surrounding countryside.
also preventable. Replacement of solid cooking fuels Normally, the ambient temperature decreases with
with clean fuels such as liquid petroleum gas (LPG) altitude. During a temperature inversion, air close to The burning of agricultural crop residue to clear
gas was exemplified by the Pradhan Mantri Ujjwala the earth is cooler than the air above it. This prevents fields is a major contributor to air pollution. When
Yojana, which intended to provide 80 million ‘below the air near the ground to rise because it is heavier rice farmers in north-western India burn their fields,
poverty level’ households with LPG by 2019. As than the air above it. The pollutants present in the PM2.5 concentrations in the highly populated city of
per the state-wise PMUY connections record, by air cannot be dispersed and remain trapped near the New Delhi spike to about 20 times beyond the World
September 2019 the total registered connections ground. Cities surrounded by mountains may also Health Organization’s (WHO) air quality guidelines.
were 80,339,993. This Indian programme is likely to experience the trapping of air pollutants within the Living in areas where crop burning is common is
have been the most effective intervention to reduce valley. Night-time temperature inversions are typical, associated with a three-fold higher risk of acute
emissions of household air pollutants.27 when the air cools down in the absence of sunlight respiratory infection with children being particularly
but at a rate slower than the cooling of the ground. susceptible to the health effects of crop burning.30
2.1.2 Urban Temperature inversion can occur in any season.
Over the last five decades, there has been 2.1.4 Regional and transboundary
unprecedented growth in Indian cities. The urban Winter inversions are likely to cause particulate The transboundary movement of air pollution
population of India has grown nearly fivefold from and carbon monoxide (CO) pollution. In London, across borders may cause adverse effects in countries
60 million in 1947 to around 400 million people today. smog was frequently observed during winter due to other than the country of origin. Regional and
There are currently three Indian megacities with a additional emissions from domestic space heating and transboundary air pollution has been a topic of
population of more than 10 million people (Mumbai, the special urban meteorological conditions during scientific research for several decades but with
New Delhi, and Kolkata).28 this time of the year. It is also known as winter smog. advanced monitoring and modelling technology there
Summer inversions are more likely to create smog. is more evidence that pollution emitted in one part of
As Indian cities are increasing in size and population, Smog can make breathing more difficult (even for the world can create adverse effects in other parts.
there is a steady demand for motorised vehicles, healthy people) and it can make people susceptible to
which places pressure on the city’s infrastructure and cardio-respiratory diseases. Even healthy young adults Pollutants with a potential for regional and
environment, including poor urban air quality. breathe less efficiently on days when the air is heavily intercontinental transport include: PM, acidifying
polluted, especially if exercising outdoors. substances such as SO2, CO, O3 and its precursors
Urban air pollution not only has immediate localised such as VOC and NOX; heavy metals (mercury); and
impacts on human health and wellbeing but also On the 7 November 2017, the Indian Medical persistent organic pollutants.
contributes to regional and global air pollution. Association declared a public health emergency in and
For example, regional acidification is increasingly around New Delhi. The air quality index (AQI) uses a
experienced in East Asia and Southeast Asia. The use scale of 0–500, with higher values (>100) associated
of fossil fuels in the industrial and transport sectors, with increasing public health hazards. The peak AQI
not only contribute to climate change but also the for New Delhi was 486/500 on 9 November 2017
haze in South Asia known as the ‘Atmospheric Brown which falls within the severe category. This would
Cloud’, which is a mass of ash, acids, aerosols and have had an adverse respiratory impact on the whole
other particulates. population.29
27 Jindal, S. K, Aggarwal, A. N., Jindal, A. (2020) directions. Current Opinion in Pulmonary Medicine, 16:2, p128-134.
28 Shrivastava, M.,Ghosh, A., Bhattacharyya, R., and Singh, S.D. (2019) Urban Pollution in India. Urban Pollution: Science and Management, 30 Chakrabarti, A, Khan, M. T., Kishore, A, Roy, D and Scott, S. P. (2019) Risk of acute respiratory infection from crop burning in India: estimating
First Edition. Edited by Susanne M. Charlesworth and Colin A. Booth. John Wiley & Sons Ltd. disease burden and economic welfare from satellite and national health survey data for 250 000 persons. International Journal of Epidemiology,
29 Mishra, M (2019) Poison in the air: Declining air quality in India. Lung India. Mar-Apr; 36(2): 160–161. 2019, 1113–1124.
16 | | 17rainwater more acidic. Acid rain refers to all types of in the atmosphere for several days, during which they
precipitation that has a pH below 5.6 (see Figure 4). can travel over large distances, beyond 500-1000 km.
Major human-made precursors of acid rain are SO2 In the atmosphere they are transformed into acidic
and NOX. These are emitted primarily from fossil fuel compounds by a complex series of chemical reactions
combustion in stationary (e.g. smelters) and mobile and deposited on the Earth’s surface (see Figure 5.)
sources (e.g. motor vehicles). These gases may remain
The pH Scale
0 1 2 3 4 5 6 7 8 9 10 11 12 13 14
Acidic Neutral Alkaline
pH0 = Battery Acid pH4.3 = Acid Rain pH7.4 = Blood pH11 = Ammonia
pH2 = Lemon Juice pH5.6 = Clean Rain pH8.1 = Sea Water pH12.6 = Bleach
pH2.5 = Soda pH7 = Distilled Water pH9 = Baking Soda pH14 = Liquid Drain Cleaner
Figure 4: The pH scale32
Regional haze from forest fires and post monsoon (October and November). Open Processes involved in
Haze is the suspension of extremely small (dry) burning of agricultural residue contributes a large
acid deposition
particles in the atmosphere which are invisible to the amount of air pollutants and spreads over the Indo-
naked eye. However, they are numerous enough to Gangetic plains during post-monsoon to winter.31 Gaseous Particulate
reduce visibility. Small particles scatter and absorb pollutants in pollutants in
sunlight which affects cloud formation and may Exposure to haze air pollution can be substantial atmosphere atmosphere
introduce a range of effects from visibility reduction as it involves a large number of people over a large
to climate change. region. Haze also can cause transport disruption and
Dry Deposition
Dry Deposition
accidents due to visibility reduction, which may result
Uncontrolled forest fires in Southeast Asia cause haze in life and economic losses.
almost every year. Transboundary haze pollution from SOURCES Pollutants
forest fires is one of the most severe air pollution Acid Rain in cloud water
problems in the ASEAN region. The haze from forest Acid rain was one of the first transboundary issues and
fire causes deleterious effects to human health, nature, of concern. It was observed in 1960-1970s in North VOC NOx precipitates
and material property. The incomplete combustion America, Canada and Europe. Nowadays, most
NOx Hg
nature of forest fires emits smoke containing large industrialised countries have reduced SO2 emissions. Wet
amounts of toxic gases (e.g. CO and Hydrocarbons), However, NOX emissions have remained constant VOC SO2 Deposition
and fine particles, which can be transported over a or are rising due to increasing emissions from
great distance. mobile sources. Acid deposition includes both dry
and wet deposition. The term ‘acid rain’ is normally
In India, 5% of the biomass fires are from the used to address the wet acid deposition though
irrigated croplands whereas 14% is from semi- it is sometimes used interchangeably with ‘acid
Natural
deciduous forest fires. The maximum forest fire deposition’. The acidity of “pure” rain is pH 5.6-5.7. RECEPTORS
counts are reported during pre-monsoon (March A wide-range of pollutants in the atmosphere such Anthropogenic
to May) whereas the crop residue burning occurs in as SO2, NOX, ammonia (NH3), organic compounds,
a dual phase season pre-monsoon (April and May) and windblown dust, can lower pH and make
Figure 5: Acid deposition process
31 Shaik, D. S. (2019) Impact of biomass burning on regional aerosol optical properties: A case study over northern India. Journal of Environmental
Management, 244:328-343. 32 USEPA (2020) What is Acid Rain? United States Environmental Protection Agency, Washington DS, USA.
18 | | 19Acid deposition is a serious environmental threat. and nitrate) pollutants produced in East Asia can be
The resulting effects depend on the amount of acid transported not only to neighbouring countries but
compounds deposited to particular receptor surfaces also distant countries that are in downwind regions or
and on the sensitivity of these surfaces to acid continents, affecting air quality.
deposition.
Climate Change
Acid rain can kill aquatic life, damage trees, crops, Climate change is considered to be one of the
vegetation, buildings and monuments. It can corrode greatest challenges we face today with the climate-
metals, reduce soil fertility and can cause toxic metals related extreme weather events (e.g. heat waves,
to leach into underground drinking water resources. flooding, drought and tropical cyclones) becoming
In addition, SO2 and NOX and fine sulphate and ever more evident (see Figure 6). Human activities
nitrate particles may cause a reduction in visibility are estimated to have caused approximately 1.0°C of
reduction and adverse health effects. global heating above pre-industrial levels.
In Asia and the Pacific region, increased energy Global heating due to the greenhouse effect is likely
consumption and the use of sulphur-rich coal as a to reach 1.5°C between 2030 and 2052 if it continues
cheap fuel and oil are rapidly increasing.33 East Asia to increase at the current rate (see Figure 7). This will
contributes 36% and 29% to global emissions, which result in higher climate-related risks for natural and
is much more than the United States and Europe. human systems than at present, but lower than at
Oxidized S (SO2 and sulphate) and oxidised N (NOX 2°C.34
Figure 6: The Greenhouse Effect35
Figure 6: Greenhouse Effect
Many urban air pollutants not only affect air quality methane (CH4), nitrous oxide (N2O) and three groups
but also contribute to climate change. Polluting of fluorinated gases (sulphur hexafluoride (SF6),
air emissions from transport, power generation, hydrofluorocarbons (HFCs) and perfluorocarbons
industry, and domestic sectors contain both noxious (PFCs) are major GHGs.
pollutants and are GHGs. Carbon dioxide (CO2),
33 Duan, L. et al. (2016) Acid deposition in Asia: Emissions, deposition, and ecosystem effects. Atmospheric Environment. 146:55-69.
34 IPCC (2018) Summary for Policymakers. In: Global Warming of 1.5°C. An IPCC Special Report on the impacts of global warming of 1.5°C above
pre-industrial levels and related global greenhouse gas emission pathways, in the context of strengthening the global response to. Intergovernmental Figure 7: Temperature changes around the world (1901-2018)36
Panel on Climate Change, Bonn, Germany.
35 IPCC The Greenhouse Effect 36 BBC (2019) The chart defines our warming world.
20 | | 21pollutants are present in the atmosphere in much PM particles are any solid or liquid particles
smaller concentrations than criteria pollutants and suspended in the air. Fine particles are emitted from
3. Types of Air Pollution
often appear more localised. burning fuel for energy such as wood and charcoal
in fireplaces and barbeques, motor vehicles and
industries.
3.2 Criteria Air Pollutants
The major components of PM are sulphate, nitrates,
3.2.1 Particulate matter ammonia, sodium chloride, black carbon, mineral
PM is a common proxy indicator for air pollution dust and water. It consists of a complex mixture of
as it affects more people than any other pollutant. solid and liquid particles of organic and inorganic
Airborne PM is a complex mixture of particles with substances suspended in the air.
components having diverse chemical and physical
characteristics. Particles are generally classified by PM10 are particles less than 10 microns (µm) in
their aerodynamic diameters since size is a critical aerodynamic diameter. They can further be divided
determinant of site of deposition within the into coarse particles (from 2.5 to 10 µm), fine
respiratory tract.38 particles (PM2.5, less than 2.5 µm) and ultrafine (UF)
particles (PM0.1, particles of diameter less than 0.1 µm).
3.1 Types Of Air Pollutants Primary pollutants are emitted directly into the
atmosphere from the pollution source. Secondary
Air pollutants can be classified as primary pollutants pollutants are produced when primary pollutants
and secondary pollutants, according to their origin. interact with other substances in the air (see Table 1).
Table 1: General classification of gaseous air pollutants
Figure 8: Size comparison particulate matter particles39
Class Primary Pollutants Secondary Pollutants
Sulphur containing Sulphur dioxide (SO2) Sulphur trioxide (SO3) PM10 include inhalable particles (PM4.0), which can corrosive to organic materials and it irritates the
compounds Hydrogen sulphide (H2S) Sulphuric acid (H2SO4) enter the thoracic region. Fine particles (PM2.5) eyes, nose and lungs. The principal source of SO2
penetrate deep into the lung and into the air sacs. is the combustion of sulphur-containing fossil fuels
Organic compounds Volatile organic compounds Ozone (O3) These particles can damage cells in the airways and in industry and power stations, and for domestic
Ketones, aldehydes, acids, affect the lung causing exacerbation of asthma and heating. When large industries and power stations
Nitrogen containing Nitrogen oxide (NO) Nitrogen dioxide (NO2) chronic obstructive pulmonary disease. PM2.5 can also with tall stacks are located away from urban areas,
compounds Ammonia (NH3) Manganese oxide (MNO3) cause cardiovascular impacts and damage the heart SO2 emissions may still affect air quality in both rural
and circulatory system. and urban areas.
Halogen Hydrochloric acid (HCL)
-
Hydrogen fluoride (HF) 3.2.2 Sulphur dioxide SO2 in ambient air can affect human health,
SO2 is used as the indicator for the larger group particularly in those suffering from asthma and
Air pollutants in urban air can be divided into two Hazardous air pollutants consist of chemical, of gaseous sulphur oxides (SOX). Other gaseous chronic lung diseases even at levels well below
groups: criteria air pollutants for which national air physical and biological agents of different types SOX (such as SO3) are found in the atmosphere at 100 μg/m3. SO2 is known to be associated with
quality standards exist, and hazardous air pollutants. such as hydrocarbons (HC) (e.g. benzene, toluene concentrations much lower than SO2. increased daily mortality and hospital admissions
In India, NAAQs exist for eight key criteria and xylenes and other toxic organic pollutants (e.g. from respiratory and cardiovascular disease. SO2 is
pollutants: PM10, PM2.5,SO2, CO, NO2, O3, Lead (Pb) polycyclic aromatic hydrocarbons (PAHs), pesticides SO2 is an acidic gaseous pollutant. It is a colourless considered more harmful when particles and other
andNH3.37 and polychlorinated biphenyls (PCBs)). Hazardous gas with a pungent, suffocating odour. SO2 is pollution concentrations are high. In the atmosphere,
38 WHO (2005) WHO Air quality guidelines for particulate matter, ozone, nitrogen dioxide and sulphur dioxide. World Health Organization, Geneva,
Switzerland.
37 CPCB (2009) NATIONAL AMBIENT AIR QUALITY STANDARDS. New Delhi, India. 39 USEPA Basics. United States Environmental Protection Agency, Washington DC, USA.
22 | | 23SO2 is transformed into sulphuric acid and sulphate compounds to form small particles such as PM2.5
particles. and/or ultrafine particles.
SO2 emissions can be successfully reduced using The principal source of NOX is road traffic, power
fuels with low sulphur content (e.g. natural gas or stations, heating plants and industrial processes.
oil instead of coal).The flue gas desulphurisation NOX emissions can be reduced by optimisation of
technique, which uses a basic solution to scrub flue the combustion process (e.g. low NOX burners in
gas, can also reduce SO2 from emissions. power plants).Three-way catalytic converters for
mobile sources remove NOX from the exhaust gas by
In India, the ceramic industry has been identified as transforming it into nitrogen gas.
an important source of SO2 emissions. An increase
in the population and rural to urban migration is NO2 can irritate the lungs and lower resistance to
creating more demand for ceramic products, which respiratory infections such as influenza. Continued or
is providing an additional growth opportunity for frequent exposure to high concentrations may cause
ceramic industries. increased incidence of acute respiratory illness in
children.
3.2.3 Nitrogen oxides
NOX is a mixture of NO and NO2. The majority of An analysis of NO2 satellite data41 showed that
NOX emissions are in the form of nitrogen oxide transport and industrial clusters are the cause of
(NO), which is oxidised in the atmosphere to the the worst NOX hotspots in India.42 NO2 satellite
secondary pollutant NO2. NO2 is the major form of data from the Tropospheric Monitoring Instrument
NOX in the atmosphere. NO is a colourless gas while (TROPOMI) (February 2018 - May 2019) showed
NO2 is a gas of reddish-brown colour with a distinct the most polluted hotspots such as the cities of New
sharp, biting odour.40 Delhi - National Regional Capital (NCR), Bengaluru, Figure 9: Formation of tropospheric ozone44
Kolkata, Chennai and Hyderabad. These cities have
Besides methane (CH4), NO2 is a major source of high vehicle populations and diesel/oil consumption. Ground-level O3 is a colourless gas that irritates the a distance from busy traffic areas such as rural suburb
tropospheric ozone in the presence of hydrocarbons However, coal consumption and industrial clusters airways of the lungs, increasing the symptoms of areas than in the city centres.
and ultraviolet light and therefore plays an important such as Sonbhadra (Madhya Pradesh), Singrauli (Uttar those suffering from asthma and lung diseases. It may
role in determining ambient O3 concentrations. NO2 Pradesh), Korba (Chattisgarh), Talcher (Odisha), increase the lung’s reaction to allergens and other 3.2.5 Carbon monoxide
is also a key precursor of nitrate particles, which Chandrapur (Maharashtra), Mundra (Gujarat) and pollutants. O3 not only affects human health but also CO is a toxic gas which is produced as a result of
form an important fraction of the ambient air PM2.5 Durgapur (West Bengal) were equally polluting with damages vegetation and decreases the productivity incomplete combustion. Once emitted, CO can
mass. NOX reacts with NH3, moisture, and other regard to NOX emissions. of some crops. It can also injure flowers and shrubs remain in the atmosphere for a few months and is
and may contribute to forest decline. O3 can also eventually oxidised to CO2.
3.2.4 Ozone damage synthetic materials, cause cracks in rubber,
O3 is the main component of the photochemical accelerate fading of dyes, and speed deterioration CO interferes with the oxygen-carrying capacity
smog. Tropospheric or ground-level O3 is the of some paints and coatings. Likewise, it damages of blood because of its high affinity for red blood
toxic pollutant which we breathe in contrast to cotton, acetate, nylon, polyester and other textiles. cells, which is more than 200 times higher than
stratospheric O3, which protects the earth harmful O3 contributes to global heating as one of the most that of oxygen. This gas therefore can lead to a
ultraviolet radiation. important GHG. significant reduction in the supply of oxygen to the
heart, particularly in people suffering from heart
Ground-level O3 is formed from the photochemical Ground-level O3 is a secondary pollutant because disease. A range of symptoms can be expected
reactions of VOC and NOX in the presence it is not directly emitted from sources but rather, from CO exposure, such as headaches, dizziness,
of sunlight. This results in higher ambient O3 produced when the primary pollutants react in weakness, nausea, confusion, disorientation, and
concentrations in summer months. CH4 is the presence of sunlight. These two primary pollutants fatigue in healthy people, and episodes of increased
dominant anthropogenic VOC contributing to O3 are NOX and VOCs which come from natural sources chest pain in people with chronic heart diseases.
formation in the global troposphere (See Figure 9). as well as human activities. NOX are nitrogen-oxygen Exposure to high CO levels is lethal, but the normal
In the lowest part of the atmosphere, in regions compounds that include the gases NO and NO2 and concentrations found in the urban area are much
where NOX concentrations are sufficiently high, are produced by the burning of fossil fuels. VOC lower than the lethal level.
reactions of OH radicals with CH4 and other are carbon-containing gases (excluding CO2, CO,
substances leads to the production of O3.43 CH4, and chlorofluorocarbons) and vapours such as In urban areas, CO is produced almost entirely
gasoline fumes. (~90%) from road traffic emissions. Other sources
of CO such as open fires may be significant in local
40 Brusseau, M. L. and Musil, S. A. (2019) Atmospheric Pollution in Environmental and Pollution Science.
41 NO2 pollution (India) (2019), Google Maps.
Once formed, O3 is destroyed by NO which is high areas. The emissions can be reduced by optimising
42 Greenpeace (2019) New satellite data shows top polluting NOx hotspots in India range from cities to industrial clusters. Press Release, Greenpeace, at traffic sites, and therefore O3 is normally higher at the combustion conditions to burn more completely,
India.
43 Van Dingenen R. et al. (2018) Global trends of methane emissions and their impacts on ozone concentrations. JRC Science for Policy Report, EC
Joint Research Centre, Ispra, Italy. 44 CCAC (2020) Tropospheric Ozone Climate and Clean Air Coalition, Paris, France.
24 | | 25You can also read