Allo-triploid Sphagnum xfalcatulum: single individuals contain most of the Holantarctic diversity for ancestrally indicative markers ...
←
→
Page content transcription
If your browser does not render page correctly, please read the page content below
Please do not remove this page

Allo-triploid Sphagnum xfalcatulum:
single individuals contain most of the
Holantarctic diversity for ancestrally indicative
markers
Karlin, Erik F.; Smouse, Peter E.
https://scholarship.libraries.rutgers.edu/discovery/delivery/01RUT_INST:ResearchRepository/12643434560004646?l#13643522980004646

Karlin, & Smouse, P. E. (2017). Allo-triploid Sphagnum xfalcatulum: single individuals contain most of the
Holantarctic diversity for ancestrally indicative markers. In Annals of Botany (Vol. 120, Issue 2, pp.
221–231). Rutgers University. https://doi.org/10.7282/T3FX7CRH
Document Version: Accepted Manuscript (AM)

Published Version: https://dx.doi.org/10.1093/aob/mcw269

This work is protected by copyright. You are free to use this resource, with proper attribution, for
research and educational purposes. Other uses, such as reproduction or publication, may require the
permission of the copyright holder.
Downloaded On 2022/01/16 01:03:55 -0500
1   Original Article: Manuscript ID 16613
 2

 3              Allo-allo-triploid Sphagnum ×falcatulum: single individuals contain most

 4                   of the Holantarctic diversity for ancestrally indicative markers

 5

 6   Eric F. Karlin1, Peter E. Smouse2

     1
 7       Environmental Science, School of Theoretical & Applied Science, Ramapo College, Mahwah,

 8       NJ 07430-1680, USA
     2
 9           Department of Ecology, Evolution, and Natural Resources, School of Environmental &

10       Biological Sciences, Rutgers University, New Brunswick, NJ 08901-8551, USA

11   Running Header: Allelic diversity in Sphagnum xfalcatulum

12   Corresponding Author: Eric F. Karlin

13                              Department of Environmental Science

14                              School of Theoretical & Applied Science

15                              Ramapo College, Mahwah, NJ 07430-1680 (USA)

16                              Phone: 201-485-7743;    FAX: 201-684-7637

17                              E-mail address: ekarlin@ramapo.edu

18

19

20   Article file:                1

21   Colour Figures:               4

22   Supplemental Material:        1
Allelic diversity in Sphagnum ×falcatulum Karlin and Smouse
1 Abstract
2 Background and Aims Allopolyploids exhibit both different levels and patterns of genetic
3 variation than are typical of diploids. However, scant attention has been given to the partitioning
4 of allelic information and diversity in allopolyploids, particularly that among homeologous
5 monoploid components of the hologenome. Sphagnum ×falcatulum is a double allopolyploid
6 peat moss that spans a considerable portion of the Holantarctic. With monoploid genomes from
7 three ancestral species, this organism exhibits a complex evolutionary history involving serial
8 inter-subgeneric allopolyploidizations.
9 Methods Studying populations from three disjunct regions (South Island [New Zealand]; Tierra
10 de Fuego archipelago [Chile, Argentina]; Tasmania [Australia]), allelic information for five
11 highly stable microsatellite markers that differed among the three (ancestral) monoploid
12 genomes is examined. Using Shannon information and diversity measures, the holoploid
13 information, as well as the information within and among the three component monoploid
14 genomes, is partitioned into separate components for individuals within and among populations
15 and regions, and then converted those information components into corresponding diversity
16 measures.
17 Key Results The majority (76%) of alleles detected across these five markers are most likely to
18 have been captured by hybridization, but the information within each of the three monoploid
19 genomes varies, suggesting a history of recurrent allopolyploidization between ancestral species
20 containing different levels of genetic diversity. Information within individuals, equivalent to the
21 information among monoploid genomes (for this dataset), is relatively stable, and represents 83%
22 of the grand total information across the Holantarctic, with both inter-regional and inter-
23 population diversification each accounting for about 5% of the total information.
1Allelic diversity in Sphagnum ×falcatulum Karlin and Smouse
1 Conclusions Sphagnum ×falcatulum likely inherited the great majority of its genetic diversity at
2 these markers by reticulation, rather than by subsequent evolutionary radiation. However, some
3 post hybridization genetic diversification has become fixed in at least one regional population.
4 Methodology allowing statistical analysis of any ploidy level is presented.
5
6 Key Words: allelic information, allelic diversity, allopolyploid, bryophytes, hologenome,
7 populations, reticulation, Shannon partitioning, Sphagnum, Sphagnum ×falcatulum,
8
9
2Allelic diversity in Sphagnum ×falcatulum Karlin and Smouse
1 INTRODUCTION
2 Allopolyploids exhibit both different levels and patterns of genetic variation than are typical of
3 diploids, with accentuated differences in higher order allopolyploids such as Triticum ×aestivum
4 L. (bread wheat, Marcussen et al., 2014), Elymus ×repens (L.) Gould (quackgrass or couchgrass,
5 Mason-Gamer, 2008), and the peat mosses Sphagnum ×falcatulum Besch. (Karlin et al., 2009;
6 Karlin, 2014) and S. ×planifolium Müll. Hal. (Karlin et al., 2014), all of which have nuclear
7 genomes from three ancestral species. The holoploid genome (entire chromosome complement)
8 of an allopolyploid gametophyte consists of two or more homeologous monoploid genomes
9 (Greilhuber et al., 2005), with potentially variable genetic diversity among the ancestral
10 genomes. Gain or loss of homeologous chromosomes arising from meiotic or mitotic aberrations,
11 may lead to changes in the structure of a holoploid genome (Chester, 2012, 2015), with the
12 balance between disomic and polysomic inheritance across homeologous chromosomes playing a
13 key role in this regard. Thus the holoploid genome of an allopolyploid may vary considerably
14 across individuals and populations of the derivative organism (Chester, 2012, 2015). In marked
15 contrast with the gametophytes of diploid vascular species and haploid bryophyte species,
16 allopolyploid gametophytes harbour considerable internal genetic diversity, and that difference is
17 particularly significant for bryophytes, whose gametophytes are the dominant phase of the life
18 cycle. However, scant attention has been given to the partitioning of allelic information and
19 diversity in allopolyploids, particularly that among monoploid components of the hologenome.
20 The origin of any allopolyploid lineage is associated with an extreme founder effect. In
21 the case of monoicous bryophytes (with hermaphroditic gametophytes), it is possible for a single
22 meiotically unreduced spore from a hybrid sporophyte to give rise to both the first gametophytic
23 generation of a novel allopolyploid lineage and the first sporophytic generation, via intra-
3Allelic diversity in Sphagnum ×falcatulum Karlin and Smouse
1 gametophytic selfing. In all such cases, the genetic diversity included within the founding
2 gametophyte, as well as that within individuals of the first generation of sporophytes, would
3 represent the allelic divergence between the component homeologous monoploid genomes.
4 Barring meiotic aberrations or mutation itself, all spores produced by such first generation
5 sporophytes would be genetically identical to the founding gametophyte, as well as to each other.
6 Thus the founding genotype of such allopolyploids would initially be maintained by both
7 vegetative and sexual reproduction, with spore production allowing for a rapid and long distance
8 distribution of that lineage. Subsequent genetic novelty may arise via new mutation,
9 recombination (including inter-genomic transfers), and change in hologenomic structure caused
10 by gain or loss of homeologous chromosomes, so additional genetic diversity may augment that
11 acquired by the initial reticulation (hybridization) event (Feldman et al., 2012). Sexual
12 reproduction between different allopolyploid lineages, resulting from recurrent allopolyploidy,
13 could augment genetic diversity among individuals (Soltis et al., 2010; Symonds et al., 2010).
14 Genetic markers with a unique allele from each homeologous genome in an individual
15 are useful in the study of allopolyploid genomes, particularly for the assessment of allelic
16 diversity within and among the component monoploid genomes. In addition, allopolyploid
17 bryophyte gametophytes are good model organisms for such studies, because the assignment of
18 alleles to monoploid genomes is facilitated by the absence of homologous chromosome pairs.
19 Objectives
20 Here, we use an existing microsatellite (SSR) data set to explore the application of recently
21 articulated Shannon information and diversity measures (c.f., Jost, 2006, 2007; Sherwin et al.,
22 2006; Sherwin, 2010; Smouse et al., 2015) to genetically allo-allo-triploid gametophytes in S.
23 ×falcatulum, as those manifest across levels of geographic organization, ranging from that within
4Allelic diversity in Sphagnum ×falcatulum Karlin and Smouse
1 single individuals, representing the monoploid ancestral species (of the haplo-triploid), to that
2 among extant individuals, spread across three Holantarctic regional populations — NZ: South
3 Island New Zealand; TdF: Tierra Del Fuego (Chile and Argentina); and Tas: Australian state of
4 Tasmania (Macquarie Island and Tasmnaia). For comparison, we also examined the patterns of
5 genetic information and diversity within the two immediate progenitor taxa.
6 We compared the relative contributions of allelic diversity captured by ancestral
7 hybridization events with those emerging subsequently, addressing four specific questions: (1)
8 How much of the total allelic information and diversity in S. ×falcatulum was ‘captured’ from
9 the progenitors? (2) How does allelic information and diversity vary among the three monoploid
10 genomes? (3) To what extent has change in hologenomic structure occurred within S.
11 ×falcatulum? (4) How does the partitioning of allelic information and diversity vary across the
12 Holantarctic geographic range of S. ×falcatulum?
13 MATERIALS AND METHODS
14 The species
15 The genus Sphagnum (peat mosses) occurs on all continents except Antarctica and contains some
16 250 – 400 species (Shaw et al. 2016). Based on multigene phylogenetic analyses, Shaw et al.
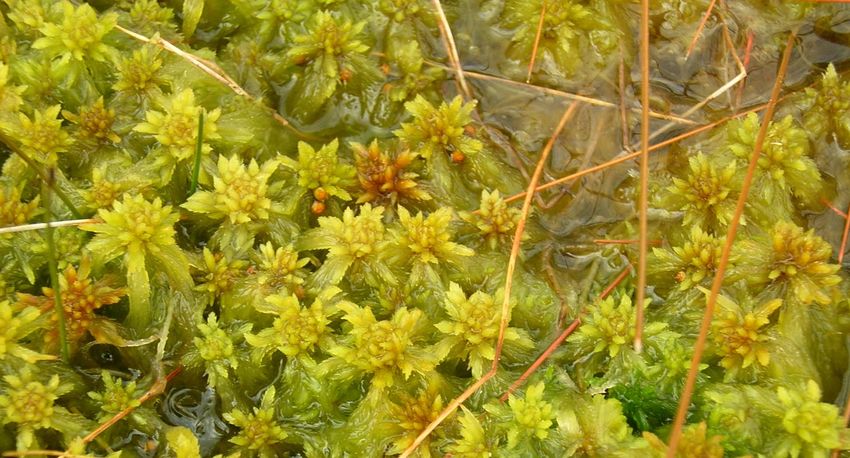
17 (2010) recognized five subgenera within the genus. The double allopolyploid S. ×falcatulum
18 (Fig. 1) is gametophytically allo-allo-triploid, with homeologous monoploid genomes (R, S and
19 T), each captured from a different ancestral species; the evolutionary history involves both inter-
20 subgeneric and serial inter-ploidal hybridization (Karlin et al., 2009, 2011, 2013; Karlin, 2014).
21 The immediate progenitors are the gametophytically haploid S. cuspidatum Ehrh. ex Hoffm
22 (subg. Cuspidata), which contributed monoploid genome T, and the gametophytically allodiploid
23 S. × irritans Warnst., an inter-subgeneric hybrid which contributed homeologous genomes R,
5Allelic diversity in Sphagnum ×falcatulum Karlin and Smouse
1 (associated with an unknown subg. Cuspidata species) and S ( associated with an unknown subg.
2 Subsecunda species) (Fig. 2; Karlin et al., 2009, 2011, 2013; Karlin, 2014, Karlin and Robinson,
3 2016). The genetic diversity within S. ×falcatulum thus represents the initial tripling of
4 evolutionary potential, via double reticulation, followed by subsequent innovation (mutations,
5 changes in hologenomic structure, genetic recombination). With its history of inter-subgeneric
6 hybridization, divergence among S. ×falcatulum’s monoploid genomes is thought to be among
7 the highest in Sphagnum allopolyploids (Karlin 2014; Karlin et al. 2014). Based on nuclear
8 nucleotide sequences, divergence between inter-subgenomic sequences in S. ×falcatulum (S vs
9 R; S vs T) was about twice as high as that between intra-subgeneric sequences (R vs T) (Karlin
10 2014).
11 [ Fig. 1 – photo of plants about here ]
12 Although a relatively young species (estimated origin = 23.5–116 ky BP), putatively
13 unisexual (dioecous) S. ×falcatulum is the most widespread peat moss in the Holantarctic (Fig. 2;
14 Karlin et al., 2013). Genetically documented populations occur in New Zealand (both North and
15 South Islands), the Tierra del Fuego archipelago (Chile and Argentina), and the Australian states
16 of Victoria and Tasmania (Karlin et al., 2013; Karlin and Robinson, 2016). Its precise
17 geographic extent is unclear, by virtue of strong morphological overlap and sympatry with its
18 immediate progenitors (Karlin et al., 2009, 2011; Karlin and Robinson, 2016). Separation of the
19 three taxa at the macroscopic level is sometimes difficult, and they form a cryptic species
20 complex in the Holantarctic (Karlin et al., 2013; Karlin and Robinson, 2016). Karlin et al. (2013)
21 concluded that S. ×falcatulum probably evolved in New Zealand, with subsequent colonization
22 of Macquarie Island, Tierra del Fuego, and possibly Tasmania, each via a single propagule or (at
23 most) a small number of closely related individuals. Sexual reproduction is known to occur in S.
6Allelic diversity in Sphagnum ×falcatulum Karlin and Smouse
1 ×falcatulum, so genetic recombination plays at least some role in its evolution and population
2 structure, but sexual assortment is absent from at least some isolated populations, both locally
3 and regionally. Although common on South Island, sexual reproduction appears to be rare in
4 Tasmania and lacking in both Tierra del Fuego and Macquarie Island (Karlin et al., 2013).
5 Occasional sexuality aside, vegetative reproduction is ubiquitous in Sphagnum, so populations
6 are typically composed of one to several gametophytic clones.
7 The allodiploid maternal ancestor (S. ×irritans) of S. ×falcatulum has been genetically
8 documented only from two New Zealand islands: South Island (where it is sympatric with S.
9 ×falcatulum) and Chatham Island (Karlin et al., 2009; Karlin and Robinson, 2016). Sphagnum
10 ×irritans had been treated as a heterotypic synonym of S. ×falcatulum (Andrews, 1949; Fife,
11 1996), but Karlin and Robinson (2016) found the type to be associated with allo-diploid plants
12 instead. Thus S. ×irritans has been removed from the synonymy of allo-allo-triploid S.
13 ×falcatulum and is now recognized as a proper species. The paternal ancestor, S. cuspidatum
14 (monoploid), was considered to be a Holarctic species with disjunct populations in Australia and
15 New Zealand by Warnstorf (1911). It was subsequently excluded from Australasia by Andrews
16 (1949), Sainsbury (1955), Scott et al. (1976), Catcheside (1980), Beever et al. (1992), Fife
17 (1996), and Seppelt (2006). Recent genetic analyses, however, have documented its presence at
18 two sites in Queensland, Australia, and S. cuspidatum is now reported for all continents except
19 Antarctica (Karlin et al., 2011).
20 [ Fig. 2 – Holantartic map – about here ]
21 Taxon Sampling
22 The SSR genotypes deployed for this study have been described by Karlin et al. (2009, 2011,
23 2013) and Karlin and Robinson (2016), and involved 138 individuals of S. × falcatulum
7Allelic diversity in Sphagnum ×falcatulum Karlin and Smouse
1 gametophytes collected from South Island (New Zealand), Tierra del Fuego archipelago (Chile,
2 Argentina), and the Australian state of Tasmania (Supplementary Data, Table S1). The most
3 complete coverage was for South Island (NZ), with 97 individuals collected from 11 sites (=
4 populations). The Tierra del Fuego archipelago (TdF) was represented by 24 individuals
5 collected from 16 sites across eight islands and one mainland location. Eight of these sites were
6 each represented by one individual and eight sites were represented by two individuals each. The
7 state of Tasmania (Tas) was represented by one site on Macquarie Island (with 15 individuals)
8 and two sites on Tasmania (with one individual each). In order to allow for Shannon analysis
9 among and within regions, TdF and Tas were each divided into ‘super populations’ (i.e., sub-
10 regions). TdF had three ‘super populations’: (1) Isla Grande de la Tierra del Fuego and one
11 mainland site (eight individuals from six sites); (2) sites occurring south of Isla Grande de la
12 Tierra del Fuego and north of 55.6° S (seven individuals from five sites across three islands); (3)
13 sites south of 55.6° S (nine individuals from five sites across four islands). There were two
14 ‘super populations’ for Tas: Macquarie Island (15 individuals from one site) and Tasmania (two
15 individuals from two sites). The SSR assay battery also included data for 17 individuals of S.
16 ×irritans (from four South Island sites) and 11 individuals of S. cuspidatum (from two
17 Queensland, Australia sites).
18 Microsatellite Genotypes
19 DNA was extracted from one gametophyte stem selected from each specimen. DNA extractions
20 were accomplished with the protocols described by Shaw et al. (2003). All samples were assayed
21 across 14 SSR markers. Protocols for microsatellite (SSR) amplification and scoring are
22 presented in Karlin et al. (2008). Fragments of different sizes (nucleotide pairs) were coded as
23 alleles.
8Allelic diversity in Sphagnum ×falcatulum Karlin and Smouse
1 Here, we have deployed just five of these markers. They were selected because each had
2 alleles (within any single individual) that could be unambiguously assigned to their respective
3 monoploid genomes. Thus these ‘ancestrally indicative’ markers allowed for a study of the
4 allelic diversity among and within the three monoploid genomes present in S. ×falcatulum. The
5 markers were 1, 12, 18 ,19, and 22 (numbered as in Shaw et al., 2008). Each of the other nine
6 SSR markers, though easily assayed and reliable, had some, even many, alleles which could not
7 be assigned to ancestral genomes.
8 The allelic data for the individuals is listed in Supplementary Data (Table S2). All five
9 markers exhibited stable homeologous alleles, most of which occurred both within S.
10 ×falcatulum and within at least one of the three ancestral linages. Each individual would thus be
11 expected to contain one allele from each of the three homeologous ‘loci’, so the five markers
12 collectively present five ‘trios’ of homeologous alleles within each individual (1R, 1S, 1T),
13 (12R, 12S, 12T), (18R, 18S, 18T), (19R, 19S, 19T), (22R, 22S, 22T). These five trios permit
14 comparison of allelic diversity captured by the initial hybridization events (Fig. 3) with that
15 emerging post-hybridization within S. ×falcatulum itself.
16 Allelic Information and Diversity
17 To characterize the patterns of holoploid (triploid) allelic diversity within S. x falcatulum, we
18 computed estimates of (allelic) Shannon information. Briefly, consider a single SSR marker (say
19 the marker A), represented in the collective (S. ×falcatulum) sample (of N) individuals by a
20 series of alleles (say A 1 , ... , A K ). The kth allele (k = 1, ... , K) is present in that collective sample
21 with a relative frequency (in the N trios) of P k = (X k /3N). The total (within-species) Shannon
22 information (H WS ) for marker A is defined as
23 0 ≤ H WS = −∑ k =1 p k ⋅ ln ( p k ) ≤ ln (3N ) ,
K
[1]
9Allelic diversity in Sphagnum ×falcatulum Karlin and Smouse
1 which is bounded below by ‘0’ and above by ln (3N). The lower bound is achieved when all 3N
2 of the alleles are of the same type (monomorphic marker); the upper bound is achieved when all
3 3N alleles are different and appear once each. To convert from Shannon (allelic) information to
4 allelic diversity, we exponentiate. The total holoploid within-species diversity (σ WS ) for this A-
5 locus is thus defined as
6 1 ≤ σWS = exp{H WS} ≤ 3 N , [2]
7 obviously bounded below by 1 (= a single, monomorphic allele) and above by 3N (= all alleles
8 different and equally frequent). Both information and diversity increase with the number of
9 different alleles, and for any particular number of alleles, both information and diversity increase
10 with ‘evenness’ of their frequencies. Computation of allelic diversity for each homeologous
11 monoploid genome was the same, but with the upper bound set at N and the relative frequency of
12 each allele being P k = (X k /N).
13 Our targets for allo-triploid Sphagnum gametophytes are the diversity components
14 themselves, but Shannon information values are conveniently additive (see below), so we can
15 partition information among and within regions (H AR and H WR ), among and within populations
16 (H AP and H WP ) for single regions, as well as among and within allotriploid individuals (H AI and
17 H WI ) for single populations, for each of the five loci separately. We then average the assayed
18 information values for the five marker loci. For a single region (say NZ), we compute the
19 information and diversity within that stratum, as in Eq. [1], but with 3N now defined as the
20 theoretical maximum number of alleles within that region (H WR-NZ ). Using a weighted average
21 within-region information value for the three regions (H WR ), we then compute the among-
22 regions information component (H AR = H WS – H WR ). We extract average within-population
23 (H WP ) and average within-(triploid)-individual (H WI ) information values in similar fashion, and
10Allelic diversity in Sphagnum ×falcatulum Karlin and Smouse
1 calculate the among-population (H AP = H WR – H WP ) and among-individual (H AI = H WP – H WI )
2 values. We compute the information partition, marker by marker, and then average. The
3 information value is then exponentiated to obtain the diversity values, all measured in “effective
4 number of ‘equi-frequent’ units. The total layout takes the following form:
Component Information Diversity Effective Number Units
Within Genus H WG γ WG = exp{H WG } Alleles per Genus
Among Species H AS θ AS = exp{H AS } Species per Genus
Within Species H WS σ WS = exp{H WS } Alleles per Species
Among Regions H AR δ AR = esp{H AR } Regions per Species
Within Regions H WR ρ WR =exp{H WR } Alleles per Region
Among Populations H AP β AP = exp{H AP } Populations per Region
Within Populations H WP α WP =exp{H WP } Alleles per Population
Among Individuals H AI λ ΑΙ = exp{H AI } Individuals per Population
Within Individuals H WI µ WI = exp{H WI} Alleles per Individual
5
6 Information Analysis is similar to traditional Analysis of Variance (c.f., Smouse and
7 Ward, 1978; Smouse et al., 2015). Information is additive,
8 H WG = H AS + H WS , [3]
9 H WS = (H AR + H WR ) = H AR + ( H AP + H WP ) = H AR + H AP + (H AI + H WI ) , [4]
10 but the diversity components are multiplicative (c.f., Tuomisto, 2010).
11 γ WG = θ AS ∙ σ WS ,
12 [5]
11Allelic diversity in Sphagnum ×falcatulum Karlin and Smouse
1 σWS = (δAR ⋅ ρWR ) = δAR ⋅ (βAP ⋅ α WP) = δAR ⋅ βAP ⋅ (λ AI ⋅ µ WI) . [6]
2 Allelic diversity within groups (γ WG , σ WS , ρ WR , α WP , µ WI ) is interpreted as effective numbers of
3 alleles per marker within a group. Allelic diversity among groups (γ AS , δ AR , β AP , λ AI ) is
4 interpreted as effective numbers of non-overlapping allele sets, or ‘compositional units’, among
5 strata per marker (Tuomisto, 2010). Information and diversity among groups measure the
6 divergence (differentiation, distinctness) among the groups (strata) in question (Whittaker, 1977;
7 Sherwin et al., 2006; Jost, 2010; Sherwin, 2010; Tuomisto, 2010; Smouse et al., 2015). For this
8 dataset, allelic diversity within individuals (µ WI ) is equivalent to the divergence among
9 monoploid genomes. Thus µ WI can be interpreted as being both the effective numbers of alleles
10 (within an individual) and also as the effective number of non-overlapping allelic sets, or
11 monoploid genomes (within an individual).
12 We used GenAlEx 6.5 (http://biology.anu.edu.au/GenAlEx/; Peakall and Smouse 2006,
13 2012) to construct the analyses reported here. For each individual, data were arranged in three
14 consecutive rows (one per ancestral monotype), with each of the five trios represented by a
15 single column. This slight shift in GenAlEx data format allowed haplo-triplo data to be analyzed
16 as needed here. Shannon Analysis was carried out using the ‘Partition’ option, with each
17 individual defined as a ‘population’ of three sub-samples, with each sub-sample represented by
18 one row of data. This approach was elaborated here to deal with additional regions across the
19 Holantarctic, and could easily be extended to other ploidy levels. An example data sheet and a
20 results sheet for triploid analysis are provided in Supplementary Data (Tables S3, S4).
21 Three of the five markers typically had three different alleles per marker per individual in
22 S. ×falcatulum, with one allele from each monoploid genome; two markers had only a pair of
23 alleles per individual (because of allelic overlap between R and T). These patterns appear to
12Allelic diversity in Sphagnum ×falcatulum Karlin and Smouse
1 represent those directly inherited from the ancestor and thus allow for the calculation of the
2 ‘founding’ (or original) H WI and µ WI for S. ×falcatulum. Averaging across the five markers
3 yields a mean ‘founding’ information and diversity of [ H WI = 0.914 ⇔ µ WI = 2.49 ]. For S.
4 ×irritans, which has 1) no allelic overlap between its two monoploid genomes (R’ and S’) at
5 these markers, and 2) each marker typically has two alleles per individual, mean ‘founding’
6 information and diversity are [ H WI = 0.693 ⇔ µ WI = 2.00 ]. For both allopolyploid species, a
7 change in hologenomic structure manifests as a change in the within-individual components
8 (H WI ⇔ µ WI ). A tally of the H WI associated with each individual sampled was made to examine
9 the extent of variation in H WI .
10 RESULTS
11 Monoploid Genomes
12 A total of 26 different alleles were detected across the three monoploid genomes assayed with
13 the five markers, with two monomorphic alleles (12R ≡ 12T) and (18R ≡ 18T) being shared by
14 the (co-subgeneric) ancestral monoploid genomes R and T (Table 1). Nineteen of the alleles
15 (76%) co-occurred in the immediate progenitors, and we will refer to such alleles as ‘ancestral’
16 alleles. For each monoploid genome, one ancestral allele had a frequency ≥ 0.60 at each
17 homeologous locus, and with a single exception (18S), these ‘most frequent’ alleles were also
18 predominant in the immediate progenitors (Table 1). The six (of 19) ancestral alleles having a
19 lower frequency in S. ×falcatulum were also lower frequency polymorphs in the immediate
20 ancestors. Moreover, only two of the seven putative ‘de novo’ (new) alleles detected in S.
21 ×falcatulum (i.e., not yet found in the progenitors) had frequencies ≥ 0.05 in the respective
22 monoploid genomes. The ‘de novo’ alleles in S. ×falcatulum were assigned to a homeologous
23 genome, based on similarity in size to the ancestral alleles associated with that homeologous
13Allelic diversity in Sphagnum ×falcatulum Karlin and Smouse
1 genome or if the ancestral alleles for the other two homeologs were also present in an individual.
2 The mean total combined frequency of de novo alleles across the five markers was < 0.01 in
3 genomes T and R and ~0.06 in S. The mean number of alleles per marker with frequency ≥ 0.05
4 and the mean number of alleles per marker shared with the two immediate progenitors were all
5 lowest in T, highest in S, intermediate in R (Table 2). The numbers of monoploid haplotypes
6 (across 15 homeologous loci) detected for R, S and T were 7, 13, and 3, respectively, with the
7 most common haplotypes having frequencies of 0.69, 0.46 and 0.98 for R, S, and T, respectively.
8 We infer that the ancestral alleles were captured by hybridization and that the de novo alleles
9 have probably developed within S. ×falcatulum, subsequent to formation. Most of the genetic
10 information and diversity contained within these five markers for S. ×falcatulum were inherited
11 from the progenitors.
12 Allelic information and diversity
13 Considerable divergence was detected among all three monoploid genomes based on the
14 five markers. Allelic information and diversity between S (subg. Subsecunda) and each of the
15 two subg. Cuspidata monoploid genomes R and T were [ H AS = 0.693 ⇔ θ AS = 2.00 ].
16 Information and allelic diversity between R and T were [ H AS = 0.415 ⇔ θ AS = 1.51 ]. A
17 detailed partition of allelic information and diversity for each monoploid genome is presented in
18 Table 3. Total allelic information and diversity (H WS ⇔ σ WS ) across the three regions differed
19 among the three monoploid genomes, with H WS (S) > H WS (R) > H WS (T). This ranking held for
20 all other partitions, except for that within individuals, where [ H WI = 0.000 ⇔ µ WI = 1.00 ] for
21 each of the three monoploid genomes (Table 3). Total allelic diversity ranged from σ WS (S) =
22 1.47 to σ WS (T) = 1.02. For each monoploid genome, allelic diversity among individuals within
14Allelic diversity in Sphagnum ×falcatulum Karlin and Smouse
1 populations (λ AI) was slightly higher than that detected among populations (β AP ) and that among
2 regions (δ AR ); H AI represented between 40% and 58% of the respective H WS values.
3 All Shannon analyses were based on the five markers, with one exception. Because the
4 TdF population lacked the (22R) allele, just four markers were used to determine the partitioning
5 of information and diversity within and among regions for R. However, by treating all
6 individuals as one population, a second value for just H WS (R) was calculated using all five
7 markers. Based on five markers, [ Η WS (R ) = 0.115 and ρWS (R ) = 1.12], which were comparable
8 to, but slightly lower than the H WS (R) and ρ WS (R), based on four markers (Table 3). With either
9 approach, H WS (R) and ρ WS (R) were intermediate between the corresponding values for T and S.
10 [ Table 3 – about here ]
11 Holoploid genomes
12 Among region allelic information and diversity
13 A detailed partition of the holopoloid allelic information and diversity is presented in Table 3.
14 Based on Shannon analysis of the holoploid genome (as triploid data) for the five markers, the
15 grand total information for S. ×falcatulum across the three regions was H WS (R,S,T) = 1.089,
16 translating into an (effective number) diversity equivalent of σ WS (R, S, T) ~ 2.97 alleles per trio.
17 By far the majority of allelic diversity was present within each individual, with µ WI = 2.46 alleles
18 per trio (marker). As this diversity also represents divergence among the monoploid genomes, it
19 also shows that the effective number of monoploid genomes present is 2.46. Allelic information
20 within individuals H WI (R,S,T) = 0.901 represented ~ 83% of H WS (R,S,T). This is in stark
21 contrast to the monoploid analysis, where for each monoploid genome, µ WI = 1.00 and H WI
22 represented 0.0% of H WS . The next highest diversity among partitions was λ AI(R,S,T) = 1.08,
15Allelic diversity in Sphagnum ×falcatulum Karlin and Smouse
1 with H AI (R,S,T) representing ~ 7% of H WS (R,S,T). β AP (R,S,T) and δ AR (R,S,T) were
2 comparable, with H AR (R,S,T) and H AP (R,S,T) each representing ~5% of H WS (R,S,T). Thus ~
3 95% of H WS (R,S,T) was resident within regions and ~ 90% was resident within populations. For
4 S. × falcatulum, ancestry is (almost) everything!
5 [ Fig. 4 – about here ]
6 Within region allelic information and diversity
7 New Zealand — A detailed partition of the holoploid allelic information and diversity for NZ is
8 presented in Table 4 and Fig. 4. Shannon analysis of the holoploid genome within NZ yielded a
9 pattern of diversity among partitions similar to the pattern detected for the analysis across the
10 three regions, albeit with slightly higher allelic information and diversity values at all levels
11 (Tables 3, 4). Total information for New Zealand was H WR (NZ) = 1.097, translating into a
12 diversity equivalent of 3.00 alleles per trio (marker). H WI (NZ) represented 83% of H WR (NZ),
13 H AP (NZ) represented 7%, and H AI (NZ) accounted for 10%. Thus some 93% H WR (NZ) was
14 resident within populations, and most of that was the ancestral diversity resident within any
15 single individual.
16 [Table 4 – about here]
17 Tasmania and Tierra del Fuego — Shannon analysis of the holoploid genome for both of these
18 regions showed a starkly different partitioning of allelic information and diversity among levels
19 than that detected for NZ (Table 4). For both of these regions, 100% of holoploid H WR was
20 associated with H WI ; no information was present in any of the other components. Consequently,
21 allelic information and diversity in these two regions was much lower than that detected for NZ,
22 with ρ WR (Tas) = 2.49 and ρ WR (TdF) = 2.30. H WI differed among the three regions, being highest
23 in the Tas and lowest in the TdF.
16Allelic diversity in Sphagnum ×falcatulum Karlin and Smouse
1
2 Changes in hologenomic structure
3 The large majority (109/138) of the S. ×falcatulum individuals in this study, including all of the
4 Tasmanian (15) and 92 (out of 97) NZ individuals, had [ H WI (R,S,T) = 0.914 ⇔ µ W (R,S,T) I =
5 2.49 alleles ] per average trio. As this value represents the holoploid ‘founding’ H WI , there
6 appears to have been no change in allotriploid hologenomic structure in these individuals, at least
7 for these markers. The remaining 29 individuals sampled in this study, representing all of the
8 TdF individuals and the remaining 5 NZ individuals, had [ Η WI (R,S,T) = 0.833 ⇔ µ WI (R,S,T)
9 = 2.30 ], indicative of a change in hologenomic structure. All 24 of the TdF individuals lacked
10 the (22R) allele, and four of the five South Island individuals, all ramets of one clonal lineage,
11 lacked the (22S) allele instead. The fifth South Island individual (EK498) lacked (12S). These
12 changes for markers (22 and 12) reflect post-hybridization evolution in the hologenomic
13 structure S. ×falcatulum over evolutionary time and geographic space. It is also possible that the
14 change in hologenomic structure occurred in S. ×irritans and was directly inherited by
15 S.×falcatulum, via one of its multiple origins.
16 Allelic Information and Diversity in the Immediate Ancestors
17 Allelic information and diversity in the two immediate progenitors of S. ×falcatulum, the South
18 Island population of S. ×irritans (R’ and S’) and the Queensland population of S. cuspidatum
19 (T’) revealed three major points. (a) Total information and diversity within each of the
20 homeologs (R’, S’, T’) were comparable to those detected within S. × falcatulum (R, S, T) (Table
21 2). We find [ H WS (T' ) ⇔ σ WS (T' ) ] < [ H WS (R' ) ⇔ σWS (R' ) ] < [ H WS (S' ) ⇔ σWS (S' ) ], so the
22 pattern we see today in S. ×falcatulum was probably established via the initial hybridization
23 event(s). (b) There were no R’ alleles for these five markers in S. ×irritans or T’ alleles in S.
17Allelic diversity in Sphagnum ×falcatulum Karlin and Smouse
1 cuspidatum that were not also present in S. ×falcatulum, but there were two S’ alleles in S.
2 ×irritans that have not been detected within S. ×falcatulum. (c) Divergence between each
3 monoploid genome in S. ×falcatulum and its ancestral progenitor was slight (Table 5).
4 Collectively, the data suggest that the majority of the allelic information and diversity associated
5 with the markers in the two immediate progenitor species was captured by S. ×falcatulum, almost
6 surely via repeated hybridization. In addition, [ H WI = 0.689 ⇔ µ WI = 1.99 ] in S. ×irritans,
7 representing 66% of H WS . All (but one) individual of S. ×irritans had the ‘founding’ H WI = 2.00
8 at these markers. The one exception lacked the allele for (1R) and had [ H WI = 0.555 ⇔ µ WI
9 =1.74 ].
10 A comparison of the partition of information in the New Zealand regional collections of
11 S. ×falcatulum and S. ×irritans is shown in Fig. 4. Total holoploid information H WR (R,S,T) in S.
12 ×falcatulum was slightly higher than H WI (R’S’) in S. ×irritans. However, H WI (R,S,T) in S.
13 ×falcatulum was much greater than H WI (R’,S’) in S. ×irritans, while holoploid H AP and H AI
14 contributed a much larger portion of the total information in S. ×irritans than in S. ×falcatulum.
15 [ Table 5 – about here ]
16 DISCUSSION
17 Allelic Information and Diversity Capture from Progenitors
18 There is considerable diversity (divergence) among the monoploid genomes contributing to S.
19 ×falcatulum, as captured subsequently in its current information and diversity. For these five
20 markers, divergence among monoploid genomes (represented by H WI and µ WI here) was by far
21 the major source of allelic diversity in S.×falcatulum. Large differences in allelic information
22 and diversity within the (R,S,T) homeologs are emblematic of the fact that multiple origins and
23 ploidy-level changes have played a large role in the evolution of S. ×falcatulum. Recurrent
18Allelic diversity in Sphagnum ×falcatulum Karlin and Smouse
1 hybridization has evidently increased allelic diversity within both R and S homeologs, but it has
2 not increased the allelic novelty within T. These patterns suggest recurrent hybridization between
3 a genetically depauperate haploid T’ progenitor (S. cuspidatum) and an allodiploid R’ and S’
4 progenitor (S. ×irritans), containing genetically diverse monoploid genomes. The pattern of
5 allelic information and diversity detected in the two latter species supports this hypothesis.
6 In turn, the large difference in allelic diversity between the R genomes and the S genomes in S.
7 ×irritans strongly suggests recurrent hybridization between S. ×irritan’s (monoploid) ancestors,
8 with the ancestor contributing genome S’ harboring greater internal genetic diversity than the
9 ancestor contributing R’) Our results show that the frequency of hybridization between divergent
10 progenitors, plus the diversity within each of the participants, can be expected to influence both
11 the monoploid and the holoploid allelic diversity within allopolyploid derivative species, with
12 diverse ancestors leaving separable signatures. In the case of S. ×falcatulum, the addition of
13 monoploid genome T increased holoploid µ WI , but decreased holoploid β AP and λ ΑΙ .
14 We conclude that the large majority of genetic information and diversity contained within
15 these five markers in S. ×falcatulum were ‘captured’ directly from the ancestral progenitors, via
16 serial and recurrent hybridization. Clearly, a trio of monoploid ancestors introduced novelty into
17 S. ×falcatulum, with monoploid S contributing the most diversity and T the least. A small
18 number of subsequent mutations and changes in hologenomic structure have also contributed to
19 genetic diversification within S. ×falcatulum. Given its relatively recent origin (Karlin et al.,
20 2013), the current genetic information and diversity within each of the three homeologous
21 genomes in S. ×falcatulum largely reflects the intense filtering of alleles associated with two
22 serial rounds of recurrent reticulation, the first round giving rise to S. ×irritans and the second
19Allelic diversity in Sphagnum ×falcatulum Karlin and Smouse
1 yielding S. ×falcatulum. However, our data show only slight subsequent divergence between S.
2 × falcatulum and its two immediate progenitors.
3 Post Reticulate Innovation
4 de novo alleles
5 As the data sets for each progenitor species were small, separating ancestral from de novo alleles
6 was inevitably a bit tentative. We note, however, that the numbers of de novo alleles per locus
7 (within S. ×falcatulum) were comparable among the three monoploid genomes (Table 2),
8 suggesting the appearance of (post hybridization) allelic novelty, rather than representing alleles
9 captured via hybridization. It is possible, of course, that at least some of these putative de novo
10 alleles, not currently detectable in immediate progenitors, were introduced via hybridization.
11 While more elaborate sampling of the progenitors may eventually provide additional evidence
12 for or against this interpretation, the data in hand argue for post establishment generation of at
13 least some genetic novelty.
14 Change in hologenomic structure
15 The hologenomic structure in S. ×falcatulum based on these five markers has been relatively
16 stable, both within and across regions, and there appears to have been little change in the balance
17 among monoploid genomes, in spite of multiple origins. But some hologenomic change has
18 occurred, either in S ×irritans (subsequently inherited by S. ×falcatulum) or post-origin, within
19 S. ×falcatulum. The clonal nature of gametophytic Sphagnum allows such changes to replicate
20 with fidelity and to persist for extensive periods of time (Karlin et al., 2012). If a single
21 individual exhibits loss of a particular allele, that might represent no more than a non-amplifying
22 (null) allele in that individual. But when several individuals from a single clonal lineage (or an
23 entire population) lack the allele, absence probably represents a change in holoploid genomic
20Allelic diversity in Sphagnum ×falcatulum Karlin and Smouse
1 structure. The strongest evidence of hologenomic loss was associated with TdF population. The
2 evidence for hologenomic change in S.×irritans was ambiguous, as all individuals but one had
3 the ‘founding’ H WI (R’,S’) = 0.693.
4 Regional vs subregional diversification
5 Based on five ancestrally indicative markers, allelic divergence for S. ×falcatulum was slight
6 among these three highly disjunct Holantarctic regions, and also low among populations within
7 those regions. Indeed, divergence among individuals within populations (H AI ) exceeded
8 divergence among regions (H AR ). However, in spite of the low regional divergence, markedly
9 different patterns of holoploid allelic information and diversity occurred among individuals
10 within NZ [ H AP (NZ) + H AI (NZ) ] compared with those in Tas and TdF. The lack of information
11 among individuals within the five sets of three homeologous trios for each of the Tas and TdF
12 regions clearly indicates that their respective histories differ greatly from that associated with
13 NZ. Given the stability of the alleles at these five markers, H AI (NZ) > 0 indicates that at least
14 two genets are present in at least some NZ populations. Likewise, H AP (NZ) > 0 indicates that
15 there are at least frequency differences among genets for different NZ populations. In stark
16 contrast, our data show no evidence supporting the occurrence of more than one genet in either
17 Tas or in TdF. This possibility is supported by the frequent occurrence of sexual reproduction in
18 NZ, and its virtual absence from TdF and from Macquarie Island (Karlin et al., 2013). The
19 occurrence of a sporophyte on only one Tasmanian herbarium specimen suggests that there may
20 be more than one genet present on that island, but we see no evidence of that in our limited Tas
21 samples. Additional study is required to fully explore this question. Our data indicate that NZ
22 was the probable source region and that TdF and Tas represent later colonizations by one or a
23 few propagules each. Sphagnum ×falcatulum’s capacity for long distance dispersal, its
21Allelic diversity in Sphagnum ×falcatulum Karlin and Smouse
1 unisexuality, and its clonal nature allow for the development of populations, even at the regional
2 level, within which there is no divergence among individuals, based on these five markers.
3 Although a young species, S. ×falcatulum has managed to span much of the Holantarctic, more
4 or less clonally.
5 Appropriate statistical analysis for allopolyploids
6 With two or more homeologous loci per marker, allopolyploids have a greater genetic potential
7 than that found in diploids (or haploids in the case of bryophytes). Based on the five markers
8 used in this study, the majority of this genetic potential in both S. ×falcatulum and S. ×irritans,
9 and likely other allopolyploids having highly divergent monoploid genomes, occurs within
10 individuals, and not among individuals. Thus it becomes important to consider H WI in the
11 context of (a) how much genetic novelty is present within the species, (b) where it is localized;
12 and (c) how it is bundled. Finally, changes in H WI may signal changes in hologenomic structure.
13 We conclude that it is particularly valuable to elucidate H WI (and µ WI ) when studying
14 allopolyploids.
15 Meirmans and Van Tienderen (2013) note that subgenomes (homeologous monoploid
16 genomes) should be analyzed as separate loci when strict disomic inheritance occurs in
17 allopolyploids. That approach was utilized by the first author in two previous studies of
18 Sphagnum allopolyploids, one on the allo-diploid S. ×palustre (Karlin et al., 2012) and one on S.
19 ×falcatulum (Karlin et al., 2013). However, focusing solely on allelic information and diversity
20 among alleles for the constituent homeologous loci misses the larger, and perhaps more
21 important story. Although accommodating ‘among individual’ comparisons, the ‘separate loci’
22 approach ignores the fact that allelic diversity among homeologous loci (represented by H WI and
22Allelic diversity in Sphagnum ×falcatulum Karlin and Smouse
1 µ WI in S. ×falcatulum and S. ×irritans) may represent the bulk of allelic information and
2 diversity resident within many allopolyploid species.
3 Concluding Thoughts
4 As shown here, Shannon information and diversity measures provide a powerful and effective
5 approach to the study of allelic diversity at many levels (Sherwin et al., 2006). Even when
6 applied to a genetically complex species, Shannon analysis yields an interconnected and
7 seamless link from the allelic diversity within individuals to that present within and among
8 regions.
9 This study focused on five markers that facilitated comparison of allelic diversity
10 captured from multiple origins with that emerging from post-hybridization within S. ×falcatulum
11 itself. Although such stable markers are often overlooked by studies focused on one species, we
12 show that they can be quite informative about the evolutionary history of allopolyploids. SSR
13 markers which are evolutionarily more labile, and thus unsuitable for this study, would be
14 expected to provide a different perspective on the allelic information and diversity in S.
15 ×falcatulum, notably the recent history of these same populations and regions. Analyses of the
16 nine other SSR markers which have been sampled from this same material are currently
17 underway. It will prove challenging (but nevertheless) informative to compare the information
18 and diversity of those more labile markers with those found for the highly stable markers used
19 here, and we expect to ‘flesh out the story’.
20
21 SUPPLEMENTARY DATA
22 Supplementary data are available online at www.aob.oxfordjournals.org and consist of the
23 following. Table S1: Voucher data for Sphagnum ×falcatulum, S. ×irritans, and S. cuspidatum.
23Allelic diversity in Sphagnum ×falcatulum Karlin and Smouse
1 Table S2: Allelic data for Sphagnum ×falcatulum, S. ×irritans, and S. cuspidatum at five
2 ancestrally indicative markers. Table S3: Data sheet showing format for triploid analysis of the
3 Tasmanian hologenomic data in GenAlEx. Table S4: Results of Shannon analysis of the
4 Tasmanian triploid data using the ‘Partition’ option.
5
6 ACKNOWLEDGMENTS
7 DNA extraction and analysis was done at The Shaw Bryology lab at Duke University and we
8 thank Jonathan Shaw for the use of the lab and Sandra Boles for help with the lab work. Allelic
9 data for one individual of S. ×irritans was provided by the lab of Sean Robinson (State
10 University of New York). PES was supported by USDA/NJAES-17111 and 17160. We
11 appreciate the constructive comments provided by the anonymous reviewers and the Handling
12 Editor (Anne Brysting).
13 LITERATURE CITED
14 Andrews AL. 1949. Studies in the Warnstorf Sphagnum herbarium V. The Group Cuspidata in
15 South America. Bryologist 52: 124–130.
16 Beever J, Allison KW, Child J. 1992. The moss flora of New Zealand. 2nd edn. Dunedin:
17 University of Otago Press.
18 Catcheside DG. 1980. Mosses of South Australia. Handbook of the flora and fauna of South
19 Australia. South Australia: Government Printer.
20 Chester M, Gallagher JP, Symonds VV, da Silva AVC, Mavrodiev EV, Leitch AR, Soltis
21 PS, Soltis DE. 2012. Extensive chromosomal variation in a recently formed natural
24Allelic diversity in Sphagnum ×falcatulum Karlin and Smouse
1 allopolyploid species, Tragopogon miscellus (Asteraceae). Proceedings of the Natural
2 Academy of Sciences 109: 1176–1181.
3 Chester M, Riley RK, Soltis PS, Soltis DE. 2015. Patterns of chromosomal variation in natural
4 populations of the neoallotetraploid Tragopogon mirus (Asteraceae). Heredity 114: 309–317.
5 Feldman M., Levy A., Chalhoub B., Kashkush K. 2012. Genomic plasticity in polyploid
6 wheat. In: Soltis PS, Soltis, DE (eds.), Polyploidy and Genome Evolution. Springer-Verlag
7 Berlin Heidelberg. DOI: 10.1007/978-3-642-31442-1_7
8 Fife AJ. 1996. A synopsis of New Zealand Sphagna, with a description of S. simplex sp. nov.
9 New Zealand Journal of Botany 34: 309–328.
10 Greilhuber J, Doležel J, Lysák MA, Bennett MD. 2005. The origin, evolution and proposed
11 stabilization of the terms ‘genome size’ and ‘C-value’ to describe nuclear DNA contents.
12 Annals of Botany 95: 255–260.
13 Jost L. 2006. Entropy and diversity. Oikos 113: 363–375.
14 Jost L. 2007. Partitioning diversity into independent alpha and beta components. Ecology 88:
15 2427–2439.
16 Jost L. 2010. Independence of alpha and beta diversities. Ecology 91: 1969–1974.
17 Karlin EF. 2014. Subgenome analysis of two Southern Hemisphere allotriploid species in
18 Sphagnum (Sphagnaceae). Journal of Bryology 36, 165–179.
19 Karlin, EF, Boles SB, Shaw AJ. 2008. Systematics of Sphagnum section Sphagnum in New
20 Zealand: a microsatellite-based analysis. New Zealand Journal of Botany 46: 105–118.
21 Karlin, EF, Boles SB, Seppelt RD, Terracciano S, Shaw AJ. 2011. The peat moss Sphagnum
22 cuspidatum in Australia: microsatellites provide a global perspective. Systematic Botany 26:
23 22–32.
25Allelic diversity in Sphagnum ×falcatulum Karlin and Smouse
1 Karlin, EF, Boles SB, Ricca M, Temsch E, Greilhuber J, Shaw AJ. 2009. Three-genome
2 mosses: complex double allopolyploid origins for triploid gametophytes in Sphagnum.
3 Molecular Ecology 18: 1439–1454.
4 Karlin EF, Buck WR, Seppelt RD, Boles SB, Shaw AJ. 2013. The double allopolyploid
5 Sphagnum ×falcatulum (Sphagnaceae) in Tierra del Fuego, a Holantarctic perspective.
6 Journal of Bryology 36: 165–179.
7 Karlin, EF, Hotchkiss SC, Boles SB, Stenøien HK, Hassel K,, Flatberg KJ, Shaw AJ. 2012.
8 High genetic diversity in a remote island population system: sans sex. New Phytologist 193:
9 1088–1097.
10 Karlin EF, Robinson SC. 2016. Update on the Holantarctic Sphagnum ×falcatulum s.l.
11 (Sphagnaceae) complex: S. irritans is associated with the allo-diploid plants. Journal of
12 Bryology. http://dx.doi.org/10.1080/03736687.2016.1218674.
13 Karlin, EF, Temsch EM, Bizuru E, Marino J, Boles SB, Devos N, Shaw AJ. 2014. Invisible
14 in plain sight: recurrent double allopolyploidy in the African Sphagnum ×planifolium
15 (Sphagnaceae). The Bryologist 117: 187–201.
16 Marcussen T, Sandve1 SR, Heier L, Spannagl M, Pfeifer M, The International Wheat
17 Genome Sequencing Consortium, Jakobsen KS, Wulff BHH, Steuernagel B, Mayer
18 KFH, et al. 2014. Ancient hybridizations among the ancestral genomes of bread wheat.
19 Science 345: DOI: 10.1126/science.1250092.
20 Mason-Gamer RJ, Burns MM, Naum M. 2010. Phylogenetic relationships and reticulation
21 among Asian Elymus (Poaceae) allotetraploids: Analyses of three nuclear gene trees.
22 Molecular Phylogenetics and Evolution 54: 10–22.
26Allelic diversity in Sphagnum ×falcatulum Karlin and Smouse
1 Meirmans PG, Van Tienderen PH. 2013. Statistical challenges for population genetics of
2 polyploids: The effects of inheritance in tetraploids on genetic diversity and population
3 divergence. Heredity 110\: 131–137.
4 Peakall R, Smouse PE. 2006. GENALEX 6: genetic analysis in Excel. Population genetic
5 software for teaching and research. Molecular Ecology Notes 6: 288–295.
6 Peakall R, Smouse PE. 2012. GenAlEx 6.5: genetic analysis in Excel. Population genetic
7 software for teaching and research - an update. Bioinformatics 28, 2537–2539.
8 Sainsbury G.K. 1955. A handbook of New Zealand mosses. Bulletin of the Royal Society of
9 New Zealand 5: 1–490.
10 Såstad SM. 2005. Patterns and mechanisms of polyploid speciation in bryophytes. In: Plant
11 Species Level Systematics: New Perspectives on Pattern and Process (eds Bakker T, Chatrou
12 Gravendeel B, Pelser P), pp. 317–333. Gantner Verlag, Ruggell, Liechtenstein.
13 Scott GAM, Stone IG, Rosser C. 1976. The mosses of southern Australia. London: Academic
14 Press.
15 Seppelt RD. 2012. Australian Mosses Online 52. Sphagnaceae. Australian Biological Resources
16 Study, Canberra. Version 22 June 2012. .http://www.anbg.gov.au/abrs/Mosses_online/ 52_
17 Sphagnaceae.html. [accessed 10 August 2016].
18 Shaw AJ, Cao T, Wang L-S, Flatberg KI, Flatberg B, Shaw B, Zhou P, Boles SB,
19 Terraccino S. 2008. Genetic variation in three Chinese peat mosses based on microsatellite
20 markers, with primer information and analysis of ascertainment bias. The Bryologist 111:
21 271–281.
22 Shaw AJ, Cox CJ, Boles SB. 2003. Polarity of peatmoss (Sphagnum) evolution: who says
23 mosses have no roots? American Journal of Botany 90: 1777–1787.
27Allelic diversity in Sphagnum ×falcatulum Karlin and Smouse
1 Shaw AJ, Cox CJ, Buck WR , Devos N , Buchanan AM , Cave L , Seppelt R , Shaw B,
2 Larrain J, Andrus R et al. 2010. Newly resolved relationships in an early land plant
3 lineage: Bryophyta class Sphagnopsida (peat mosses). American Journal of Botany 97:
4 1511–1531.
5 Shaw AJ, Devos N, Liu Y, Goffinet B, Cox CJ, Faltberg KI, Shaw B. 2016. Organellar
6 phylogenomics of an emerging model system: Sphagnum (peat moss). Annals of Botany
7 doi:10.1093/aob/mcw086.
8 Sherwin WB. 2010. Entropy and information approaches to genetic diversity and its expression:
9 genomic geography. Entropy 12: 1765–1798.
10 Sherwin WB, Jobot F, Rush R, Rossetto M. 2006. Measurement of biological information with
11 applications from genes to landscapes. Molecular Ecology 15: 2857–2869.
12 Smouse PE, Ward RH. 1978. A comparison of the genetic infrastructure of the Ye'cuana and
13 the Yanomama: a likelihood analysis of genotypic variation among populations. Genetics 88:
14 611–631.
15 Smouse PE, Whitehead MR, Peakall R. 2015. An informational diversity analysis framework,
16 illustrated with sexually deceptive orchids in early stages of speciation. Molecular Ecology
17 Resources 15: 1375–1384.
18 Soltis, DE, Buggs RJA, Doyle JJ, Soltis PS. 2010. What we still don't know about polyploidy.
19 Taxon 59: 1387–1403.
20 Symonds VV, Soltis PS, Soltis DE. 2010. Dynamics of polyploid formation in Tragopogon
21 (Asteraceae): recurrent formation, gene flow, and population structure. Evolution 64: 1984–
22 2003.
28You can also read


