American Scientist A reprint from
←
→
Page content transcription
If your browser does not render page correctly, please read the page content below
A reprint from

                            American Scientist
                           the magazine of Sigma Xi, The Scientific Research Society

This reprint is provided for personal and noncommercial use. For any other use, please send a request to Permissions,
American Scientist, P.O. Box 13975, Research Triangle Park, NC, 27709, U.S.A., or by electronic mail to perms@amsci.org.
©Sigma Xi, The Scientific Research Society and other rightsholders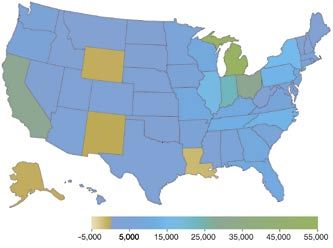
Fuel Efficiency and the Economy
Input-output analysis shows how proposed changes to automotive
fuel-efficiency standards would propagate through the economy
Roger H. Bezdek and Robert M. Wendling
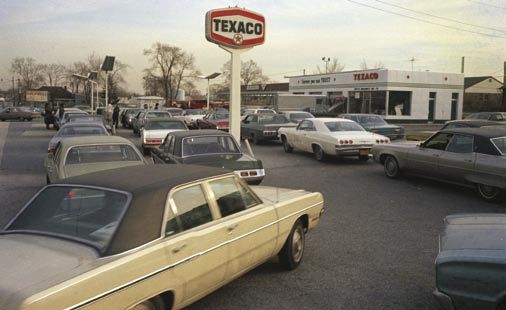
I n the fall of 1973, a new phrase en-
tered the American lexicon: “energy
crisis.” On October 17 of that year, the
share as thirty years ago. Much of that
oil still comes from the Middle East, a
region that has become no more stable.
(chiefly carbon dioxide) by 30 percent
before 2016. Unlike carbon monoxide
and other pollutants, carbon dioxide
Organization of Petroleum Exporting The toppling of the Shah of Iran in cannot be eliminated by add-on tech-
Countries (OPEC) slapped an embargo 1978 precipitated a second energy cri- nology like catalytic converters; it can
on oil exports, hoping to punish the sis that winter. In 1981, the cost of gas be reduced only by cutting fuel con-
United States for its support of Israel at the pump reached its highest levels sumption. The fate of California’s rules
in the Six Days’ War. ever (nearly $3.00 in inflation-adjusted will probably be played out in court,
Although the embargo lasted only dollars). Prices moderated over the fol- as auto manufacturers argue that the
five months, its effect on the U.S. econ- lowing decades, but the terrorist at- state has tried to bring in fuel-economy
omy was profound. Long lines of cars tacks of September 11, 2001, and the standards through the back door.
became commonplace at filling sta- ensuing wars in Afghanistan and Iraq How much fuel would the nation
tions, and gas rationing reared its head have once again called into question save by enacting standards like the ones
for the first time since World War II. No the security of U.S. oil supplies. in California or the ones voted down in
less profound was the impact of the Each of these episodes has led to 2002? Would the stiffer requirements
embargo on the popular psyche. For talk of toughening the fuel-economy harm the economy? Would they really
the first time, most Americans awak- standards enacted in 1975. Most re- cost thousands of workers their jobs?
ened to the fact that they were depen- cently, a bill that senators John Kerry Over a period of 30 years, first with the
dent on oil from abroad—and not just and John McCain sponsored in 2002, Department of Commerce and then
from anywhere, but from one of the which would have raised the overall as independent consultants, we have
most politically volatile regions in the gas efficiency of American cars and developed a quantitative model of the
world. Recognizing the danger, Con- trucks by nearly 30 percent over the economy that is ideally suited to answer
gress passed a variety of belt-tightening next 10 years, failed to pass when 19 such questions. We have employed this
laws, including the Energy Policy and Democrats joined 43 Republicans in model in the past for analyzing the cost
Conservation Act of 1975, which set up voting against it. Whereas environ- and benefit of national acid-rain legisla-
mandatory fuel-efficiency standards mentalists asserted that higher fuel- tion, and for gauging the contribution
for automobile manufacturers. economy standards were needed to of the environmental industry to the
Although the nation has become reduce gasoline consumption and U.S. economy, among others uses. Our
much more efficient in its use of energy emission of greenhouse gases, the auto latest application of this model brings
since the 1970s, it nonetheless imports industry and labor unions argued that some good news: Fuel efficiency can go
60 percent of its oil, twice as large a these requirements would drastical- hand in hand with job growth.
ly increase the price of new cars and
Roger H. Bezdek is president of Management put hundreds of thousands of people CAFE: One Lump or Two?
Information Services, an economic-research firm. out of work. The labor unions’ argu- When the energy crisis hit America in
He received his Ph.D. in economics from the Uni- ments—and their well-attended ral- 1973, the fuel efficiency of the average
versity of Illinois at Urbana-Champaign in 1971 lies—proved to be particularly persua- U.S. passenger car had fallen to less
and has worked in academia and for the federal sive for the Democratic legislators. than 13 miles per gallon (mpg). The
government. Robert M. Wendling is vice president Although fuel-economy standards Energy Policy and Conservation Act of
of Management Information Services. He received have not changed significantly in 1975 instituted a new Corporate Aver-
a master’s degree in economics from George Wash-
20 years at the federal level, another age Fuel Economy (CAFE) program,
ington University in 1977. He has served as senior
economist at the U.S. Department of Commerce,
player recently entered the debate. which required automobile manufac-
program manager at the U.S. Department of Ener- This fall, California, the only state turers to more than double the efficien-
gy and director of the Department of Commerce's with legal authority to regulate vehicle cy of the cars they sold. The increase
STAT-USA office. Address: Management Informa- emissions, instituted new rules that was phased in over several years: For
tion Services, Inc., 2716 Colt Run Road, Oakton, would require auto manufacturers to the 1978 model year, the standard for
VA 22124. Internet: info@misi-net.com reduce the output of greenhouse gases passenger cars was set at 18 mpg, and
© 2005 Sigma Xi, The Scientific Research Society. Reproduction
132 American Scientist, Volume 93
with permission only. Contact perms@amsci.org.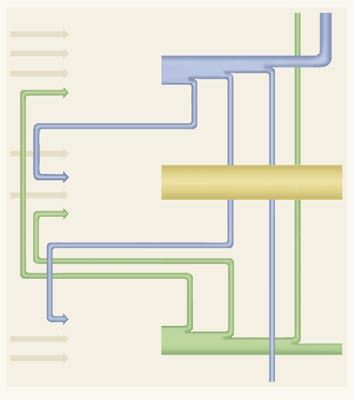
Associated Press
Figure 1. Long lines at the gas pump and odd- and even-numbered-day gas rationing were unpleasant facts of life for Americans in the winters
of 1973–74 and 1978–79. These energy crises motivated Congress to pass legislation requiring better fuel mileage for new vehicles, standards
that got progressively tougher from 1978 to 1985. But requirements have not changed since then, in large part because some fear that the impo-
sition of stricter standards would cost jobs. The authors shed light on this issue by modeling various scenarios and predicting their economic
consequences for the future.

it gradually increased to 27.5 mpg by           CAFE regulations, coupled with a dra-            reclassify the vehicle as a light truck,
1985, the same level as today.                  matic shift in the tastes of car buyers.         thus exempting it from the stricter stan-
   The new regulations had exactly              The CAFE standards treated “light                dards for passenger cars.
the intended effect. The fuel efficiency        trucks” differently, and more leniently,
of new passenger cars rose rapidly              than passenger automobiles. Such ve-             Not Beyond the Horizon
during the late 1970s and reached a             hicles were considered to be primarily           In 2002, the National Research Council
plateau in the early ’80s. Around this          for commercial use (though even by the           (NRC), an arm of the National Acad-
time, car manufacturers had gotten              late 1970s, two-thirds or more of them           emy of Sciences, published a landmark
close enough to the target of 27.5 mpg          served as passenger carriers). Therefore         study of the CAFE standards. The NRC
that they could concentrate their ef-           the CAFE standard for light trucks was           analyzed technical, safety and related
forts instead on improving engine per-          set at 20.7 mpg, where it has remained           aspects of the CAFE requirements and
formance. Beginning in 1982, while the          through the 2004 model year. (It will            estimated how a variety of feasible
mileage leveled off, the average accel-         increase to 22.2 mpg by 2007.)                   technologies would affect vehicle costs.
eration time from 0 to 60 mph (a mea-              In 1976, shortly after the passage            We have relied heavily on that NRC re-
sure of performance) began to improve           of the CAFE legislation, sales of light          port to develop realistic scenarios for
steadily. The manufacturers also used           trucks amounted to less than 20 percent          toughening the CAFE standards. Al-
advances in technology to “buy” addi-           of all light vehicle sales. But thanks to        though over the years there have been
tional vehicle weight. That is, instead         the boom in sport-utility vehicles in the        other studies of the effects of CAFE on
of continuing to increase the mileage of        1990s, the light truck category—which            the national economy, ours is the first
their fleet, they kept the fuel efficiency      includes pickups, minivans, SUVs,                major research effort that was able to
just above the legal requirement and            mini-SUVs and even certain “cross-               draw on such a detailed and thorough
gave the American car market what it            over” vehicles like the Chrysler PT              investigation of the costs of potential
really wanted: bigger, faster cars.             Cruiser—now accounts for nearly 50               improvements in gas mileage.
   However, in recent years an unex-            percent of all new sales. Manufacturers              The most important finding in the
pected thing has happened: The aver-            have also taken advantage of the strict          NRC report is that the technology to
age fuel economy for all new vehicles           wording in the law. By simply mak-               achieve major increases in fuel efficiency
has declined, from a peak of 26.2 mpg           ing the rear seats removable in what             is not somewhere over the rainbow, nor
in 1987 to 24.7 mpg for model year              most of us would consider a personal             is it dependent on future research break-
2004. The reason is a loophole in the           passenger vehicle, a manufacturer can            throughs. It exists today. The NRC iden-

                                          © 2005 Sigma Xi, The Scientific Research Society. Reproduction
www.americanscientist.org                                                                                           2005 March–April      133
                                                with permission only. Contact perms@amsci.org.
�� ���
���
��������
��
����������������
����� ��
��
��������������������������������
���
��
�� ��� ���
��
�� �����
����������������������
��
���
���������������
������������
�����
�����
�� ���
��
�����
��� ���
������
������
� ����� �
���� ���� ���� ���� ���� ���� ���� ���� ���� ���� ���� ���� ���� ����
���������� ����������
Figure 2. Fuel economy is a multidimensional problem, involving trade-offs of vehicle weight, engine performance and vehicle type. The introduc-
tion of the Corporate Average Fuel Economy (“CAFE”) program produced rapid gains in fuel economy of cars and trucks through 1985 (left, top).
Since then, the mileage of both classes has stayed level and slightly above the federal targets (light blue). However, since 1987 the combined mileage ����
for cars and trucks (green) has declined because of the increasing popularity of sport-utility vehicles (SUVs, right), which are classified as light trucks. ���
Since the early 1980s, automobile manufacturers have also chosen to use advances in engine technology to improve engine performance (lower left,
green) and to power heavier cars (lower left, blue) instead of improving gasoline mileage. (Source: U.S. Environmental Protection Agency). �
tified more than two dozen technologies, scenarios, corresponding to different on the fuel-efficiency gains possible
many of which it labeled as “production levels of governmental intervention. We from current or upcoming technolo- ����������������
intent.” That is, ��
they are already avail- based these three hypothetical futures gies. It assumes that “emerging tech-
able, are well known to manufacturers on the NRC report, which ensured that nologies” likely to be available by 2015
and their suppliers, and can be incor- they were feasible in terms of technol- are implemented. CAFE standards are
porated into vehicles as soon as a deci- ogy, economics and timing. Indeed, we increased by 30 percent in 2010—for
sion is made to use them. Some of these were motivated in part by the appear- cars from 27.5 to 35.8 mpg and for light
technologies have been used in certain ance of the NRC study, as well as our trucks from 20.7 mpg to 26.9. By 2015,
makes for years. The NRC also identified desire to provide hard data to inform the standards rise by 50 percent, to
a smaller number of “emerging technol- the contentious CAFE debate. 41.3 mph for cars and 31 mpg for light
ogies,” ones that are beyond the research The base-case scenario (“business as trucks. The changes are phased in be-
phase and could be produced widely usual”) assumes no change in CAFE tween 2005 and 2015 and remain at the
�
within 10 to 15 years.
���� Only
���� two of the
���� ���� standards and no increase in fleet gas same levels through 2030. In this sce-
technological improvements discussed mileage. It retains the current distinc-
���������� nario, average vehicle prices increase
by the NRC (fuel-cell vehicles and series tion between cars and “light trucks.” by about $2,700 (12 percent).
hybrids) lie beyond the 15-year horizon, Under this scenario, we assume that We believe that these sorts of gains
and we did not assume any contribution average fleet fuel economy remains in fuel economy are feasible and cred-
from them in our economic model. For constant through 2030. ible. They derive from published en-
each technology, the NRC identified its Our second version of the future, gineering studies and rely on innova-
likely cost to the consumer and estimat- which we call the “moderate” sce- tions that are either currently available
ed the percentage improvement in fuel nario, assumes that CAFE-mandated or well into research and development.
economy that it could achieve. There is fuel economy increases by 20 percent Neither of our scenarios requires de-
no free lunch here: Everything on the as of 2010, for cars from 27 mpg to 33 velopment of fundamentally “new”
menu comes at a price, from as little as mpg and for light trucks from 20.7 vehicles or exotic technologies. Even
$8 for low-friction lubricants (a 1-percent mpg to 24.8 mpg. These increases are our advanced scheme is less ambitious
improvement in fuel mileage) up to as phased in from 2005 to 2010 and re- than the original CAFE timetable,
much as $560 for a “camless engine” (an main at those levels through 2030. We which mandated a 53-percent increase
emerging technology that would save 5 assume that the lowest-cost, currently (from 18 mpg to 27.5 mpg) in just sev-
to 10 percent in fuel mileage). available fuel-efficiency technologies en years, from 1978 to 1985.
Would it help Americans overall if are implemented (an economically Our two scenarios are comparable
the government required the higher fuel reasonable assumption) and that the with the proposals that were debated
efficiency these technologies make pos- average vehicle prices increase by in Congress in 2002, as well as with the
sible? To estimate the consequences of $700 (3 percent). target set this year by the California Air
changes in CAFE standards, we mod- Finally, our third version, the “ad- Resources Board (CARB). The moder-
eled the economic outcomes of three vanced” scenario, pushes the envelope ate scenario is less ambitious than all of
© 2005 Sigma Xi, The Scientific Research Society. Reproduction
134 American Scientist, Volume 93
with permission only. Contact perms@amsci.org.������������������
������������������������� ������������������������
������������������� ��������������������� �������������������������
������������������������������������� � � � � � � � � � � �� � ��� ��� ��� ��� �����
����������������������������������������������������������������
������������������������������������������������
��������������������������������������������
���������������������
������������������������������
���������������������
����������������������������
�����������������������������������
����������������������������
�����������������������
��������������������������
�����������������������
�������������������������
�������������������������������������������
����������������������������������
���������������������������������
����������������������������������
�����������������������������������
�������������������������������������������
��������������������������������������������������
��������������������������������
��������������������
��������������������������������������
���������������������������������������������
���������������������������
�����������������������������
�������������������������
�����������������������������������������������
�����������������������
������������������������������������
Figure 3. In 2002, the National Research Council (NRC) identified many technologies that could be used to further improve fuel efficiency. These
technologies were divided into two categories: “production-intent” (already suitable for use in mass-produced vehicles) and “emerging technologies”
(expected to be ready for mass production within 10 years). The authors’ economic model uses these estimates as inputs for two different scenarios,
one with moderate increases in the CAFE standards and one with larger increases that would require deployment of some emerging technologies.
these regulatory solutions, whereas the though the CARB regulations only set other low-hanging fruit. By contrast,
advanced scenario is more ambitious. a target for the emission of greenhouse we are now talking about improving
For example, Ernest Hollings, the gases, they would effectively force au- engines and drivetrains that have al-
South Carolina Democrat who chaired tomakers to improve the mileage of ready undergone 30 years of optimiza-
the Senate Commerce Committee, pro- their passenger cars sold in California tion. Advances will be hard-earned.
posed raising the CAFE standard for by 30 percent, to 36 mpg, by 2015. And both scenarios will require man-
passenger cars and light trucks to 37 By comparing our scenarios with ufacturers to produce vehicles that
mpg by 2014; John McCain, the rank- present and past proposals, we do not they would not otherwise choose to
ing Republican on that committee, mean to imply that the changes will be make. Consumers will have to accept
proposed 36 mpg by 2016; and McCain painless. The original CAFE enhance- these same vehicles, and pay more for
and Kerry’s bipartisan proposal called ments were obtained by relatively easy them up front (the savings come later
for a standard of 35 mpg by 2015. Al- weight reductions and by plucking as drivers pay less for fuel). Even so,
© 2005 Sigma Xi, The Scientific Research Society. Reproduction
www.americanscientist.org 2005 March–April 135
with permission only. Contact perms@amsci.org.solenoid
coil
belt
magnet
“variator”
valve
Figure 4. Automobile manufacturers are exploring and in some cases have already begun introducing technologies identified in the NRC report.
Continuously variable transmission (left) in the Audi A6 features a “variator” with a wide interlinked chain passing over it. As the plates of the
variator move together or apart, the radius of the chain on both ends—and therefore the gear ratio—changes in a smooth, continuous fashion. An
emerging engine technology is camless valve actuation (center), shown here in a prototype configuration that uses solenoids to open and close
the intake and exhaust valves. (In conventional engines, valves are controlled by a rotating cam shaft, which cannot adapt to changing engine
conditions.) The Honda Accord Hybrid includes an integrated starter-generator (right), which allows the gasoline engine to shut down at stop-
lights instead of wasting gas while idling. (Image at left courtesy of Audi AG; one at right courtesy of Honda Motor Co., Ltd.)
the standards will require a decade or ontief (1906–1999), a student of this bureau would determine the targeted
more to curtail gasoline consumption science, emigrated to the United States level of output for each industry; in a
significantly, because they apply only and joined the faculty of Harvard Uni- capitalist economy, market forces in-
to new cars—they do nothing about versity in 1931. While there, Leontief stead make that determination. The
existing cars with poorer mileage. adapted input-output analysis to the trickiest point to understand is that
The cost estimates that we quoted U.S. economy. However, in the post- the model contains feedback loops that
above are consistent with those of World War II frenzy of anti-Communist force most industries to produce more
CARB, which figured that compliance paranoia, Leontief’s funding was ter- than the “direct output requirements”
with its regulations would add $1,050 minated, and such models fell out of would seem to imply. For example, a
to the price of a typical vehicle. They favor. Only in the 1960s did economists demand for x percent more automo-
are not consistent with estimates by the finally recognize I-O analysis as useful biles than last year requires y percent
Alliance of Automobile Manufacturers, for other purposes than the centralized more steel. But steel mills require elec-
which claims that the CARB mandate “planning” of a socialist economy. tricity to run. And an electric utility
would cost about $3,000 per vehicle—a Fortunately, Leontief lived to see requires turbines from a factory to pro-
higher cost for a good deal less im- his work vindicated: He received the duce electricity. That factory in turn
provement than our advanced scenar- 1973 Nobel Prize in Economic Sciences needs steel from steel mills to produce
io. We believe this estimate is inflated. for his pioneering efforts in develop- turbines, and the steel mill requires
Indeed, the auto industry has a long ing this method. Today, I-O analysis more electricity, and so on.
history of greatly overestimating the is used regularly as a national and Leontief discovered an ingenious
costs of vehicle environmental, safety regional economic impact and fore- mathematical method through matrix
and fuel-efficiency improvements. We casting tool. Probably its most visible inversion that collapses all of these feed-
chose to use estimates based on the and publicized use includes projecting back loops into one step and calculates
work of the National Research Coun- the economic impacts of sports facili- the extra (“indirect”) output require-
cil, a body we believe to be impartial. ties. Another prominent use is pro- ments they create. The ratio of the total
Of course, the results of our economic jecting the negative impact brought requirements to the direct requirements
model depend critically on these cost to communities when military bases is called the input-output multiplier.
estimates, and those who think that are closed. And anytime you hear es- To apply our model, we first trans-
our figures are too low may disagree timates of what the tourism industry lated the increased expenditures for re-
with our conclusions. has brought into the state or local-area configured motor vehicles (those meet-
economy and the number of jobs gen- ing the revised CAFE standards) into
Input-Output Models erated, the projections were almost per-unit output requirements for ev-
Before we turn to the results of our surely made by I-O analysis. ery industry in the economy. We used
forecast, we would like to explain how An input-output model divides these demands to derive the “direct”
our model works. The main engine, the national or regional economy into output requirements for each industry
input-output (or “I-O”) analysis, was various industrial sectors and tracks and then applied Leontief’s mathemat-
first developed by economists in the So- how much each industry must pur- ical formulae to compute the indirect
viet Union in the 1920s. Input-output chase from every other industry to production needed. Next, we used the
analysis might have ended up in the produce one unit of output. In a social- total output requirements to compute
dustbin of history, had not Wassily Le- ized economy, a centralized planning sales volumes, profits and value added
© 2005 Sigma Xi, The Scientific Research Society. Reproduction
136 American Scientist, Volume 93
with permission only. Contact perms@amsci.org.for each industry. Finally, using gov- has more dramatic effects: After rising to $1.75 per gallon (in 2002 dollars). In
ernmental data on man-hours, labor through 2010, gasoline consumption the moderate scenario, by 2030, con-
requirements and productivity, we actually begins to drop as the vehicle sumers spend $35 billion to $50 billion
estimated the number of jobs created fleet is gradually transformed—older less on gasoline than they do in the base
within each industry. (Jobs were the vehicles are scrapped and replaced with scenario. But the savings come at a cost:
main focus of our project, but we could new, more fuel-efficient ones. Eventu- the higher price of the more fuel-effi-
just as easily have estimated the effects ally, though, because of the continually cient vehicles. By 2030, the increased
of CAFE on personal income, corporate increasing number of vehicles on the vehicle cost will be $16 billion per year.
profits or government tax revenues.) road, the trend turns around. By 2030, Thus the stricter CAFE standards prove
For this study, we went into even the nation is back to consuming about to be a good bargain, not only in 2030
greater detail, breaking the effects of 130 billion gallons per year, about the but throughout the lifetime of the mod-
the CAFE standards down by occupa- same amount as in 2005. In effect, the el. And, if gasoline prices are higher
tion and geography. The geographic advanced scenario “buys” the country a than we assumed (as they currently
analysis uses a region-by-region ver- 25-year delay in its tendency to consume are), consumers will save even more.
sion of our national model, which more gasoline with each passing year. The story for the advanced scenario is
we can take all the way down to the The reductions in fuel consump- a little different. There would be a little
county level of detail if needed. (For tion translate into financial savings for more pain at first for American con-
this project, though, we went down American consumers. The extent of the sumers, because the CAFE standards
only to the state level.) Because of the windfall depends, of course, on the cost do not start paying for themselves un-
comprehensive nature of the modeling of gasoline. Because we cannot forecast til roughly the year 2020. However, by
system, the regional analysis uses the gas prices with any accuracy, we used a 2030, consumers are comfortably in the
same data and gives results consistent range of hypothetical values from $1.25 black: They would save $75 billion to
with the national analysis.
In all, our national model currently
includes 495 industries and 699 occu-
pations. At the state level we used a �����
more coarse-grained model with 85 in-
dustries, but kept the full occupational
detail. We mention these numbers
solely to give an idea of the scale of the
undertaking. It is very important to
realize that size alone is no guarantee
of a model’s accuracy. Just as impor-
tant, in our opinion, is the quality of
the data that go into the model. We use
����
data that come directly from U.S. gov-
ernment statistical agencies and very
rarely from other sources. These data
are unbiased, are respected worldwide
and, most important, are gathered in a
comparable fashion across states and
across industries.
Running the Numbers
Our first job was to estimate the over-
all effects of the “moderate” and “ad-
vanced” CAFE scenarios on gasoline
consumption. Do they solve the prob-
lem they are intended to solve? In both ������
cases, the country uses less fuel than it
does in the base scenario, which is of
course as one would expect. In 2000,
the United States consumed about 125
billion gallons of gasoline. Under the
base scenario, this amount would in-
crease to 150 billion gallons by 2015
and 190 billion gallons by 2030. Under
Figure 5. Input-output models track numerous connections between different sectors of the
the moderate scenario, the increases
economy. In this schematic representation, only three out of the 85 sectors actually mod-
are smaller: 140 billion gallons by 2015 eled are shown. Here an increased demand for automobiles (center) will generate increased
and nearly 170 billion gallons by 2030. production requirements for steel (top). To fill this demand, steel plants will require more
Clearly, the moderate plan reins in electricity (bottom). To meet this capacity, the electric-power sector will require more steel to
America’s galloping appetite for oil but build turbines and power lines, thus setting up a feedback loop. Input-output analysis allows
fails to end it. The advanced solution economists to calculate the effect of such complicated feedback loops.
© 2005 Sigma Xi, The Scientific Research Society. Reproduction
www.americanscientist.org 2005 March–April 137
with permission only. Contact perms@amsci.org.�������������������� ��� and Indiana receives 22,300. California
���������������������
also scores an impressive increase of
��� ����
28,400 jobs, albeit on a much larger
��������
base. Only four states—Louisiana,
���
Wyoming, Alaska and New Mexico—
suffer net job losses, with Louisiana
��� �������� losing the most (1,100). Texas, a state
��� one might expect to be hard-hit by the
���� ���� ���� ���� ���� ���� ���� loss of petroleum-refining jobs, actu-
��� ally experiences a modest gain of 2,500
��������
jobs. Its losses in sectors such as “crude
��� petroleum and natural gas” and “con-
������������
�����������
struction” are more than offset by jobs
��� created in “motor vehicles and equip-
�
ment,” “fabricated metal products,”
��� “services” and other industries.
��������
Our results are consistent with simi-
�
���� ���� ���� ���� ���� ���� ����
lar studies that have been conducted
over the past three decades. For exam-
Figure 6. Authors’ input-output model predicts the effect of enhanced CAFE standards on the
economy. As shown in the top graph, annual gasoline consumption continues to increase un-
ple, in 1980, Douglas Dacy, Robert Kue-
der the moderate scenario, though not as fast as in the base scenario (no change to CAFE regu- nne and Paul McCoy of the University
lations). Only the advanced scenario brings the annual increases to a halt. Both the moderate of Texas and Princeton estimated the
and advanced scenarios lead to a net creation of new jobs (bottom), with the effect peaking at impact of the original CAFE standards
more than 350,000 new jobs in the advanced scenario in 2015. and projected a net increase in employ-
ment of 140,000 jobs by 1985, with the
$100 billion per year on gasoline, while We found that the motor-vehicle jobs projected in various service indus-
spending about $55 billion more per and related industries would be major tries, plastics, metal stampings and oth-
year on vehicles. winners (quite the opposite of the dire �����
Besides tracking the effect of the predictions of auto manufacturers), ������������
CAFE standard on gasoline consump- while employment in the petroleum ���������
tion, we also wanted to estimate its industry would suffer. For example, in
����������
effect on jobs. Clearly, substantial job the advanced scenario in 2020 (com- �������
shifting and displacement would oc- pared, as always, with the business-as-
cur. For example, in 2020, under the usual case), jobs in the “motor vehicle
��������������
moderate scenario, 101,000 jobs are and equipment” sector would increase
created but 72,000 jobs are displaced, by 155,000; jobs in the “rubber” sec-
creating a net employment increase of tor would increase by 22,000; and jobs ��������
29,000. Under the advanced scenario, in the “electronic component” sector
433,000 new jobs are created by that would increase by 9,500. But jobs in
����������
year and 86,000 are displaced, result- “crude petroleum and natural gas” ����������
ing in a net gain of 347,000. While sig- would decrease by 32,000 and “petro-
nificant, these gains must be put into leum refining” would lose 17,000 jobs. �����
perspective: In 2010, U.S. employment Our model also allows us to break ��������
will total 142 million, and in 2030 it down the employment trends by occu-
will total 166 million. So the increases pation as well as industry. In 2020, under ���������
amount to only a fraction of a percent the advanced scenario, jobs would be
of the national workforce. created for 700 computer programmers,
900 mechanical engineers, 1,500 com- ��������� ����
�������� ��������
Will It Play in Peoria? puter-controlled machine tool operators
We felt that the overall numbers for and 2,700 machinists. On the downside, ����� ��������
��������� ��������
the country did not convey in suffi- petroleum engineering jobs would de- �����������
cient detail what would happen to the crease by 700 and petroleum-pump op- ���
economy as a result of the proposed erators would decrease by 6,100. All of
�
��� ��� ��� �����
CAFE changes. The senators who were these are net figures; for example, the
�����������������
debating the changes in 2002 needed net gain of 700 computer programming
to know what would happen in their jobs results from 1,100 new positions Figure 7. Authors’ model generates sector-by-
sector predictions of total employment. In the
own states, though of course they also created and 400 displaced.
advanced scenario, most sectors experience a
needed to be mindful of the national Consistent with the above industry- small amount of growth by 2020. The “motor
picture. And the arguments of auto by-industry results, the places that ben- vehicles and equipment” sector grows the
manufacturers and organized labor efit the most from the enhanced CAFE most rapidly. Job losses in “petroleum refin-
could best be addressed if we knew regulations are the auto-producing ing” and “crude petroleum and natural gas”
what happened to employment on an states of the upper Midwest. Michigan are smaller in absolute numbers but larger in
industry-by-industry basis. gains 54,500 jobs, Ohio adds 29,300, percentage terms.
© 2005 Sigma Xi, The Scientific Research Society. Reproduction
138 American Scientist, Volume 93
with permission only. Contact perms@amsci.org.consumers money in the long run,
would not harm the U.S. economy and
would in fact lead to a significant net
increase in jobs, mostly within the first
five or ten years. A moderate improve-
ment in vehicle mileage will not re-
duce America’s consumption of oil,
although it will slow down the rate of
increase. To actually reduce consump-
tion, the government would have to
institute considerably stricter—though
still feasible—standards, amounting to
a 50-percent improvement in mileage
by 2015. Finally, whereas the overall
economic impact on the national scale
is positive, the benefits would not be
uniformly distributed. A few indus-
tries and states would see net losses
in employment, and job shifts would
occur even within industries, occupa-
tions and states that added jobs.
It’s time we put CAFE reform back
Figure 8. In a state-by-state breakdown, job increases in the advanced scenario are greatest in
on the national agenda. We believe
the upper Midwest and California (light green). Only four states (tan) experience net decreases that the results of models like ours
in employment, and the decreases are much smaller than the increases elsewhere. can influence the country’s decisions
about fuel efficiency, jobs and the econ-
er sectors outweighing projected losses First, union representation in the omy, thus moving the debate beyond
in steel, petroleum and gas, and whole- motor-vehicle industry has been de- rhetoric and political posturing. The
sale and retail trade. In 1989, Arvind clining for two decades, even during nation’s transportation system, petro-
Teotia and his associates at Argonne the 1990s, which was one of the most leum needs and the jobs of hundreds
National Laboratory estimated the im- robust and profitable decades in his- of thousands of Americans are at stake.
pacts of the use of clean diesel engine tory for domestic vehicle manufactur- Reliable information and objective
technology in light trucks to comply ers, whereas CAFE standards have not analysis are required. One would hope
with CAFE standards and found that changed since 1985. Organized labor’s that the work we’ve summarized here
between 70,000 and 110,000 jobs would problems in the industry thus appear to will improve the rigor and quality of
be created. In 1992, the American Coun- be deep-seated and cannot be attributed this critically important debate.
cil for an Energy-Efficient Economy es- to CAFE. Second, foreign manufactures
timated that by increasing the fuel effi- are rapidly improving their technol- Acknowledgments
ciency of passenger cars from 28 mpg in ogy, largely because their main markets The work summarized here was supported, in
1990 to 40 mpg in 2000 and 50 mpg in are in countries with high fuel prices part, by the Energy Foundation.
2010, 244,000 additional jobs would be or high fuel-economy standards. To Bibliography
created by 2010. A 2001 Union of Con- the extent that stricter standards force Bezdek, R. H, and R. M. Wendling. 2005. Po-
cerned Scientists study analyzed the domestic manufacturers to adopt new tential long-term impacts of changes in U.S.
economic effects of increasing CAFE technology, enhanced CAFE could actu- vehicle fuel efficiency standards. Energy
standards to 40 mpg by 2012 and to 55 ally improve their competitiveness—and Policy 33:407–419.
mpg by 2020, and projected an increase thus preserve and expand union jobs. Dacy, D. C., R. E. Kuenne and P. McCoy. 1980.
Employment impacts of achieving auto-
of 104,000 jobs by 2020. Although we are not in a position mobile efficiency standards in the United
Our analysis shows that enhanced to offer any firm answers about this States. Applied Economics 12:295–312.
CAFE standards would increase overall particular issue, our I-O modeling rec- Friedman, D., J. Mark, P. Monahan, C. Nash
employment in the United States, but it ognizes that a substantial portion of and C. Ditlow. 2001. Drilling in Detroit: Tap-
is still conceivable that there could be U.S. vehicle expenditures are made on ping Automaker Ingenuity to Build Safe and Ef-
ficient Automobiles. Cambridge, Mass: Union
a net decrease in union jobs. Indeed, imports and create sales and jobs in-
of Concerned Scientists Publications.
labor unions such as the United Auto ternationally. Imports will continue to
National Research Council. 2002. Effectiveness
Workers are concerned that the new be sold in the United States, and those and Impact of Corporate Average Fuel Economy
standards would exacerbate the shift countries that cater to our markets (CAFE) Standards. Washington, DC: Nation-
in production toward imports and ve- can expect positive economic gains, al Academy Press.
hicles produced in U.S. factories owned including additional jobs. Of course,
by foreign companies (“transplant” U.S. vehicles and parts sold in Europe For relevant Web links, consult this
facilities, which are rarely unionized). and Asia also create jobs—both union issue of American Scientist Online:
They might be right. Nevertheless, there and nonunion—here at home.
are reasons to question the presumed In summary, our modeling leads us http://www.americanscientist.org/
inverse correlation between union jobs to an unambiguous conclusion: An in- IssueTOC/issue/701
and CAFE standards. crease in CAFE standards would save
© 2005 Sigma Xi, The Scientific Research Society. Reproduction
www.americanscientist.org 2005 March–April 139
with permission only. Contact perms@amsci.org.You can also read