An Analysis of Subdaily Severe Thunderstorm Probabilities for the United States
←
→
Page content transcription
If your browser does not render page correctly, please read the page content below
FEBRUARY 2020                                         KROCAK AND BROOKS                                                                        107

      An Analysis of Subdaily Severe Thunderstorm Probabilities for the United States

                                                          MAKENZIE J. KROCAK
         Cooperative Institute for Mesoscale Meteorological Studies, University of Oklahoma, and NOAA/OAR/National Severe
                                                Storms Laboratory, Norman, Oklahoma

                                                                                                                                                       Downloaded from http://journals.ametsoc.org/waf/article-pdf/35/1/107/4918183/waf-d-19-0145_1.pdf by NOAA Central Library user on 11 August 2020
                                                           HAROLD E. BROOKS
       NOAA/OAR/National Severe Storms Laboratory, and School of Meteorology, University of Oklahoma, Norman, Oklahoma

                                      (Manuscript received 12 July 2019, in final form 4 October 2019)

                                                                  ABSTRACT

                 One of the challenges of providing probabilistic information on a multitude of spatiotemporal scales is
               ensuring that information is both accurate and useful to decision-makers. Focusing on larger spatiotemporal
               scales (i.e., from convective outlook to weather watch scales), historical severe weather reports are analyzed
               to begin to understand the spatiotemporal scales that hazardous weather events are contained within. Reports
               from the Storm Prediction Center’s report archive are placed onto grids of differing spatial scales and then
               split into 24-h convective outlook days (1200–1200 UTC). These grids are then analyzed temporally to assess
               over what fraction of the day a single location would generally experience severe weather events. Different
               combinations of temporal and spatial scales are tested to determine how the reference class (or the choice of
               what scales to use) alters the probabilities of severe weather events. Results indicate that at any given point in
               the United States on any given day, more than 95% of the daily reports within 40 km of the point occur in a 4-h
               period. Therefore, the SPC 24-h convective outlook probabilities can be interpreted as 4-h convective outlook
               probabilities without a significant change in meaning. Additionally, probabilities and threat periods are an-
               alyzed at each location and different times of year. These results indicate little variability in the duration of
               severe weather events, which allows for a consistent definition of an ‘‘event’’ for all locations in the conti-
               nental United States.

1. Introduction and background                                             provide a continuous stream of probabilistic informa-
                                                                           tion to keep people up to date on weather, water, and
   Experts in the field of weather risk communication
                                                                           climate threats from days or more out down to minutes
show that end users generally understand the existence
                                                                           before the event occurs (Rothfusz et al. 2018).
of underlying uncertainty in weather forecast informa-
                                                                              The current National Weather Service (NWS) prod-
tion (e.g., Morss et al. 2008; Joslyn and Savelli 2010;
                                                                           uct structure for severe weather consists of three prod-
Savelli and Joslyn 2012; Fundel et al. 2019). As such,
                                                                           uct levels; the convective outlook [which is issued by the
research organizations have called for using proba-
                                                                           Storm Prediction Center (SPC) from 1 to 8 days in ad-
bilities to describe this forecast uncertainty, as it may
                                                                           vance for the continental United States (CONUS)],
be beneficial to residents when making response ac-
                                                                           severe thunderstorm and tornado watches (which are
tion decisions (National Research Council 2006; AMS
                                                                           also issued by the SPC generally 1–4 h before the event
Council 2008). Following these recommendations, the
                                                                           occurs, with a mean size of 30 000 square miles, which is
National Oceanic and Atmospheric Administration
                                                                           about the size of Maine), and then the warning (issued
(NOAA) is currently developing a paradigm that in-
                                                                           by a local NWS office 0–60 min before the event and
cludes rapidly updating probabilistic information for
                                                                           has a mean size of 250 square miles). One of the early
user-specific locations. The Forecasting a Continuum
                                                                           challenges of the FACETs project was the reliance of
of Environmental Threats (FACETs) project aims to
                                                                           community infrastructure on these current products. For
                                                                           example, some communities often use a specific product
  Corresponding author: Makenzie J. Krocak, makenzie.krocak@               (like a tornado watch) to activate procedures (Cross
noaa.gov                                                                   et al. 2019).

DOI: 10.1175/WAF-D-19-0145.1
Ó 2020 American Meteorological Society. For information regarding reuse of this content and general copyright information, consult the AMS Copyright
Policy (www.ametsoc.org/PUBSReuseLicenses).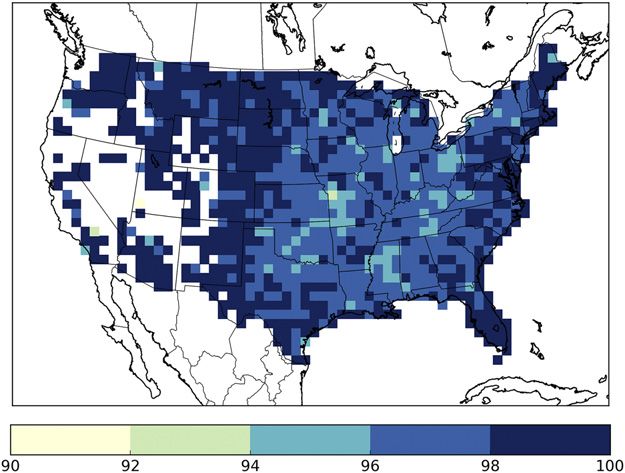
108                                     WEATHER AND FORECASTING                                                       VOLUME 35

   Since transitioning from the current system will likely
be evolutionary and take time and discourse, researchers
have begun working on ways to provide more informa-
tion within and in-between the current product levels. As
part of this effort, research scientists and forecasters
need to understand how the probabilities of these                FIG. 1. An example of a daily time series of reports for a single
                                                               location. The green shaded area represents 6 h, the yellow repre-
events change between different reference classes [i.e.,
                                                               sents 4 h, and the red represents 1 h of the day. The percentages
the probability of a report within 40 km (25 mi) of my         reflect the fraction of reports captured in each timeframe for this
location versus the probability of a report at my house        particular example.
in the next 5 min] so that forecasters can assign correct

                                                                                                                                     Downloaded from http://journals.ametsoc.org/waf/article-pdf/35/1/107/4918183/waf-d-19-0145_1.pdf by NOAA Central Library user on 11 August 2020
values that are also meaningful to users. This work
focuses on understanding the probabilities of severe           Center 2019b) between 1950 and 2015 are used to
weather on a subdaily scale, but larger than the warning       calculate the spatiotemporal scales that severe events
scale (i.e., spatiotemporal scales between the convec-         generally fit within (i.e., a spatial area and temporal
tive outlook and watch, generally on a state to regional       duration that captures a majority of the daily events).
spatial scale and temporal scales between 1 and 24 h).         While there are known issues with the report database,
   To begin this process, we start by analyzing the distri-    especially with regards to the increase in the number
bution of events within a day at any single location. We       of reports (see Doswell and Burgess 1988; Trapp et al.
use the general SPC convective outlook probabilities as a      2006; Verbout et al. 2006), it is the most comprehensive
simple starting point. While the probabilities are fore-       severe weather occurrence database for the United
casted for up to a 24-h period, intuitively, many meteo-       States and we believe the data still provide useful in-
rologists know that at any location the probability of         sight into the general pattern of severe weather events.
severe weather is actually near zero for a large portion of       We begin by identifying all of the reports within a
the day, then it increases to the forecasted probability       specified radius (we test 10, 20, 40, 80, and 200 km)
shortly before the event begins, and then decreases back       around a point in the CONUS. While we test multiple
to near zero shortly after the event ends. Following this      spatial scales, we focus most of our analysis on the 40-km
example, we define an event as a local storm report within     radius so that our results could speak to the defini-
40 km (25 mi) of a point to match the spatial scales of the    tions of the current SPC products and allow for the
current SPC convective outlook probabilities (NOAA             testing and verification of new products within the SPC
Storm Prediction Center 2019a). We then investigate how        forecast domain.
the events on a single day are distributed in time. Are they      Next, at each point with at least 20 reports over the
spread out across the day or concentrated within a smaller     65-yr period, we create time series of the reports for
period of time? If there is a smaller window of time when      each convective (1200–1200 UTC) day. An example of
most of the events are concentrated, when does that            this time series is shown in Fig. 1. Using these time
window start? Is there regional variability in the duration    series, we calculate a variety of quantities including the
of severe reports or the start time of the smaller win-        maximum percentage of the daily reports that are
dow of threat? Given that our analysis has nearly              captured within smaller timeframes (specifically within
identical spatial scales to the current SPC convective         1, 2, 4, 6, 8, and 12 h of the day), and the start time of
outlook probabilities, knowledge of the climatological         the maximum daily window. The percentage of reports
duration of severe weather events means the SPC con-           captured in smaller timeframes is calculated at each
vective outlook probabilities could be valid for a smaller     grid point as follows:
window of the day. The forecasting challenge would then
be to identify when that window starts and ends. From a                                       å rcaptured
                                                                                pcaptured 5               3 100,
communication standpoint, knowing the forecasted win-                                          årtotal
dow of threat on a severe weather day could help the entire
range of decision-makers, from emergency management            where the numerator is the sum of the reports captured
and school officials to youth coaches and individuals, de-     within the specified smaller timeframe on all days, and
cide how to prepare in advance of the start of the event.      the denominator is the total number of reports that oc-
                                                               curred at that grid point. In Fig. 1, the numerator would
                                                               be the number of reports captured in the shaded areas
2. Data and methods
                                                               (green showing 6 h of the day, yellow showing the 4 h of
  Hail, wind, and tornado reports from the SPC                 the day, and red showing 1 h of the day with the maxi-
Severe Report Database (NOAA Storm Prediction                  mum number of reports captured), and the denominator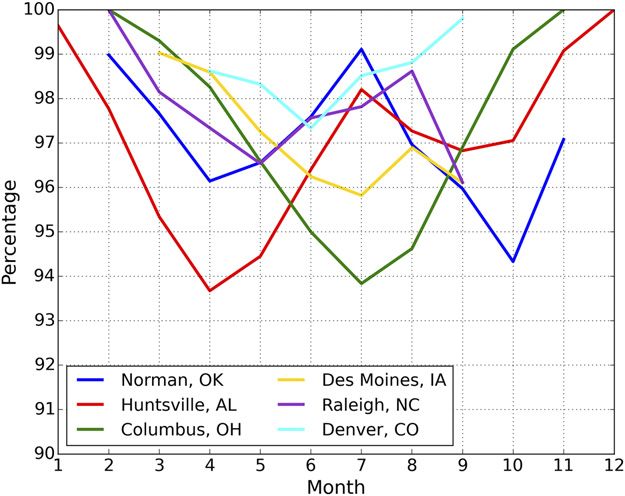
FEBRUARY 2020 KROCAK AND BROOKS 109
a report occurring within 25 nautical miles of a point), it
follows that the SPC’s probabilities at any given point
can be interpreted as valid for 4 h of the day within
a reasonable margin of error (over 95% of reports vs
100% of reports).
After analyzing severe weather probabilities on
varying temporal scales, we also calculate the percent-
age of events captured within numerous radii around a
point and numerous temporal durations (Fig. 2). For all
radii, the percentage of reports that are not captured
Downloaded from http://journals.ametsoc.org/waf/article-pdf/35/1/107/4918183/waf-d-19-0145_1.pdf by NOAA Central Library user on 11 August 2020
increases with increasing radii around a point and de-
creasing temporal durations. This probability behavior
is largely intuitive because it takes longer for weather
systems to cover a 200-km radius (similar to the north–
south extent of Oklahoma) than a 40-km radius (similar
to the size of the Oklahoma City limits). In other words,
FIG. 2. The percentage of reports not captured (y axis) at dif-
reports will be occurring for a longer period of time
fering time periods (x axis) within the 24-h convective outlook day.
The percentages are expressed on a logarithmic scale to show detail when looking at an area the size of Oklahoma versus an
at the smallest values. The dashed line indicates 5% of reports not area the size of Oklahoma City. More than 95% of re-
captured. ports within 10 km of a radius are captured within a
single hour of the day or longer (represented by the
would be the total number of reports shown in the time points below the dashed line in Fig. 2). Longer temporal
series. Obviously, if there is only one report at a point durations are needed to capture more than 95% of daily
over the convective outlook day, then the total per- reports at other radii. The 40-km radius needs at least
centage of reports captured that day is 100%. Then the 4 h, and the 200-km radius needs 8 h (Fig. 2).
total number of reports in the numerator and denomi- While the main goal of this work is to understand how
nator are aggregated over all days and all grid points. To severe event probabilities behave within differing spa-
analyze regional differences in the window start time, tiotemporal scales, it is also critical to understand how
the timestamp of the start of the smaller timeframe is these behaviors differ by location. To align with the
calculated for each day. Then the median start time at current SPC definition of an event (defined as a severe
each grid point is calculated. weather report within 25 miles—or roughly 40 km—of a
point; NOAA Storm Prediction Center 2019a) and still
capture a majority of daily reports (see the green line in
3. Results
Fig. 3), the 40-km spatial scale and 4-h temporal scale
To begin the analysis, we aggregate all of the points are used for further investigation. To this end, the per-
across the CONUS to obtain a holistic view of the spa- centage of reports captured is calculated for each indi-
tiotemporal scales of severe weather events. First, we vidual point across the CONUS on an 80-km grid
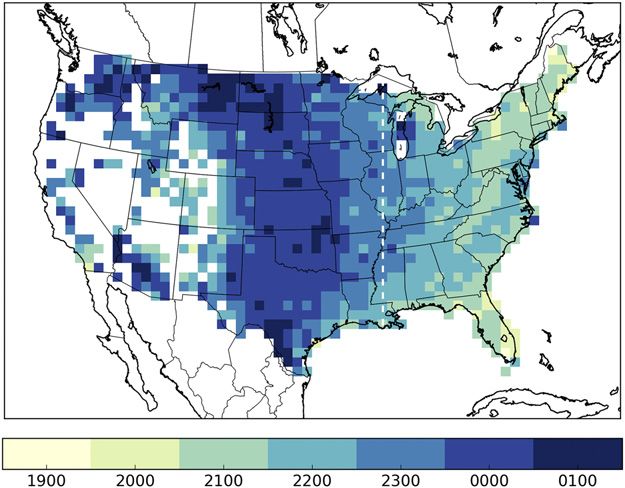
analyze all of the reports within 40 km of a point for all (Fig. 3). More than 90% of all reports within 40 km of a
points across the CONUS (Fig. 2, green line). Within point are captured in 4 h of the 24-h convective outlook
any single convective outlook day, more than 99% of day for all points east of the Rocky Mountains (where
reports will be contained within just 12 h of the full day. most severe events occur). Therefore, the current 24-h
Furthermore, over 95% of daily reports within 40 km of convective outlook probabilities forecasted by the SPC
any point occur in a 4-h period, and a single hour of the could be interpreted as 4-h probabilities with different
day still captures more than 80% of the daily reports. If start times depending on the location and day. This
we consider the probability behavior of uniformly dis- finding is important because any products that use this
tributed points (i.e., events occurring equally across the definition (like a convective outlook-type product) need
24-h period), the percentage of reports captured drops to have consistent probabilistic definitions of events
to 50% at 12 h and just 16.7% at 4 h (Fig. 2, gray line). across the entire domain. Since there are no strong
Clearly, severe weather events at any given point are gradients in probability, any future products that use
concentrated in timeframes smaller than 24 h, with a vast this definition will remain consistent no matter where
majority of reports occurring in just 4 h of the day. the product is placed in the CONUS. An example of
Moreover, since the spatial scales of this analysis are an experimental product might be a convective outlook
nearly identical to the SPC’s definition of an event (i.e., that includes the probabilities of an event occurring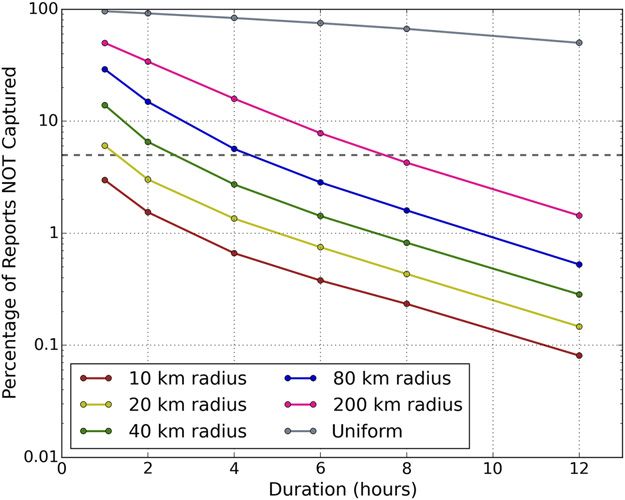
110                                       WEATHER AND FORECASTING                                                     VOLUME 35

                                                                                                                                     Downloaded from http://journals.ametsoc.org/waf/article-pdf/35/1/107/4918183/waf-d-19-0145_1.pdf by NOAA Central Library user on 11 August 2020
  FIG. 3. The percentage of all daily reports within 40 km of a
point captured in a 4-h period of a 24-h convective outlook day      FIG. 4. The percentage of all daily reports within 40 km of a
(1200–1200 UTC). Data are reported for grid points with at least   point captured in a 4-h period for Norman, OK; Huntsville, AL;
20 reports over the 65-yr study period.                            Columbus, OH; Des Moines, IA; Raleigh, NC; and Denver, CO.

along with a forecasted 4-h timeframe of when that                 totality of severe weather reports, instead of focusing on
event may occur (Krocak and Brooks 2019). Since the                individual hazards. While there have been some studies
percentages of reports that climatologically occur within          that examine the spatiotemporal patterns of tornado
4 h at any given point are largely the same across the             reports in more depth (e.g., Krocak and Brooks 2018;
entire CONUS domain (Fig. 3), decision-makers can be               Brooks et al. 2003), more work needs to be done to in-
sure that the product is valid no matter where severe              vestigate how these trends hold up when looking at hail
weather is forecasted.                                             or wind occurrence.
   In addition to understanding how severe weather                    Next, assuming that convective outlook probabilities
events vary by region, we also investigate how event               can be interpreted as applying to smaller time periods
durations at a single point vary by season. The same               within the day, we want to know when the climatological
ratio of events in a 4-h period is calculated at each point        start time of those smaller time periods are. To accom-
for all 12 months. We focus on six locations (Norman,              plish this, the start time of the 4-h period on each day
Oklahoma; Huntsville, Alabama; Columbus, Ohio; Des                 with severe reports is found and then the median of
Moines, Iowa; Raleigh, North Carolina; and Denver,                 all the start times is calculated at each grid point.
Colorado) because they illustrate the differences be-              Start times in the Central Plains are generally around
tween regions of the CONUS (Fig. 4). There is a drop in            0000 UTC and become progressively earlier toward
percentage of reports captured at all locations during             the East Coast, where start times are around 2100–
the peak tornado season (see Krocak and Brooks 2018),              2200 UTC (Fig. 5). In addition to the local solar time
and then a subsequent increase afterward. Norman and               (i.e., diurnal heating) being later relative to UTC
Huntsville have relative minimums during April (the                moving from east to west across the CONUS, some
spring tornado season) and September/October (the                  physical mechanisms such as the elevated mixed layer
secondary fall tornado season). Similarly, Raleigh has             (EML) inversion (Lanicci and Warner 1991), oro-
a relative minimum in May and a second decrease in                 graphic lift, sea breezes, and the low-level jet may
September. Columbus and Des Moines both see the                    result in storms initiating later in UTC time for the
minimum percentage captured in July (again, aligned                plains relative to the East Coast.
with the peak in tornado occurrence for those locations).             The differences in severe weather timing can be seen
Finally, Denver has a small decrease in June, which may            even more clearly when the start times of the 4-h periods
be in part due to sample size as well as tornado sea-              are grouped together by region (Fig. 6). We define the
sonality. The dips in percentages may also be explained            central United States as the region roughly between 918
by overnight convection trailing into the morning hours,           and 1058 longitude west and the eastern region roughly
followed by a more substantial event starting in the af-           between 658 and 908 longitude west. The entire dis-
ternoon and evening of the following day. Some of these            tribution of start times is shifted later in the day when
trends may be muted because we chose to look at the                comparing the central region to the eastern region.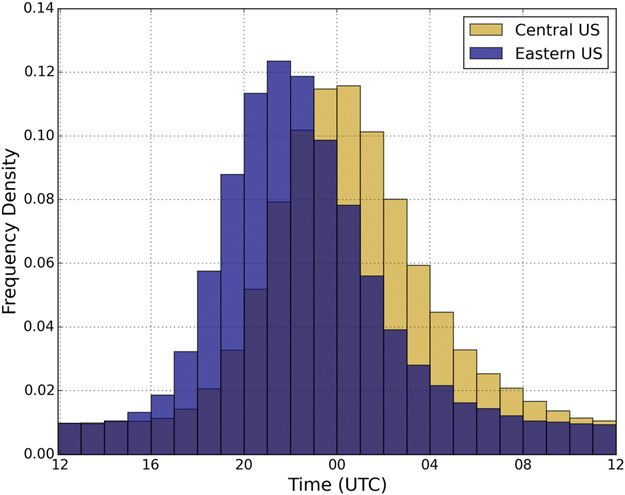
FEBRUARY 2020                                     KROCAK AND BROOKS                                                                  111

                                                                                                                                             Downloaded from http://journals.ametsoc.org/waf/article-pdf/35/1/107/4918183/waf-d-19-0145_1.pdf by NOAA Central Library user on 11 August 2020
  FIG. 5. The median daily start time (UTC) of the 4-h period that      FIG. 6. Overlapping histograms of the daily start times of the 4-h
captures the highest percentage of the daily severe weather reports   period that captures the most daily reports within 40 km of a point
within 40 km of a point. Data are reported for grid points with at    for roughly 658–908W longitude and for 918–1058W longitude.
least 20 reports over the 65-yr study period. The dashed line indi-
cates the delineation between the eastern and central United States
used in Fig. 6.
                                                                      of severe weather events on spatiotemporal scales smaller
                                                                      than the SPC convective outlooks, but larger than warn-
While some of this change is due to the difference in                 ings issued by the National Weather Service. Results
local time and the diurnal cycle, there are still two dis-            show that a vast majority of daily severe weather reports
tinct severe weather time periods: one for the eastern                at any given point occur within smaller timeframes. In
part of the country starting between 2000 and 2300 UTC,               fact, more than 95% of reports within 40 km of a point
and one for the central portion of the country starting               occur in a 4-h period, meaning that the 24-h convective
between 2200 and 0200 UTC. This equates to a majority                 outlook probabilities assigned by forecasters in the
of severe weather in the eastern part of the country                  SPC could be interpreted as 4-h probabilities within
occurring between 2000 and 0300 UTC for any given                     a reasonable margin of error. If such an interpretation
day, and a majority of severe weather in the plains oc-               is considered, then the forecasting question becomes
curring between 2200 and 0500 UTC. Regardless of lo-                  ‘‘which 4-hour period is it?’’ While there are many
cation in the CONUS, these peak periods for severe                    NWS weather forecast offices that offer timing infor-
weather are a good guide for potential impacts on late                mation for severe weather, this is not a standardized
afternoon and evening activities and public safety.                   practice and it is not required of any forecast office. If
                                                                      there was a standardized, regularly issued product that
                                                                      showed timing information for severe weather well
4. Discussion
                                                                      ahead of the event start time, decision-makers may be
  As a new generation of probabilistic severe weather                 able to make informed preparedness decisions (like
products begins to take shape, researchers and fore-                  opening emergency operations centers, adjusting staff-
casters are continually analyzing the best strategies for             ing levels, releasing employees or students early, etc.)
providing probabilistic information that is both accurate             with more advanced notice.
and useful to decision-makers. This study illuminates                    Probabilities of severe events are also analyzed spa-
one possibility for using probabilistic information to                tially based on location in the United States. The 4-h
transition from the current hazardous weather alert                   percentages of reports captured show that those ra-
system to one with higher spatiotemporal granularity                  tios are consistent across all portions of the country
and objective consistency, at least on larger spatiotem-              east of the Rocky Mountains, ranging between 90%
poral scales. Some of this information has already been               and 100%. This result is promising as products placed
tested with forecasters and users (e.g., Wilson et al.                across different regions would have consistent defi-
2019; Skinner et al. 2018), and others are still well in              nitions and probabilities of events. These percentages
the development stage.                                                are also relatively consistent across seasons, with
  We hope that this work serves as a foundation for fu-               most locations seeing at least 94% of reports captured
ture product development by analyzing the probabilities               during any given month. In addition to the percentage
112 WEATHER AND FORECASTING VOLUME 35
of reports captured, the start time of the maximum Fundel, V. J., N. Fleischhut, S. M. Herzog, M. Göber, and
4-h period is also analyzed spatially. The most nota- R. Hagedorn, 2019: Promoting the use of probabilistic weather
forecasts through a dialogue between scientists, developers
ble trend is seen by the later start times in the plains
and end-users. Quart. J. Roy. Meteor. Soc., 145, 210–231, https://
and earlier start times on the East Coast. The peak doi.org/10.1002/qj.3482.
start time in the plains is around 3 h later than Joslyn, S., and S. Savelli, 2010: Communicating forecast uncer-
the start times on the East Coast, although some of tainty: Public perception of weather forecast uncertainty.
those differences are due to the differences in local Meteor. Appl., 17, 180–195, https://doi.org/10.1002/met.190.
Krocak, M. J., and H. E. Brooks, 2018: Climatological estimates
solar time.
of hourly tornado probability for the United States. Wea.
Ultimately, the goal of any forecasting system should Forecasting, 33, 59–69, https://doi.org/10.1175/WAF-D-17-0123.1.
be to provide users with accurate and useful information ——, and ——, 2019: Testing and verifying potential severe timing
Downloaded from http://journals.ametsoc.org/waf/article-pdf/35/1/107/4918183/waf-d-19-0145_1.pdf by NOAA Central Library user on 11 August 2020
that can aid in the decision-making process. While some forecasts in the Hazardous Weather Testbed. Ninth Conf.on
of the current system’s product structure likely needs Transition of Research to Operations, Phoenix, AZ, Amer.
Meteor. Soc., 8B.3, https://ams.confex.com/ams/2019Annual/
to remain as it is, additional information about the like-
meetingapp.cgi/Paper/350019.
lihood and timing of hazardous weather could be em- Lanicci, J. M., and T. T. Warner, 1991: A synoptic climatology of
bedded within and in-between the current product levels. the elevated mixed-layer inversion over the southern Great
This work is meant to provide baseline knowledge of Plains in spring. Part I: Structure, dynamics, and seasonal evo-
the concentration and spatiotemporal structure of se- lution. Wea. Forecasting, 6, 181–197, https://doi.org/10.1175/
1520-0434(1991)006,0181:ASCOTE.2.0.CO;2.
vere weather events in the United States. Future work
Morss, R. E., J. L. Demuth, and J. K. Lazo, 2008: Communicating
is needed to understand how events behave on warning uncertainty in weather forecasts: A survey of the U.S.
scales such that forecasters can provide probabilistic public. Wea. Forecasting, 23, 974–991, https://doi.org/10.1175/
information that is accurate, timely, and most impor- 2008WAF2007088.1.
tantly, useful to decision-makers within the severe National Research Council, 2006: Completing the Forecast:
Characterizing and Communicating Uncertainty for Better
weather communication system.
Decisions Using Weather and Climate Forecasts. National
Academies Press, 124 pp., https://doi.org/10.17226/11699.
Acknowledgments. Funding was provided in part NOAA Storm Prediction Center, 2019a: SPC products page.
by NOAA’s Office of Weather and Air Quality NOAA, accessed 12 September 2019, https://www.spc.noaa.gov/
through the U.S. Weather Research Program and by misc/about.html.
——, 2019b: WCM Page. NOAA, accessed 13 June 2019, https://
NOAA/Office of Oceanic and Atmospheric Research
www.spc.noaa.gov/wcm/.
under NOAA–University of Oklahoma Cooperative Rothfusz, L. P., R. Schneider, D. Novak, K. Klockow, A. E.
Agreement NA11OAR4320072, U.S. Department of Gerard, C. Karstens, G. J. Stumpf, and T. M. Smith, 2018:
Commerce. The authors also thank Burkely Gallo, Jon FACETs: A proposed next-generation paradigm for high-
Zeitler, and two anonymous reviewers for providing impact weather forecasting. Bull. Amer. Meteor. Soc., 99,
2025–2043, https://doi.org/10.1175/BAMS-D-16-0100.1.
helpful comments.
Savelli, S., and S. Joslyn, 2012: Boater safety: Communicating
weather forecast information to high-stakes end users. Wea.
REFERENCES Climate Soc., 4, 7–19, https://doi.org/10.1175/WCAS-D-11-
00025.1.
AMS Council, 2008: Enhancing weather information with proba- Skinner, P. S., and Coauthors, 2018: Object-based verification of
bility forecasts. Bull. Amer. Meteor. Soc., 89, 1049–1053. a prototype warn-on-forecast system. Wea. Forecasting, 33,
Brooks, H., C. Doswell III, and M. Kay, 2003: Climatological es- 1225–1250, https://doi.org/10.1175/WAF-D-18-0020.1.
timates of local daily tornado probability for the United Trapp, R. J., D. M. Wheatley, N. T. Atkins, R. W. Przybylinski, and
States. Wea. Forecasting, 18, 626–640, https://doi.org/10.1175/ R. Wolf, 2006: Buyer beware: Some words of caution on the
1520-0434(2003)018,0626:CEOLDT.2.0.CO;2. use of severe wind reports in postevent assessment and re-
Cross, R. N., D. S. Ladue, T. Kloss, and S. Ernst, 2019: When search. Wea. Forecasting, 21, 408–415, https://doi.org/10.1175/
uncertainty is certain: The creation and effects of amiable WAF925.1.
distrust between emergency managers and forecast informa- Verbout, S. M., H. Brooks, L. M. Leslie, and D. M. Schultz, 2006:
tion in the southeastern United States. 14th Symp. on Societal Evolution of the U.S. tornado database: 1954–2003. Wea.
Applications, Phoenix, AZ, Amer. Meteor. Soc., TJ3.3, https:// Forecasting, 21, 86–93, https://doi.org/10.1175/WAF910.1.
ams.confex.com/ams/2019Annual/meetingapp.cgi/Paper/352381. Wilson, K. A., P. L. Heinselman, P. S. Skinner, J. J. Choate, and
Doswell, C. A., III, and D. W. Burgess, 1988: On some issues of United K. E. Klockow-McClain, 2019: Meteorologists’ interpretations
States tornado climatology. Mon. Wea. Rev., 116, 495–501, https:// of storm-scale ensemble-based forecast guidance. Wea. Climate
doi.org/10.1175/1520-0493(1988)116,0495:OSIOUS.2.0.CO;2. Soc., 11, 337–354, https://doi.org/10.1175/WCAS-D-18-0084.1.You can also read