An Assessment of Coastal Tourism Amenities for the South Coast region, KwaZulu-Natal, South Africa
←
→
Page content transcription
If your browser does not render page correctly, please read the page content below
African Journal of Hospitality, Tourism and Leisure, Volume 8 (3) - (2019) ISSN: 2223-814X
               Copyright: © 2019 AJHTL /Author/s- Open Access- Online @ http//: www.ajhtl.com

   An Assessment of Coastal Tourism Amenities for the
    South Coast region, KwaZulu-Natal, South Africa
                                          Michael R. Brett
                                 Department of Social Sciences
                                University of Zululand, South Africa
                                  E-mail: BrettM@unizulu.ac.za

Abstract
The South Coast of KwaZulu-Natal province contains the greatest concentration of coastal tourism
amenities in South Africa. Previously, the coastal resort towns along the170-kilometre-long coastline
were administered by 29 local authorities, but are now administered by four municipalities. Three of
these coastal municipalities fall under the Ugu District Municipality. This study examined 58 beaches
along the South Coast and recorded the presence of 23 environmental factors and amenities for each
beach. The region was divided into six sections of equal length and the beach amenities were mapped
and recorded on tables. The 23 tourist amenities were further grouped into eight categories, and each
category was evaluated and the scores plotted. Of the 58 beaches, 24% achieved a score exceeding
20 points and 24% obtained a score of 10 points or less. The findings indicate that for the South Coast
distance from the City of Durban is not a limiting factor, as 10 of the top 14 scoring beaches were in the
southern half of the region, and there is no direct relationship between high scoring beaches and
distance from Durban. While the seven Blue Flag beaches achieved an average score of 21.4,
compared to an average of 14.93 for all 58 beaches, they were not the only beaches to achieve a high
score. The research suggests that there is still space to extend the tourist amenities along the South
Coast, and an extension of the Blue Flag award would be one strategy for accommodating increasing
numbers of tourists.

Keywords: coastal tourism, Blue Flag award, tourism management, tourist increases, South Africa.

Introduction – The Importance of Coastal Tourism

Many researchers have highlighted the importance of coastal tourism and attempted to
quantify this segment of the tourism industry (Smith, 1992, 27; Klein et al, 2004,1149; Silva et
al, 2007,135; Williams, 2010,2; Williams and Barugh, 2014,427; Todd and Bowa, 2016, 710).
Throughout the world, sandy ocean beaches are a major tourist attraction and an important
source of revenue, and coastal recreational activities are overwhelmingly concentrated on
sandy beaches (Schlacher et al, 2007; Defeo et al, 2009; Klein and Osleeb, 2010). Apart
from an increase in pressure on the coastal environment resulting from a worldwide growth in
coastal tourism, approximately 44% of the world’s population lives within 150 kilometres of the
coastal zone (Willemse and Goble, 2018, 282). Given population concentrations and
increasing tourist pressures, “coastal authorities are faced with managing a highly complex
environment and ensuring that the public can continue to access the coast and benefit from its
resources in a sustainable manner” (Willemse and Goble, 2018, 282).

In a recent listing of the top 20 tourist countries in the world, where tourism contributes the
greatest proportion of GDP, for only two countries, Macau and Cambodia, is the tourism
industry not dominated by coastal tourism (Smith, 2018). Of the ten leading African countries
in 2017, which earned the highest income from tourism receipts, only Uganda does not have
a coastal tourism component (World Tourism Organization, 2018, 11, 18)(Figure 2).

In calculating the economic benefits accrued from tourism, the United Nations’ Statistics
Division computes only the direct contribution made by the tourism industry to the economy of
each country. However, the World Travel and Tourism Council (WTTC) argues that the
economic contribution of tourism permeates further into the economy, and includes indirect
and induced economic impacts. Direct economic impact is spending by domestic and foreign
                                                                                            1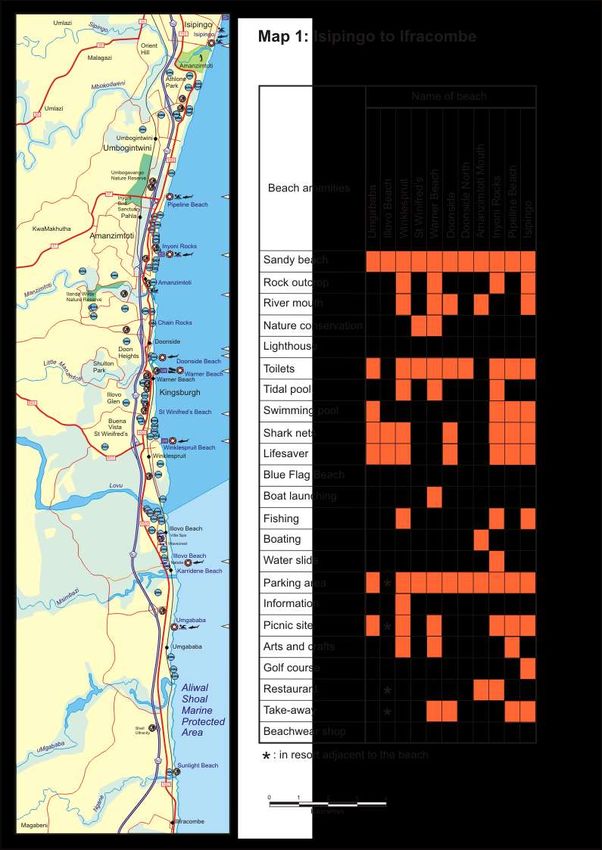
African Journal of Hospitality, Tourism and Leisure, Volume 8 (3) - (2019) ISSN: 2223-814X
              Copyright: © 2019 AJHTL /Author/s- Open Access- Online @ http//: www.ajhtl.com

tourists on accommodation, transport, entertainment and attractions. Indirect impact includes
capital investment, such as the construction of new accommodation or the purchase of aircraft,
as well as government services which support the tourism industry, and the purchase of goods
and services required by the tourism industry to deliver the product. The induced economic
contribution is a measure of the spending on goods and services by the people directly or
indirectly employed by the tourism industry (World Travel and Tourism Council, 2018f, 2).

How important is coastal tourism as a sector in the global tourism industry? For countries
where coastal tourism dominates the tourism industry (Figure 1), the percentage of GDP
generated by tourism revenue is often considerably higher than for the global average of
10.4%, including direct, indirect and induced calculations (World Travel and Tourism Council,
2018f, 3). From the selection of island nations analysed (Figure 1), total tourism contribution,
as a percentage of GDP, ranges from 9.7% for Comoros to 98.5% for the British Virgin Islands
(World Travel and Tourism Council, 2018f). For many of the island nations plotted, total
tourism contribution as a percentage of GDP exceeds 40%.

In the Indian Ocean island nations many nations generate a large portion of their GDP from
tourism. For the Maldives, direct contribution to GDP generated by tourism is the highest in
the world, while Seychelles is ranked at 5th place (World Travel and Tourism Council, 2018d,
8). In Mauritius, the direct contribution by tourism is 7.4% of GDP and 26.4% for Seychelles,
compared to 2.9% for South Africa. In the Seychelles, tourism accounts for 66% of all
employment, and for 22.6% of employment in Mauritius (World Travel and Tourism Council,
2018b,11; 2018d, 3; 2018e, 11). In the Indian Ocean island nations, total tourism contribution
as a percentage of GDP ranges from a low of 9.7% for Comoros, to 23.8% for Mauritius, 65.3%
for Seychelles and 76.6% for Maldives. Of the WTTC’s 12 geographic regions, the Caribbean
is the leading region in the world for tourism earnings as a percentage of GDP. Domestic and
foreign tourists spent $31.8 billion in the region in 2017, which exceeds the GDP of 37
individual African countries (Robertson, 2017; World Travel and Tourism Council, 2018a, 11).

The predominance of coastal tourism, and the apparent success of this segment of the tourism
industry in regions such as the Caribbean and the Indian Ocean raises a number of questions.
Is the contribution to the economy from coastal tourism as high as it initially appears to be?
Are high population densities, poorly diversified economies and an absence of viable
economic alternatives on many islands, exaggerating the economic contribution made by
tourism? To determine the relative economic contribution made by coastal tourism, the per
capita income generated by tourism in leading African tourist destinations and in island nations
was calculated from recent WTTC reports (Figure 2).

From the graph is it evident that, in some instances, income generated by island nations
greatly exceeds the global average. In 2017 direct income from tourism totalled $2,570 billion,
or an average of $341 for every person on earth (World Travel and Tourism Council, 2018f, 3,
11). For the lucrative North American geographic region, where the industry was expected to
grow by 3.4% in 2018, direct tourism earnings averaged $623 per capita for the inhabitants of
the United States of America (USA), Canada and Mexico (World Travel and Tourism Council,
2018c, 11). From Figure 2 it is clear that many Indian Ocean island nations considerably
exceed both the global and North American average per capita tourism revenue. None of the
top ten, mainland, African tourist destinations (Figure 2) approach the global average: South
Africa produces slightly more than half of the figure, Egypt less than one-third and Morocco
just more than two-thirds (World Tourism Organization, 2018, 11, 18). However, with the
exception of Comoros, the Indian Ocean island nations significantly surpass both averages,
even if high population densities on certain islands are taken into account. Seychelles’ direct
income from tourism in 2017 was $4,096 per resident, $3,360 for Maldives, $1,046 for Reunion
and $773 for Mauritius. Per capita revenue from tourism for the population of the Seychelles
is therefore more than six-fold higher than for the lucrative North American market (World
Travel and Tourism Council, 2018d, 11; 2018b, 3).
                                                                                              2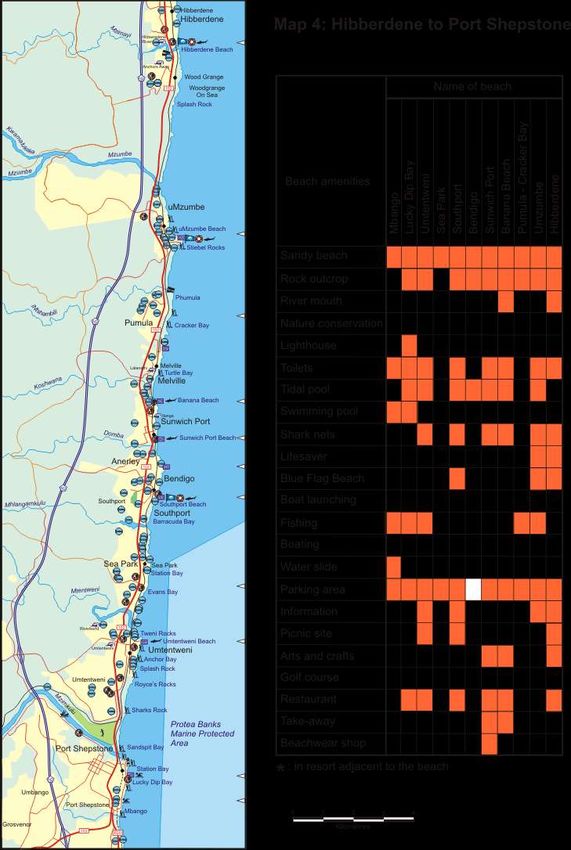
African Journal of Hospitality, Tourism and Leisure, Volume 8 (3) - (2019) ISSN: 2223-814X
                    Copyright: © 2019 AJHTL /Author/s- Open Access- Online @ http//: www.ajhtl.com

                            Tourism contribution to GDP and total employment
                                       for selected island nations
               Vanuatu                                          46,1
                  Belize                                     41,3
                     Fiji                                   40,3
               Maldives                                                                76,6
               Bahamas                                          47,8
                Anguilla                                                      61,6
       US Virgin Islands                          28
   British Virgin Islands                                                                             98,5
   Antigua and Barbuda                                                51,8                                    % of total employment
              Dominica                                  37,6
                                                                                                              Total GDP %
                St Lucia                                   41,8
              Barbados                                    40,6                                                Direct GDP %
                  Aruba                                                                       86,5
            Cape Verde                                         44,9
 Sao Tome and Principe                          24,3
              Mauritius                         23,8
             Seychelles                                                         65,3
               Reunion                 10,9
               Comoros                9,7
                            0              20          40               60             80            100

Figure 1: Direct and induced contribution of tourism to GDP in selected island nations, and percentage of
employment supported by the tourism industry. (Information obtained from World Travel and Tourism Council
(WTTC) reports, 2018)

                                              Per capita direct tourism earnings for 2017 (US$)

                   Egypt          105,76
                                     232,54
               Morocco               240,73
                                 61,57
                 Nigeria        2,45
                                16,41
                  Kenya          54,53
                                32,44
                 Zambia          42,84
                                29,60
          Mozambique            14,52
                                   139,72
              Botswana                289,39
                                    175,67
            Cape Verde                     555,06
                                         477,98
               Maldives                                                                                        3360,80
                                                  773,16
             Seychelles                                                                                                      4096,13
                                                       1046,07
               Comoros             32,90
                            0,00       500,00     1000,00    1500,00         2000,00   2500,00   3000,00     3500,00   4000,00   4500,00

Figure 2: Per capita direct tourism revenue for the leading African tourist destinations and African- and selected
Indian Ocean- island nations (Calculated from World Travel and Tourism Council reports)

                                                                                                                                 3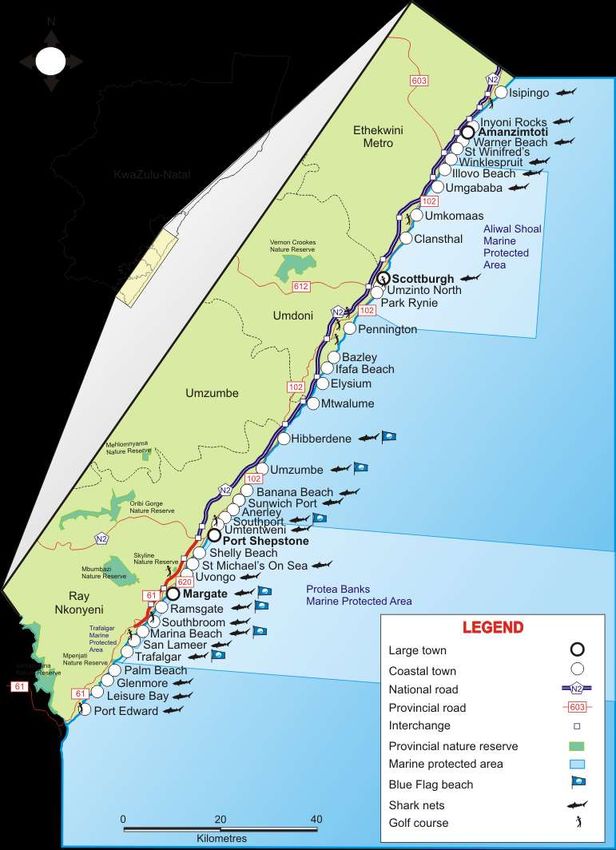
African Journal of Hospitality, Tourism and Leisure, Volume 8 (3) - (2019) ISSN: 2223-814X
              Copyright: © 2019 AJHTL /Author/s- Open Access- Online @ http//: www.ajhtl.com

Location of the study area

The term “coastal tourism amenities” in this paper is considered as the facilities and recreation
activities closely related to the beach, which is defined as, “the zone of loose or unconsolidated
material extending from the mean low water line to a point landward where either the
topography abruptly changes or permanent vegetation first appears” (Haller et al, 2011, 71).

The South Coast region of KwaZulu-Natal (Figure 3) contains the greatest concentration of
coastal tourism resorts and amenities in South Africa. This coastline stretches, from north to
south, for 170 kilometres from the City of Durban to the town of Port Edward, on the border of
the Eastern Cape province (Figure 3), and accounts for 6% of the South African coastline
(Rogerson et al, 2018, 9). The South Coast region has been described as, “a ribbon of seaside
suburbs…In the winter months it’s much warmer and sunnier along this stretch than on any of
the beaches between here and Cape Town” (Pinchuck et al, 2010, 426).

The concentration of coastal tourism resort towns can be attributed to a number of historic and
geographic influences: a sub-tropical climate, its relative closeness to the economic and
industrial heartland of Gauteng, and historic linkages which resulted from its early settlement
by British settlers in the 19th century, and the later establishment of a lucrative sugar industry
in the early decades of the 20th century (Buchanan & Hurwitz, 1951, 235; Christopher, 1971,
565, 575; Kellett & Williams, 2008, 456; Mucina and Rutherford, 2006, 572; Willemse and
Goble, 2018, 283).

In popular tourism literature, the South Coast is often described in rather idyllic terms, such
as, “a year-round combination of sunshine, sand, sea and surf has created an irresistible
drawcard for visitors coming from the cooler inland climates or the Northern Hemisphere”
(Brett et al, 2011, 288). However, the linear coastal development along much of the South
Coast, which has occurred since the latter half of the 20th century, does not always receive
such a positive commendation. One of the most popular coastal towns has been described
as, “a brash holiday town, Margate with its high-rise apartments, fast-food outlets and ice-
cream parlours, offers little in the way of undiscovered coves or hidden beaches” (Pinchuck et
al, 2010, 428). And the administrative town of Port Shepstone, in what appears to be a
backhanded compliment, is described as, “the nicest thing about Port Shepstone is that, unlike
many other towns and resorts along the coast, it has a ‘lived in’ look about it” (Oakes, 1991,
211). Ramsgate is described as, “the town now blurs into the beach metropolis of Margate”
(Reynierse, 1988, 209), and the ribbon of urban development along much of the South Coast
is referred to as, “the overall impression as you drive down the coast is of a long line of caravan
parks and holiday homes” (Kellett & Williams, 2008, 457).

In a recent study, Willemse and Goble (2018, 282-292) highlighted a number of issues relating
to the management of the KwaZulu-Natal coastal zone. The Integrated Coastal Management
Act (Act 24 of 2008, Act 32 of 2014) stipulates that the coast is a national asset, and that there
must be equitable access to the coast and its resources. The Act requires coastal
municipalities to set aside pieces of land which allow the public access to the coast.
Municipalities also are responsible for providing signage, protecting the rights of the public
and providing facilities which encourage coastal access. However, the province of KwaZulu-
Natal has yet to develop a coastal management plan (CMP) and is lagging behind other
coastal provinces, and many municipalities are struggling with the responsibilities placed on
them by the Act.

The authors state that nearly 60% of KwaZulu-Natal’s population resides within 100 kilometres
of the coast, and the coast is the leading domestic tourism destination in the province
(Willemse and Goble, 2018, 283). In 2016 the City of Durban, and the three coastal
municipalities of the South Coast, had an estimated population of 4.3 million occupying only

                                                                                                           4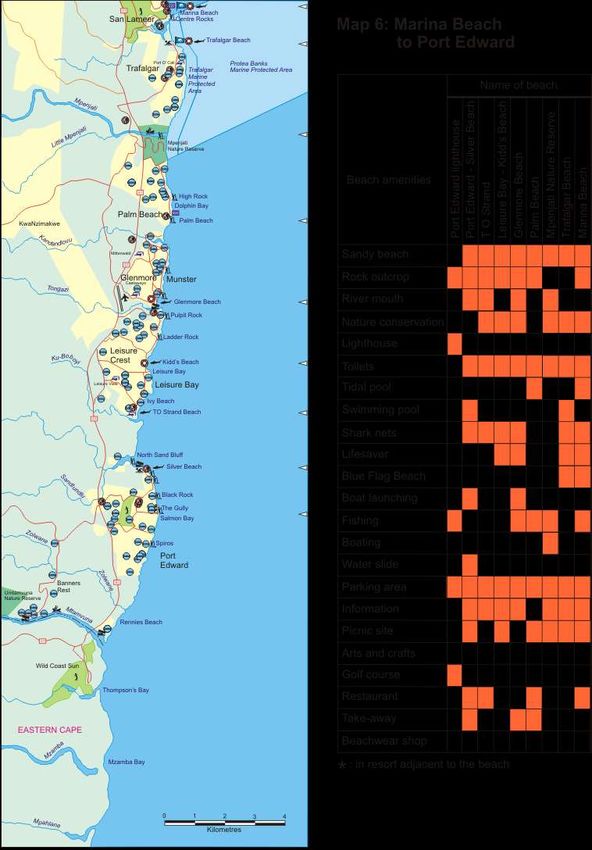
African Journal of Hospitality, Tourism and Leisure, Volume 8 (3) - (2019) ISSN: 2223-814X
              Copyright: © 2019 AJHTL /Author/s- Open Access- Online @ http//: www.ajhtl.com

6.6% of the province’s surface (Figure 3), which indicates that population densities in the
region are high for South Africa, even before the impact of tourism is calculated (Municipalities
of South Africa).

Prior to 1994, the 58 beaches of the South Coast (Figure 3), which are the focus of this study,
fell under the control of 29 separate local authorities. These local authorities have been
amalgamated into one metropolitan area and three municipalities, which has simplified tourism
planning and marketing in the region. As is the case in any tourist region in the world, a
geographic tourist destination which exists in the collective public consciousness may extend
across national, provincial or several municipal boundaries. Poorly co-ordinated planning, or
differing planning objectives and regulations, may result in differing approaches and outcomes
within the destination landscape, which may not be easily recognised by tourists as municipal
and regional boundaries tend to be invisible.

Fortuitously for the South Coast region, three of these four municipalities fall under the Ugu
District Municipality. Apart from the initial 50 kilometres of the coastline from Durban to
Umkomaas, which is administered by the eThekwini Metro, from north to south the
municipalities of Umdoni, Umzumbe and Ray Nkonyeni incorporate the remainder of the South
Coast coastline. These three municipalities cover an area of 3,702 km² and, with a population
estimated at 645,000 in 2016, had an average population density of 174 people per km²
(Municipalities of South Africa). There is, however, considerable population density variation
between municipalities. eThekwini Metro has an average population density of 1,448 per km²
compared to 124 per km² for Umzumbe, 145 per km² for Umdoni and 234 per km² for Ray
Nkonyeni Municipality (Municipalities of South Africa). Considerable population density
variation also exists within each municipality. For Ray Nkonyeni Municipality, the wards
incorporating coastal towns such as Margate and Port Shepstone have population densities
exceeding 860 people per km², compared to population densities as low as 62 per km² for the
ward immediately south of Oribi Gorge, and 85 people per km² for the ward including Port
Edward, adjacent agricultural land and the Umtamvuna Nature Reserve (Figure 3)
(Wazimaps).

Of significance, from the perspective of tourism planning and management, for the Ugu District
Municipality is the existence of a separate tourism entity, Ugu South Coast Tourism. This
organisation is tasked with identifying market gaps, identifying new tourist projects and
strategically marketing the district as a tourist destination (Ugu District Municipality, 2016, 44).

In its strategic plan for 2013-2017, Ugu South Coast Tourism articulated its mandate as:

         •  “Responsibly manage the tourism sector within the principles of transparency
            and accountability.
         • Establish and maintain tourism structures that accord with tourism legislation
            and regulations via appropriate communication and decision- making channels.
         • Create strong relationships in tourism with both state and private sector entities
            as well as the tourism trade.
         • Invest financial and human resources towards meeting its operational, marketing
            and development mandates.
         • Have a tourism environment that provides economic opportunity for all its
            communities.
         • Work within the principles that tourism leadership is provided by the Ugu
            South Coast Tourism as institution and driven by collaboration with the
            private sector/communities through its operational and constituted
            business model.”
         (Ugu South Coast Tourism Strategy, 2017, 15).
                                                                                                           5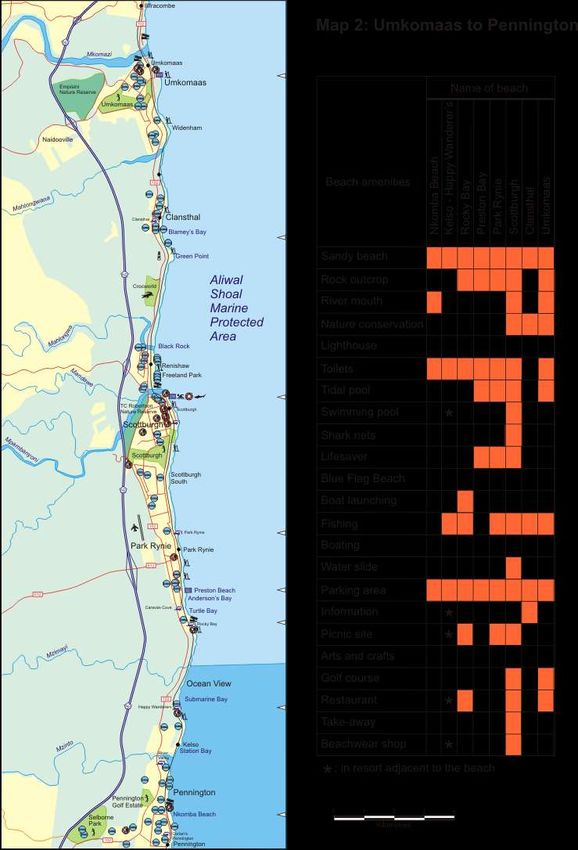
African Journal of Hospitality, Tourism and Leisure, Volume 8 (3) - (2019) ISSN: 2223-814X
              Copyright: © 2019 AJHTL /Author/s- Open Access- Online @ http//: www.ajhtl.com

One of Ugu District Municipality’s key objectives is to ensure that the four municipalities (three
of the municipalities are coastal) work collectively to ensure that the entire population benefits
from the core economic sectors of tourism and agriculture (Ugu District Municipality, 2016, 6).

Current value of tourism

In South Africa, domestic tourism accounts for 55.6% of the tourism industry, compared to a
global average of 72.7% (World Travel and Tourism Council, 2018e, 6; 2018f, 6). Tourism
KwaZulu-Natal estimates that in 2017 there were 4.26 million domestic tourist trips within the
province, together with the arrival of 783,962 foreign tourists. The average spend per person
for each domestic trip was estimated at R1,052 (Tourism KwaZulu-Natal, 2017, 6).
The Ugu District Municipality Integrated Development Plan states that although tourism
statistics for the region are not readily available from Statistics South Africa, nevertheless it is
estimated that domestic tourists contribute 79% and foreign tourists 21% of tourism revenue
for the region. The report quantified the number of domestic tourism trips per year, because
the assumption is made that domestic tourists may undertake more than one trip per year. In
the Ugu District Municipal area (Figure 3) it is estimated that 1.1 million domestic tourist trips
take place each year, which is more than one-quarter of all domestic tourist trips in KwaZulu-
Natal. If the purpose of each visit is analyzed, of interest is that domestic tourists recorded
“holiday” for 37% of visits, compared to a slightly lower figure of 27% for foreign tourists (Ugu
District Municipality, 2016, 86, 87). The total estimated economic benefit, derived from both
foreign and domestic tourists, was calculated at R4.4 billion in 2016.

In the South Coast region, at present tourism is concentrated in the coastal zone, which is
regarded as an inherent regional weakness by the integrated development plan (Ugu District
Municipality, 2016, 88). Although there is some potential to link the coastal zone with a number
of nature reserves in the interior, such as the Oribi Gorge and Umtamvuna nature reserves
(Figure 3), it is, however, acknowledged that a number of challenges presently frustrate the
extension of tourism facilities into the interior. These include significant differences in both the
quantity and standard of infrastructure and tourism product between the coastal zone and the
interior, a poorly diversified range of tourism products in the district with the emphasis being
overwhelmingly on coastal tourism, and a lack of skills amongst rural people, which make it
difficult for them to enter the tourism industry (Ugu District Municipality, 2016, 43, 88).

Although there are seven provincial nature reserves within Ugu District Municipality (Figure
3), these nature reserves are modest in size, and range in area from 17 hectares to 3,257
hectares. Furthermore, these nature reserves do not contain large congregations of wildlife
or the Big Five species, and a number were set aside to protect rugged landscape features
and therefore tend to be focused on high-energy, niche market activities, such as hiking, and
therefore have limited potential for absorbing large numbers of tourists. (Pooley & Player,
1995, 30, 38, 41, 42; Ugu District Municipality, 2016, 24). Despite the many vegetation types
represented within the region, many particularly rich in biodiversity, these nature reserves
conserve only 1.76% of the land, which is far below international norms (Mucina and
Rutherford, 2006, 771, 790; Ugu District Municipality, 2016, 23).

The Integrated Development Plan also makes mention of Blue Flag beaches and adventure
tourism activities, such as scuba-diving on the Aliwal Shoal, which is ranked as one of the top
diving destinations in the world and an activity which has grown significantly in popularity since
the 1980s (Lucrezi et al, 2013, 384; Ugu District Municipality, 2016, 83). The recent extension
of the Aliwal Shoal Marine Protected Area in November 2018, will help support the scuba-
diving industry and protect ragged-tooth-, tiger- and blacktip- sharks (Guy, 2018).

                                                                                                           6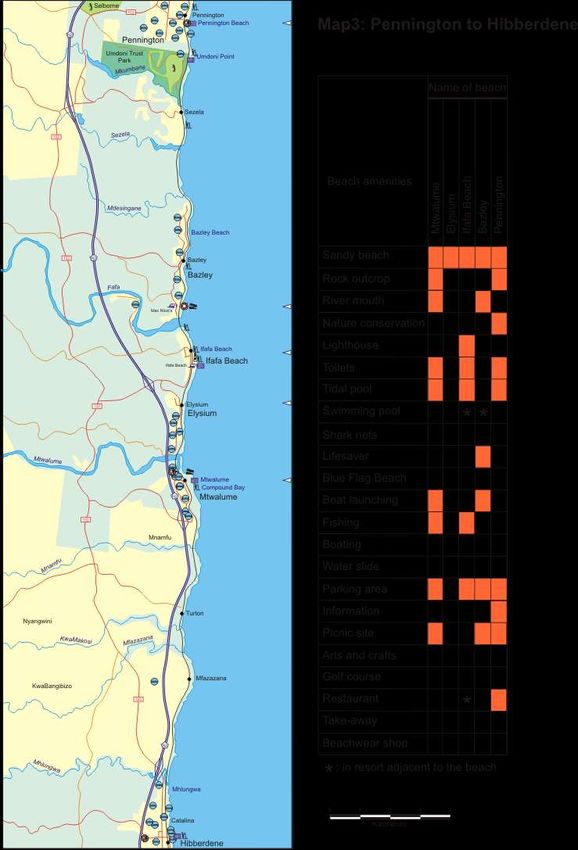
African Journal of Hospitality, Tourism and Leisure, Volume 8 (3) - (2019) ISSN: 2223-814X
              Copyright: © 2019 AJHTL /Author/s- Open Access- Online @ http//: www.ajhtl.com

Negative impacts of coastal tourism and beach carrying capacity

In virtually every nation on earth, the coastline is regarded as a limited natural resource and a
concentration of coastal tourism resorts, or poor physical planning, can impact negatively on
the viability of coastal tourism, and the quality and functioning of the natural environment.
Garcia and Servera (2003, 298) argued that on the Spanish island of Mallorca, “insufficient
control of urban planning, overcrowded beaches, and massive construction on the coastal zone
has led to degradation processes over the beach-dune system. More beaches have been
transformed to urban beaches and the coastline has retreated.”

               Figure 3: Location of South Coast region on KwaZulu-Natal indicating seaside towns, current
               municipal boundaries and main access roads
                                                                                                             7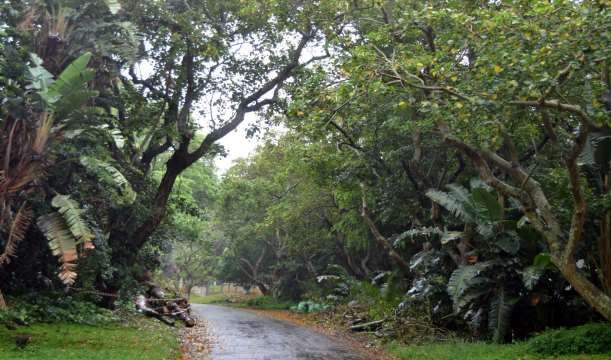
African Journal of Hospitality, Tourism and Leisure, Volume 8 (3) - (2019) ISSN: 2223-814X
             Copyright: © 2019 AJHTL /Author/s- Open Access- Online @ http//: www.ajhtl.com

In an earlier study, Smith (1992, 34) documented the rapid coastal development which has
occurred in Pattaya, Thailand, and concluded that, “the natural tree cover has been removed
to be replaced by a garish mixture of building types and styles, roads, overhead wires and a
maze of signboards.”

If beaches are negatively impacted by uncontrolled coastal tourism, the logical conclusion is
that there must be a quantifiable measure of visitor carrying capacity for each beach, beyond
which the environmental health of the beach will be negatively impacted. The carrying
capacity of a beach is therefore a theoretical maximum number of visitors which can be
accommodated without reducing conditions below a predetermined standard. Beach
carrying capacity, therefore, should be an important measurement as there are many
examples where beaches have been degraded by overcrowding and resultant environmental
degradation (Smith, 1992, 34; Garcia and Servera, 2003, 298). However, studies of beach
carrying capacity suggest that it is not a simple measurement and is not easily quantified, and
also differs from country to country. The calculation of beach carrying capacity is, therefore,
not simply determined by dividing the area of beach sand available by the number of beach
users. Perceptions of beach crowding also differ substantially from country to country, as in
the examples of the Gold Coast of Australia compared to German beaches (Williams and
Lemckert, 2007, 23; Haller et al, 2011, 75).

Silva et al (2007, 136) argue that beach carrying capacity determinations should therefore
take into account three main factors:

          • Surroundings – accessibility, parking area, local accommodation, infrastructure
            and facilities;

          • Beach – access, depth, sea frontage, tidal range, bathing conditions;

          • External factors – climate, season, date, time and users’ expectations

Previous beach rating studies

A number of previous studies have sought to develop a beach rating system which could
inform any determination of beach carrying capacity. Leatherman (1997) developed a beach
rating system based on 50 criteria which were grouped under the three factors of:
physical, biological, and human use and impacts. Using the system, a total of 650 beaches
in the USA were surveyed and ranked (Leatherman, 1997, 1150).

Morgan (1999) researched beach user preferences and priorities by examining 50 aspects
and gathered 859 questionnaires at 23 beaches in Wales. The researcher recorded important
differences in the rating of beach amenities, depending on the beach user surveyed. Some
beach users indicated a preference for undeveloped beaches, while others showed a
preference for traditional beach resorts.

Williams and Lemckert (2007, 21-24) adapted a questionnaire that was developed earlier in
Portugal by Da Silva (1998) and applied it to the beaches of the Gold Coast of Australia. A
total of 160 interviews were conducted, and four questions from the 25-question-survey related
to beach user perceptions of beach crowding. Of the respondents, 37% stated that believed
that there were too many people on the beach. Privacy was considered an important factor
by 81% of respondents, who were asked to rate six photos of different beaches. Beaches
which lacked privacy, and contained large crowds, were given a low rating by respondents.

                                                                                                          8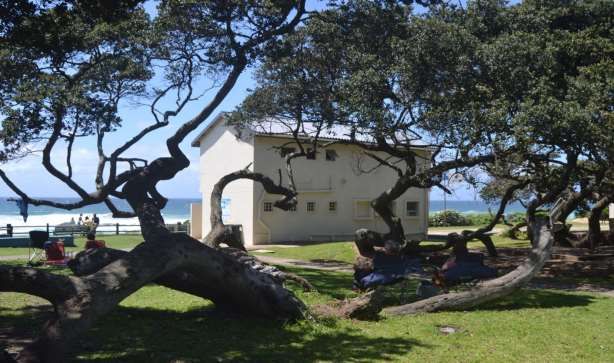
African Journal of Hospitality, Tourism and Leisure, Volume 8 (3) - (2019) ISSN: 2223-814X
              Copyright: © 2019 AJHTL /Author/s- Open Access- Online @ http//: www.ajhtl.com

The survey suggested that an absence of crowds is important to Australian beach users, but
this does not automatically apply to tourists in other countries.

A study by Klein and Osleeb (2010, 1149-1156) examined beach quality along the Florida
coast in the USA. The authors found that beach nourishment projects, funded by three
levels of government, had had a positive impact on coastal tourism revenue. Of
importance is that the authors examined the impact on three distinct market segments:
the captive (or local) market, the non-captive domestic market, and the international
market.

Semeoshenkova and Williams (2011), in a study of beaches in the Sotavento Algarve of
Portugal, used the Bathing Area Registration and Evaluation framework (BARE) framework
devised by Micallef and Williams ( 2004). The BARE framework identifies five types of
beaches, and evaluates beaches in terms of the criteria considered important to beach users.
An example of each of the five beach types was identified and each beach was evaluated.
Five parameters were used: safety, water quality, facilities, scenery and litter. Each beach
was allotted a score for each of these parameters from A to D, and the cumulative scores then
resulted in a rating of one- to five- stars (Semeoshenkova and Williams, 2011, 1283).

Williams (2011, 10) examined the results of 2,984 questionnaires completed by beach users
in Wales, Florida, Spain, Malta and Turkey. Respondents were divided between local beach
users and tourists, and the results suggest that not all visitors desire the same amenities.
Beach users who were visiting remote beaches did not expect life guards, but water quality
and safety were rated as the most important parameters.

The Beach Health Index system was developed and rates beaches using factors relating to
what is considered to be the three main functions of beaches, namely: providing natural habitat
for wildlife, protecting the land and offering recreation opportunities (Ariza et al, 2010).
Because it can monitor changes to beaches over time, the system can be used to assess the
effectiveness of management actions. The Gold Coast Beach Health Index in Australia made
use of previous studies (Todd and Bowa (2016, 710). The researchers summarised Beach
Health indicators from other studies and categorised them under six major indicators: clean
water and sand, bathing safety, scenic surroundings, facilities, beach width and beach
crowding. On the Gold Coast, respondents rated the optimal beach width to be 35 metres
(Todd and Bowa, 2016, 713). On Australian beaches perceptions of overcrowding were
observed at visitor density rates that are far lower than for similar research on European
beaches (Haller et al, 2011, 75).

A three-year research project funded by the British Council interviewed more than one
thousand beach users in the United Kingdom, Turkey and Malta. From the interviews, 26
parameters, 18 physical and 8 human, were identified and later ranked using further beach
interviews (Anfuso et al, 2017, 171). Based on the parameters, coastal scenery was divided
into five distinct classes. Anfuso et al (2017, 175, 176) applied the 26 parameters to assess
100 beaches in Cuba. Since the initial study, more than 4,000 evaluations have been
conducted in Spain, Portugal, Croatia, Morocco, New Zealand, Fiji, Australia, USA, China,
Japan, Pakistan, Brazil and Colombia (Anfuso et al, 2017, 177).

The environmental attributes of a beach have been highlighted in a number of studies, and
can include the physical properties of the beach, ocean currents and water quality and climatic
factors such as prevailing winds and weather (Williams and Lemckert, 2007, 23;
Semeoshenkova and Williams, 2011, 1283). Decisions to visit a particular beach will also be
affected by the presence or absence of certain beach amenities, such as parking areas,
ablutions, shark nets, recreation opportunities and other beach-related facilities such as picnic
areas and food outlets (Williams, 2011, 10).

                                                                                                           9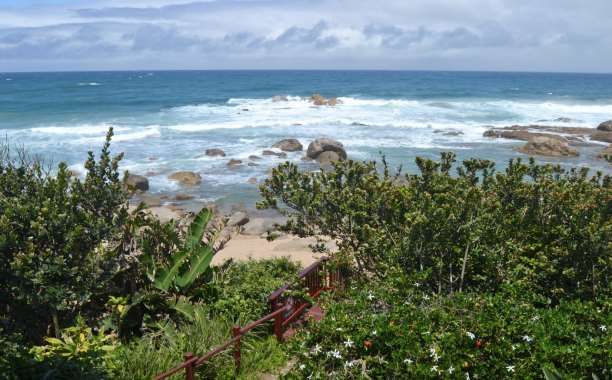
African Journal of Hospitality, Tourism and Leisure, Volume 8 (3) - (2019) ISSN: 2223-814X
Copyright: © 2019 AJHTL /Author/s- Open Access- Online @ http//: www.ajhtl.com
Figure 4: Proposed beach utilisation framework
Based on the literature, the complex, diverse and at times inter-related factors which influence
beach choice are depicted in a proposed beach utilisation framework (Figure 4). Demographic
characteristics, such as the age of beach users, income levels, purpose of the visit and travel
behaviour, will combine with mode of transport and knowledge of and familiarity with the beach
to influence the choice of a beach. The definition of travel behaviour refers to frequency of
visits and the size of each group (Lucrezi and Saayman, 2015, 1483; Saayman and Saayman,
2017, 1444). A local resident who goes for a walk on the beach every day has different
requirements and perceptions than do a group of holiday-makers who are spending a week
at the coast. Beach users who do not own their own vehicles will be more restricted in their
choice of a beach, and this will be a major factor for the domestic market in South Africa.
Socio-demographic factors, together with environmental factors and the array of amenities
available will influence the decision to visit a particular beach. For some beach users, the
absence of too many facilities will exert a positive influence as some visitors’ desire less-
crowded and developed beaches (Williams and Lemckert, 2007, 23; Lucrezi and Saayman,
2015, 1482; Saayman and Saayman, 2017, 1437). The beach user’s perceptions of the beach
will, in turn, be filtered by a number of perceptive lenses, which will impact on the quality of
the experience (Figure 4). The cumulative experience, on the day of the visit itself, will in turn
modify the perception of the beach, which will then influence future decisions relating to the
choice of a beach.
Methodology
In a study by Garcia and Servera (2003, 293, 296) 41 sandy beaches on the Spanish island
of Mallorca were surveyed and mapped. The researchers tabulated the impact of 13 human
activities on the functioning of the beach-dune system, and allocated 11 icons relating to
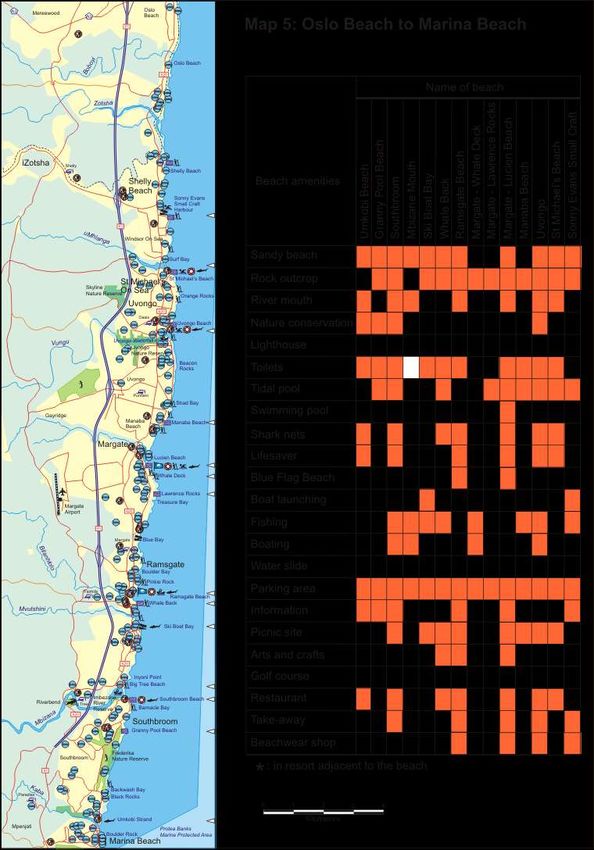
coastal tourism amenities in the legend for each of the 41 beaches. This paper is partly based
on the research by Garcia and Servera (2003), except that the 16 icons depicted on Maps 1-
6 for the South Coast region were plotted accurately on each map.
10African Journal of Hospitality, Tourism and Leisure, Volume 8 (3) - (2019) ISSN: 2223-814X
Copyright: © 2019 AJHTL /Author/s- Open Access- Online @ http//: www.ajhtl.com
Some previous studies have combined environmental attributes and management aspects,
such as safety and security and the provision of services (Leatherman, 1997; Semeoshenkova
and Williams, 2011; Williams, 2011; Todd and Bowa, 2016; Anfuso et al, 2017).
The South Coast region was mapped using 1:50,000 and 1:100,000 maps, supported by
Google Earth Pro, and this exercise was followed by ground-truthing to record the amenities
for each of the 58 beach surveyed. Ground-truth data was supplemented by information on
shark net position, ski boat launching sites and popular fishing spots (KwaZulu-Natal Sharks
Board; Mann et al, 2018; South Coast Fishing Hot Spots).
The primary objective of this study was therefore to document and map the current tourist
amenities associated with the beaches of the South Coast region. The secondary objective
was to evaluate each of the 58 beaches and to score the beaches against eight categories,
which were determined by grouping environmental features and tourism amenities. High
quality, PDF-format versions of the six detailed maps are available on open-access at the
following hyperlink for use by researchers and tourism planners:
https://drive.google.com/drive/folders/10HIxuM70oF6S36yP1Fx9gws7XyIa4Kma?usp=shari
ng
In a recent study of the coastline of KwaZulu-Natal (Willemse & Goble, 2018, 288) a total of
921 access points, of which 92% are pedestrian, were identified along the South Coast. In
addition, 67 formal parking lots, 20 informal parking lots and 29 tidal pools were recorded.
In this current study, only beaches which can be accessed by motor vehicle were surveyed
because the study is concerned with the distribution of coastal tourism amenities in the South
Coast region, and amenities such as ablution facilities and restaurants cannot be serviced if
there is no vehicular access. The assumption was made that pedestrian access paths will
largely be utilised by local residents, and will therefore fall outside of the definition of tourism.
However, it is possible that in some cases tourists could make use of pedestrian access points.
This is, however, not a limitation to this study as beaches which are undeveloped, and where
no facilities exist, were omitted from the study. These beaches were omitted because the
primary objective of the study is to document the current distribution of beach amenities in the
region, and to evaluate these amenities. A pedestrian footpath leading to one of the beaches
surveyed, will not undermine the validity of the research if the beach can still be accessed by
vehicular transport (Willemse and Goble, 2018).
The United Nations Statistics Division’s system of International Standard Industrial
Classification (ISIC), categorises businesses by the type of economic activity that they are
engaged in. Tourism accommodation and food-and-beverage serving businesses are
assigned the codes 641 and 642, respectively by Statistics South Africa (the activities prefixed
with 631, 632, 633, 634, 721 and 722 on the ISIC classification list) and are considered to be
part of the tourism industry, because at certain times of the year they attract tourists (Keyser,
2011, 196-199). Tourist accommodation and restaurants were therefore included in this study.
After a desktop mapping exercise, the 58 beaches were visited to assess the current status of
amenities on offer. Given our current standards of aerial technology, it was impossible to
obtain an accurate picture of tourist amenities for each beach without on-the-ground
verification.
In this study, the 23 criteria listed on Maps 1-6 are a combination of environmental attributes
and beach amenities. The information gathered for all beaches was then grouped under the
eight categories listed on Table 1, and a cumulative score for each beach was calculated. To
guard against allocating a subjective rating for each beach, which has occurred in some
11African Journal of Hospitality, Tourism and Leisure, Volume 8 (3) - (2019) ISSN: 2223-814X
Copyright: © 2019 AJHTL /Author/s- Open Access- Online @ http//: www.ajhtl.com
previous studies, the individual beach scores were quantified according to the criteria listed
on Table 1. Individual scores for the 58 beaches are presented on Table 2 and Figure 5.
Table 1: Rating criteria used for amenities for the beaches of the South Coast, KwaZulu-Natal,
depicted on Maps 1-6.
characteristics
Environmental
Beach-related
entertainment
Restaurant or
Signage and
Parking and
information
Safety and
conditions
swimming
Ablutions
takeaway
Security
access
Rating
Safe
0 Rocky and No Remote No toilets, or Difficult to No shark No No additional
rugged beach parking beach with derelict, locate the nets and restaurant facilities, or
and very or on no vandalised or beach and no unprotected or located only in a
narrow sandy adjacent personnel locked ablutions clear signage bathing takeaway resort adjacent
beach ofAfrican Journal of Hospitality, Tourism and Leisure, Volume 8 (3) - (2019) ISSN: 2223-814X
Copyright: © 2019 AJHTL /Author/s- Open Access- Online @ http//: www.ajhtl.com
Furthermore, the Blue Flag award includes adherence to an international standard of water
quality, and the award signifies to the public that the beach is clean, safe and healthy
(Department of Tourism). For this reason, eThekwini was only awarded two Blue Flag in 2018
due to unacceptable levels of water pollution caused by sewage, and the city was withdrawn
from the Blue Flag Beach programme in 2008 by city manager, Mike Sutcliffe. Although the
decision was reversed in 2013, the city was only awarded two Blue Flag beaches in 2018,
compared to the ten Blue Flag beaches which the city was previously awarded (Carnie, 2018).
Unacceptably high sewage contamination levels in the sea, resulting from polluted river and
stormwater discharges, disqualify most of Durban’s beaches from the stringent Blue Flag
criteria. In 2015 a researcher from the University of KwaZulu-Natal, Katelyn Johnson, found
that water quality at most of the city’s beaches had deteriorated during the previous decade
and concluded that, “it is unlikely that Durban will be a Blue Flag coastline in the immediate
future… Durban’s coastline will constantly face challenges due to urban and industrial
developments‚ the presence of many waste-water (sewage) treatment works and informal
settlements along the rivers‚ and the presence of numerous stormwater drains” (Carnie, 2018).
Table 2: Assessment of tourist amenities at the beaches of the South Coast, KwaZulu-Natal
Safe swimming
characteristics
Environmental
Beach-related
entertainment
Restaurant or
Map number
Signage and
Parking and
information
Total score
conditions
Safety and
Ablutions
takeaway
Beach name (north to south)
Security
access
Isipingo 1 3 3 3 2 1 3 2 1 18
Pipeline Beach 1 3 3 3 3 1 3 2 2 20
Inyoni Rocks 1 3 3 3 3 1 3 3 3 22
Amanzimtoti Mouth 1 3 3 3 0 0 0 1 0 10
Doonside North 1 3 2 2 2 2 0 1 1 13
Doonside 1 3 3 3 2 2 3 0 0 16
Warner Beach 1 3 3 1 2 2 2 3 1 17
Safe swimming
characteristics
Environmental
Beach-related
entertainment
Restaurant or
Map number
Signage and
Parking and
information
Total score
conditions
Safety and
Ablutions
takeaway
Security
access
St Winifred’s 1 3 3 1 2 2 0 1 0 12
Winklespruit 1 3 3 3 3 2 3 1 1 19
Illovo Beach 1 3 0 1 0 2 3 1 0 10
Umgababa 1 3 2 2 2 2 3 1 1 16
Umkomaas 2 2 3 3 2 1 2 3 1 17
Clansthal 2 3 2 1 0 3 0 0 0 9
Scottburgh 2 3 3 3 3 2 3 3 3 23
Park Rynie 2 2 3 3 2 2 2 1 2 17
Preston Bay 2 2 2 2 2 2 2 1 1 14
Rocky Bay 2 3 2 1 2 2 0 1 1 12
Kelso - Happy Wanderers 2 3 1 1 2 2 0 1 0 10
Nkomba Beach 2 3 1 0 1 1 0 0 0 6
Pennington 3 3 3 3 3 3 2 3 1 21
Bazley 3 3 1 1 2 2 3 0 1 13
Ifafa Beach 3 3 1 0 2 1 2 1 0 10
Elysium 3 3 0 0 0 0 0 0 0 3
Mtwalume 3 3 2 1 2 2 2 1 1 14
Hibberdene 4 3 3 3 3 3 3 3 2 23
13African Journal of Hospitality, Tourism and Leisure, Volume 8 (3) - (2019) ISSN: 2223-814X
Copyright: © 2019 AJHTL /Author/s- Open Access- Online @ http//: www.ajhtl.com
Umzumbe 4 3 1 2 3 3 3 1 1 17
Pumula - Cracker Bay 4 3 1 0 0 0 0 0 0 4
Banana Beach 4 3 1 2 2 1 3 3 0 15
Sunwich Port 4 3 2 3 2 2 3 3 1 19
Bendigo 4 3 0 0 0 0 2 0 0 5
Southport 4 3 3 3 3 3 3 3 1 22
Sea Park 4 3 0 0 0 0 0 1 0 4
Umtentweni 4 3 3 3 3 3 3 3 1 22
Port Shepstone – Lucky Dip 4 3 3 2 2 2 2 3 2 19
Port Shepstone - Mbango 4 3 2 2 2 2 0 1 2 14
Sonny Evans Small Craft 5 3 3 1 2 2 2 2 2 17
St Michael’s Beach 5 3 3 3 2 2 3 3 1 20
Uvongo 5 3 3 3 2 2 3 3 2 21
Manaba Beach 5 1 2 2 2 2 2 1 1 13
Margate – Lucien Beach 5 3 3 3 3 3 3 3 3 24
Margate – Whale Deck 5 0 2 0 1 0 0 1 0 4
Margate – Lawrence Rocks 5 2 2 1 0 1 2 1 0 9
Ramsgate Beach 5 3 3 3 3 3 3 3 3 24
Whale Back 5 1 2 2 2 2 2 3 1 15
Ski Boat Bay 5 3 2 2 2 2 3 1 1 16
Mbizane Mouth 5 3 2 1 0 0 0 0 0 6
Southbroom 5 3 3 3 2 3 3 3 1 21
Granny Pool Beach 5 1 2 1 2 3 2 1 0 12
Umkobi Beach 5 3 2 2 2 3 3 1 0 16
Marina Beach 6 3 3 2 3 3 3 3 1 21
Trafalgar Beach 6 3 2 2 3 3 3 1 2 19
Mpenjati Nature Reserve 6 3 2 2 3 3 0 0 1 14
Palm Beach 6 2 2 1 2 2 2 3 1 15
Glenmore Beach 6 3 2 2 2 3 3 2 1 18
Leisure Bay – Kidd’s Beach 6 2 2 2 2 3 3 1 1 16
TO Strand 6 3 1 2 2 3 3 1 0 15
Port Edward – Silver Beach 6 3 3 2 2 3 3 3 3 22
Port Edward lighthouse 6 1 0 0 0 0 0 1 0 2
Average score 2.69 2.10 1.83 1.86 1.90 1.97 1.59 0.97 14.93
Spearman’s correlation was used to assess the relationship between beach scores and
distance from the City of Durban. The null hypothesis is that there is no relationship between
beach score and distance from the city.
Sum of X = 5617
Sum of Y = 866
Mean of X = 96.8448
Mean of Y = 14.93
rs = 0.04029, p (2-tailed) = 0.76393
The alternative hypothesis is that there is a positive correlation between these two data. The
scatter plot (Figure 5) shows that there is a very weak relationship between beach score and
distance (rho= 0.04, pAfrican Journal of Hospitality, Tourism and Leisure, Volume 8 (3) - (2019) ISSN: 2223-814X
Copyright: © 2019 AJHTL /Author/s- Open Access- Online @ http//: www.ajhtl.com
Figure 5: Scatter plot for the 58 beaches of the South Coast surveyed indicating individual scores
and distance from the City of Durban. Main access roads, municipal boundaries and Blue Flag
beaches are indicated.
The high standard of the N2 and R61 access roads (Figure 13) provides rapid access to the
coastal resort towns of the South Coast. However, this high infrastructural standard does not
continue beyond the provincial border into the Eastern Cape province, where the former
homeland of Transkei extends south of the Umtamvuna River. The disparities in wealth,
property ownership and resultant economic development which existed under apartheid
(Christopher, 1994, 73, 80, 90; Willemse and Goble, 2018, 283) have produced striking spatial
disparities at provincial level and within individual municipalities. The absence of development
within the former Transkei homeland resulted in this coastline being referred in popular tourist
literature as, “The Wild Coast” (Butchard, 1989, 4; Pinchuck et al, 2010, 332; Reynierse, 1988,
192; Steyn, 1987, 196). Established as one of two reservations for isiXhosa-speaking people,
the Transkei was the first homeland to be granted independence in 1976 by the apartheid
government, although this was not internationally recognised (Christopher, 1994, 69, 95; Brett,
2012, 230).
In the former Transkei there is, therefore, a paucity of coastal and other agricultural
development along a coastline which extends for 255 kilometres from the Umtamvuna River
to the Kei River (Butchard, 1989, 4; Pinchuck et al, 2010, 332). At present, all of the coastal
resort towns of the South Coast are therefore concentrated along 170 kilometres of the
KwaZulu-Natal coastline, with the exception of the Wild Coast casino hotel built just across
the border at a time when gambling was illegal in South Africa (Map 6). The entire South
Coast region is therefore easily accessible, and less than two hours by motor vehicle from the
City of Durban, and distance from the city is not a negative influence. It must be stressed that
this finding comes to an abrupt halt on the banks of the Umtamvuna River, as in the Eastern
Cape there is at present no coastal access road and only two small coastal towns along the
entire “Wild Coast.”
15African Journal of Hospitality, Tourism and Leisure, Volume 8 (3) - (2019) ISSN: 2223-814X
Copyright: © 2019 AJHTL /Author/s- Open Access- Online @ http//: www.ajhtl.com
Discussion - over-crowding or under-management?
Haller et al (2011, 72, 75) discussed the importance of coastal tourism in two states in the
Baltic region of Germany, where tourism accounts for 11% of GNP. The beach capacity norm
that is accepted internationally specifies 10 m² of beach per visitor, and this figure is exceeded
during busy holiday periods. If beaches are too crowded, visitors may avoid the beach during
peak times or may choose to visit another beach.
There is considerable literature available on the Blue Flag award (Petroman et al, 2010;
Morton, 2012; Lucrezi and Saayman, 2015; Lucrezi and van der Merwe, 2015; Klein and
Dodds, 2017; Saayman and Saayman, 2017). The seven Blue Flag beaches along the South
Coast achieved an average score of 21.4, compared to an average score of 14.93 for all 58
beaches. The Blue Flag beaches, however, were not the only high-scoring beaches and an
additional nine beaches achieved a score of 20 points or higher. Taking two Blue Flag
beaches in the study area as an example, Lucien and Ramsgate, the area of beach available
at low tide is 104,000 m² and 24,000 m². This translates into sufficient space for 10,400 and
2,400 beach visitors on the two beaches, respectively, and only during peak holiday periods
would these densities be exceeded.
Although the Blue Flag award can be used as a powerful marketing tool, Lucrezi and van der
Merwe (2015, 1136, 1138) found that the presence of the Blue Flag award was not the main
determinant of beach choice, as the award does not take all aspects which affect beach choice
into account. In some instances, the Blue Flag award will not attract visitors who prefer fewer
amenities (Lucrezi and Saayman, 2015, 1487). In Canada, Klein and Dodds (2107, 11) found
that an absence of the Blue Flag award did not negatively affect tourist numbers. However,
Saayman and Saayamn (2017, 1445) argue that as safety is an important consideration for
beach users in South Africa, this aspect should be used to better market Blue Flag beaches.
As seawater quality is an important criteria for the Blue Flag award, it can be compromised by
untreated sewage entering rivers from communities along river banks. Given the high
population densities in the region, it is essential that the municipalities impliment adequate
water and sanitation projects if the future of tourism is to be guaranteed (Ugu District
Municipality, 2016, 32)
Conclusion
In total, 58 beaches were assessed along the South Coast, or an average of one beach for
every 2.93 kilometres of coastline, preliminary results suggest that additional beach amenities
could be established in the South Coast region. Perceptions of over-crowding may have more
to do with limited beach amenities than with actual visitor numbers, and the beaches with the
greatest array of amenities were observed to attract the highest number of visitors.
In a recent key report on the Indian Ocean Rim Association nations by Rogerson et al (2018)
the authors stress that coastal tourism is not a homogenous category. They also make the
point that mass tourism to beach resorts does not usually incorporate local entrepreneurs.
The researchers argue that certain forms of coastal tourism are better suited for encouraging
local community participation. The example of budget tourism is presented, because this
sector is often neglected in tourism planning at the expense of international tourists. By
targeting budget tourism, local skills can be easily built in communities and local self-reliance
increased (Rogerson et al, 2018, 14).
It would be unwise to treat the South Coast region as a homogenous tourist destination and
to apply a “one size fits all approach” to the future development of coastal tourism. Given the
range of possibilities, it would appear that several options are still available to tourism
planners. In future, increasing numbers of tourists can be accommodated by expanding and
upgrading facilities at some of the high-scoring beaches (see Figures 6, 7, 10, 11, 12, 22),
16African Journal of Hospitality, Tourism and Leisure, Volume 8 (3) - (2019) ISSN: 2223-814X
Copyright: © 2019 AJHTL /Author/s- Open Access- Online @ http//: www.ajhtl.com
while at the same time retaining some of the less developed beaches to cater for certain beach
users. Given its high international profile, easily recognisable symbol and ease of use as a
marketing tool, it is recommended that consideration should be given to extending the Blue
Flag award to other beaches in the region.
IMAGES ETC FOLLOW ON NEXT PAGE.
17African Journal of Hospitality, Tourism and Leisure, Volume 8 (3) - (2019) ISSN: 2223-814X
Copyright: © 2019 AJHTL /Author/s- Open Access- Online @ http//: www.ajhtl.com
18African Journal of Hospitality, Tourism and Leisure, Volume 8 (3) - (2019) ISSN: 2223-814X
Copyright: © 2019 AJHTL /Author/s- Open Access- Online @ http//: www.ajhtl.com
19African Journal of Hospitality, Tourism and Leisure, Volume 8 (3) - (2019) ISSN: 2223-814X
Copyright: © 2019 AJHTL /Author/s- Open Access- Online @ http//: www.ajhtl.com
20African Journal of Hospitality, Tourism and Leisure, Volume 8 (3) - (2019) ISSN: 2223-814X
Copyright: © 2019 AJHTL /Author/s- Open Access- Online @ http//: www.ajhtl.com
21African Journal of Hospitality, Tourism and Leisure, Volume 8 (3) - (2019) ISSN: 2223-814X
Copyright: © 2019 AJHTL /Author/s- Open Access- Online @ http//: www.ajhtl.com
22African Journal of Hospitality, Tourism and Leisure, Volume 8 (3) - (2019) ISSN: 2223-814X
Copyright: © 2019 AJHTL /Author/s- Open Access- Online @ http//: www.ajhtl.com
23African Journal of Hospitality, Tourism and Leisure, Volume 8 (3) - (2019) ISSN: 2223-814X
Copyright: © 2019 AJHTL /Author/s- Open Access- Online @ http//: www.ajhtl.com
24African Journal of Hospitality, Tourism and Leisure, Volume 8 (3) - (2019) ISSN: 2223-814X
Copyright: © 2019 AJHTL /Author/s- Open Access- Online @ http//: www.ajhtl.com
Figure 6: Inyoni Rocks, in Amanzimtoti (Map 1), is one of the most developed beaches of the South Coast
Source: Author’s own
Figure 7: Completed in the 1980s with provincial funding, Pipeline Beach (Map 1) alleviates some of the
pressure on the beaches of Amanzimtoti. Source: Author’s own
25African Journal of Hospitality, Tourism and Leisure, Volume 8 (3) - (2019) ISSN: 2223-814X
Copyright: © 2019 AJHTL /Author/s- Open Access- Online @ http//: www.ajhtl.com
Figure 8: Access to Illovo Beach (Map 1) is restricted by the railway line and adjacent, high-rise coastal
developments in Kingsburgh. Source: Author’s own
Figure 9: The electrification of the railway just inland of the coastal dunes was completed in 1970, but the
railway poses a number of access challenges and has limited coastal development along portions of the
South Coast between Durban and Port Shepstone. Source: Author’s own
26African Journal of Hospitality, Tourism and Leisure, Volume 8 (3) - (2019) ISSN: 2223-814X
Copyright: © 2019 AJHTL /Author/s- Open Access- Online @ http//: www.ajhtl.com
Figure 10: Previously reserved for black visitors only, facilities at Umgababa (Map 1) are being improved
by the construction of a new swimming pool by eThekwini Metro. Source: Author’s own
Figure 11: Scottburgh (Map 2), at the mouth of the Mpambanyoni River, is one of the most popular
seaside resort towns of the South Coast. Source: Author’s own
27African Journal of Hospitality, Tourism and Leisure, Volume 8 (3) - (2019) ISSN: 2223-814X
Copyright: © 2019 AJHTL /Author/s- Open Access- Online @ http//: www.ajhtl.com
Figure 12: Pennington (Map 3) is a forested town located 70 km south of central Durban and the main
beach is complemented by three golf courses in the vicinity. Source: Author’
Figure 13: The N2 and R61 highways provides rapid access to the South Coast seaside towns for 150
km from Durban to Southbroom. Source: Author’s own
28African Journal of Hospitality, Tourism and Leisure, Volume 8 (3) - (2019) ISSN: 2223-814X
Copyright: © 2019 AJHTL /Author/s- Open Access- Online @ http//: www.ajhtl.com
Figure 14: Bazley Beach (Map 3) on the Fafa River, has not been subjected to some of the development
pressures visible along much of the South Coast, as there is no direct access road along the coast
connecting the village to adjacent coastal towns. Source: Author’s own
Figure 15: Sub-standard and poorly maintained picnic and parking facilities at Ifafa Beach (Map 3).
Source: Author’s own
29African Journal of Hospitality, Tourism and Leisure, Volume 8 (3) - (2019) ISSN: 2223-814X
Copyright: © 2019 AJHTL /Author/s- Open Access- Online @ http//: www.ajhtl.com
Figure 16: Development of the Blue Fag beach at Hibberdene (Map 4) is partly restricted by the close
proximity of the railway. Source: Author’s own
Figure 17: The Blue Flag beach at Umzumbe (Map 4) occupies the beach stretching north of the rocky
outcrop of Stiebel Rocks. Source: Author’s own
30African Journal of Hospitality, Tourism and Leisure, Volume 8 (3) - (2019) ISSN: 2223-814X
Copyright: © 2019 AJHTL /Author/s- Open Access- Online @ http//: www.ajhtl.com
Figure 18: Facilities at the Blue Flag beach at Southport (Map 4) include a picnic site located under
milkwood trees and the adjacent Captain’s Anchor restaurant. Source: Author’s own
Figure 19: Umtentweni (Map 4) is the closest shark-net-protected beach to the administrative and
industrial town of Port Shepstone. Source: Author’s own
31African Journal of Hospitality, Tourism and Leisure, Volume 8 (3) - (2019) ISSN: 2223-814X
Copyright: © 2019 AJHTL /Author/s- Open Access- Online @ http//: www.ajhtl.com
Figure 20: Margate’s Lucien, a Blue Flag beach, (Map 5) covers 104,000 m² and is the closest coastal
resort town to the only regional airport located on the South Coast. Source: Author’s own
Figure 21: Informal traders at Ramsgate, a Blue Flag beach (Map 5). Informal traders were recorded at
nine beaches during the survey of the South Coast. Source: Author’s own
32African Journal of Hospitality, Tourism and Leisure, Volume 8 (3) - (2019) ISSN: 2223-814X
Copyright: © 2019 AJHTL /Author/s- Open Access- Online @ http//: www.ajhtl.com
Figure 22: Southbroom Beach (Map 5) occupies a large sandbar at the mouth of the Mbizana River.
Source: Author’s own
Figure 22: A wooden walkway provides access to Granny Pool Beach (Map 5) at Southbroom. Source:
Author’s own
33African Journal of Hospitality, Tourism and Leisure, Volume 8 (3) - (2019) ISSN: 2223-814X
Copyright: © 2019 AJHTL /Author/s- Open Access- Online @ http//: www.ajhtl.com
Figure 23: Adjoining a marine protected area, Trafalgar Beach (Map 6) is one of seven Blue Flag beaches
along the South Coast. Source: Author’s own
Figure 24: Dense sub-tropical vegetation in Glenmore (Map 6) is an integral feature of many of the coastal
villages of the South Coast. Source: Author’s own
34You can also read