An Auction for Medicare Durable Medical Equipment: Evidence from an Industry Mock Auction
←
→
Page content transcription
If your browser does not render page correctly, please read the page content below
An Auction for Medicare Durable Medical Equipment:
                    Evidence from an Industry Mock Auction
              Peter Cramton 1, Ulrich Gall 2, and Pacharasut Sujarittanonta 3
                                      25 June 2011

                                                  Abstract

           On 1 April 2011, 110 stakeholders in the Medicare Durable Medical Equipment
           (DME) industry came to the University of Maryland to discuss how the CMS’
           current competitive bidding program could be improved. The participants
           included Medicare providers, government leaders, and auction experts. A major
           part of the event was the conduct of a mock auction based on the auction
           design proposed in Cramton (2011a). This design addresses the fatal flaws in the
           CMS design (Letter from experts 2010, 2011). The proposed design has been
           shown to be highly effective in theory (Cramton et al. 2011), in the experimental
           lab (Merlob et al. 2010), and in practice (Ausubel and Cramton 2004, 2006). This
           paper presents the mock auction results. The mock auction demonstrated the
           feasibility of the proposal as well as its excellent performance. Despite the
           complex bidding environment, the mock auction achieved high levels of
           economic efficiency: 97% of the potential gains from trade were realized.
           Moreover, the participants were able to understand the auction format and
           auction platform, and successfully execute bidding strategies for 6 products in 9
           regions, all in a matter of hours. The conference also demonstrated the
           advantages of advancing the Medicare auctions through collaboration among
           industry, government, and auction experts. To avoid program failure, the
           Medicare auctions must be reformed to take advantage of modern auction
           methods. The mock auction demonstrates the high efficiency of the proposed
           approach.

1
 Professor of Economics, University of Maryland. Cramton’s research on Medicare auctions is available at
www.cramton.umd.edu/papers/health-care, including a full video of the Medicare Auction Conference.
He thanks the National Science Foundation for support.
2
    Stanford University; Chief Technology Officer, Power Auctions LLC.
3
    Principal, Cramton Associates LLC.
Background and market requirements
Medicare reimburses roughly $9.5 billion for durable medical equipment annually.
Reimbursement prices were traditionally set administratively. The development of online
marketplaces precipitated criticism that many products were overpriced,4 and in 2003, the
Medicare Prescription Drug, Improvement, and Modernization Act of 2003 (MMA) mandated a
“competitive bidding process” for determining the reimbursement prices.
CMS’ auction design
To meet this requirement, CMS implemented a flawed auction design that has been widely
criticized (Cramton and Katzman 2010; Letter from experts 2010, 2011).
The requirements for such an auction are highly complex. The total number of products which
need to be priced is substantial. The products are divided into many categories, and each of
these is further divided geographically into many regions. For each product category and region,
there is a historic demand that needs to be filled.
The auction process must then determine a set of winners for each product–region
combination, along with a winning price.
The CMS approach to accomplishing this is a sealed-bid auction in which the best offers are
accepted that clear the market, but where the winning price is set to the median of the bids at
or below the clearing price. Since that means some winners of the auction will be winning for a
price that is higher (i.e., less favorable to them) than the price they bid, bids are not binding.
Bidders therefore have nothing to lose by bidding low in order to assure being a winner. Each
winner gets to see the price and then decide whether it wishes to be a supplier for the particular
product-region.
Theory predicts that this auction design encourages “low-ball” bids (Cramton et al. 2011). In
addition, we observe that when a bidder is uncertain about its cost for supplying a product, the
bidder is best off bidding below the expected value of its cost. If the bidder wins, it can then
spend more resources on producing a more accurate cost estimate, and decide after the auction
whether to accept the price of walk away.
Overall, the consensus among 244 auction experts (Letter from experts 2011) is that this auction
design is flawed. The consensus is confirmed by auction results in the field (in addition to theory
and experiment). A significant number of bidders did not sign the supply agreements after the
auction, presumably because the prices were too low. In most of the product-regions, the vast
majority of existing suppliers by volume were losers in the auction, being displaced by
companies with little or no experience in the product-region.
4
http://www.hhs.gov/asl/testify/2007/10/t20071031a.htmlProposed auction design Cramton (2011a) proposes an alternative design that is consistent with results of auction theory and experiences in other large-scale auctions around the world. The design yields prices in a transparent and competitive bidding process, creates incentives to provide good quality, and assists bidders in the pricing process by producing valuable price information during the auction. The auction proposed is a reverse clock auction with some special features for the DME application. All products are offered simultaneously. The auction proceeds in rounds. Each round is associated with a price range for each lead product in each region. The lead product is one of the major products within the product category. Prices for all non-lead products are set from a price index for the product category. By stating a lowest price the bidder is willing to supply a product, the bidder indicates whether it is willing to stay in the auction in the current round or drop out. Once the bidder drops out for a product-region, the bidder may not bid for that product-region again. Prices start high and are reduced each round at a rate depending on excess supply for each product–region. A product–region clears when the supply for a region has dropped below or equal to the demand. One unusual feature of the auction design is the treatment of the quantity that each bidder supplies. In most clock auctions of this kind, bidders specify their quantity for each price. This is a good approach in settings where a subsequent spot market can be used for settling deviations from the quantity bid. Electricity markets provide a good example of the standard approach. However, in the DME auctions, quantity is highly uncertain because it is determined during the contract period by the Medicare beneficiaries’ choice of DME providers. Moreover, there is no spot market with which to settle deviations. For this reason, it is appropriate for the auction to determine the set of contract suppliers for each product category in each region. Quantities for an incumbent provider are set objectively from the bidder’s historic supply; quantities for a new entrant are set at 1% for less competitive product-regions and ½% for more competitive product-regions. Each winning bidder has a performance obligation that depends on its quantity. Each winner must accept orders for all products in the product category until the winner has reached its quantity. At that point the winner’s obligation is fulfilled. The winner can continue to accept orders beyond its quantity, but is not obligated to. A winner who does not reach its quantity during the contract period and who has accepted all valid orders for products in the product category throughout the contract has also fulfilled its obligation. In contrast, a winner who refuses to accept valid orders and has not yet met its quantity has failed to meet its performance obligation and an appropriate penalty is deducted from the winner’s deposit based on the extent of nonperformance. Having Medicare beneficiaries choose suppliers creates an incentive for suppliers to compete on quality to attract more business. Having quantities set at historic levels makes the quantities consistent with likely supplier capacity. Although new entrants have a small quantity initially, the quantity grows for future auctions if the new entrant is successful in attracting Medicare beneficiaries. An auction with fixed quantities also has improved incentives with respect to strategic quantity reduction (Ausubel and Cramton 2002). Bidders are either in or out at a particular price in each product-
region. This simplifies bidding strategies and may improve auction efficiency. However, strategic
supply reduction may still be in issue for large bidders across product categories and regions.

Mock auction
On 1 April 2011, the Medicare Auction Conference brought together 110 stakeholders from
throughout the country to discuss the Medicare DME competitive bidding program and how it
can be improved. The event was held at the Inn and Conference Center at the University of
Maryland. A key feature of the event was a nearly full-scale mock auction demonstrating how
the auction worked and its economic performance in a simplified but realistic environment. The
mock auction was conducted on an established commercial auction platform, customized for
the particular auction setting.
One hundred of the 110 participants were divided into fifty bidding teams, each with two
members; the remaining ten participants played the Auction Manager role and helped bidding
teams as needed.
As is often the case in a hotel setting, the greatest challenge for the bidders with respect to the
auction platform was maintaining a good Internet connection over the heavily loaded Wi-Fi
network. The bidding teams used their own laptops, some of which had old Wi-Fi cards that
sometimes degraded the performance of the network for all. There was one network outage,
which conveniently occurred just before lunch and was then resolved during the lunch break.
Each bidding team was provided a business plan that showed the team what product-regions
they were interested in and what their fully loaded cost of supplying the product is during the
contract period. Thus, each company had known linear (additive) costs.
Of course real business plans are more complex: each company has uncertainty about costs and
there are important interrelations among products and regions that impact either the quantity
or the cost. Many of these interrelations are complementarities. For example, a common one in
the DME setting is an increase in quantity sold (and hence profits) when a provider offers a
broader collection of product categories. This means that the referring hospital or beneficiary
only needs to contact and deal with a single provider for a variety of products. To represent such
a complementarity in the mock auction, each bidder received a $50,000 bonus in each region in
which the bidder won all six product categories. The introduction of this complementarity for
“one-stop shopping” served as an example of the many complementarities that occur in real
business plans. The one-stop shopping complementarity also made bidding strategy more
interesting and realistic.

Auction platform
The mock auction was conducted online using a Web-based auction system implemented using
the Ruby on Rails software framework. Bidders and the Auction Manager entered the system
with a standard web browser without needing to install any additional software, through a
secure, encrypted SSL connection. The software supports multiple logins for each bidding
company, and a large number of special features to simplify administration, auditing,
communication with bidders, and many other tasks.
The proposed design has a number of unusual characteristics, the combination of which
required substantial innovation in the software:
(1) There are a large number of items that bidders can bid on, organized in a two-dimensional
structure (region and product).
(2) The auction is dynamic, allowing bidders to adjust their bids as the auction progresses.
(3) There are many bidders inexperienced with auction systems, so the process for the user to
enter his bids into the system needs to be as simple.
(4) During the auction, a substantial amount of market information becomes available that is of
interest to bidders. This information needs to be presented to bidders in an understandable and
useful format.
To address these challenges, we customized the user interface as follows.

Bidding interface
Based on the auction design, each bidder needs to enter, for each auction round, a drop-out
price for each of the 54 product-regions. (In a real auction, the number of products would be
higher but roughly in this order of magnitude).
For presenting the 54 product-regions on the screen, we implemented a sorting and filtering
user interface that allowed bidders to restrict the items shown on the bidding screen to desired
set of products and regions. Furthermore, by ordering the region and product names, bidders
were able to sort the items as desired. Figure 1 shows the bidding screen with the filtering tool
on the left.

Figure 1: Bidding screen

A second challenge is to simplify bid entry. We customized the system so that bidders can bid a
price that will be reached in a future round, effectively entering a proxy bid, to avoid having to
bid on all products every round. Bidders who do not wish to decide on a proxy bid and type it in,
but know they would like to stay in for all prices of the current round, can simply click on the
end-of-round price to stay in until the next round, and then revise their bid as needed.
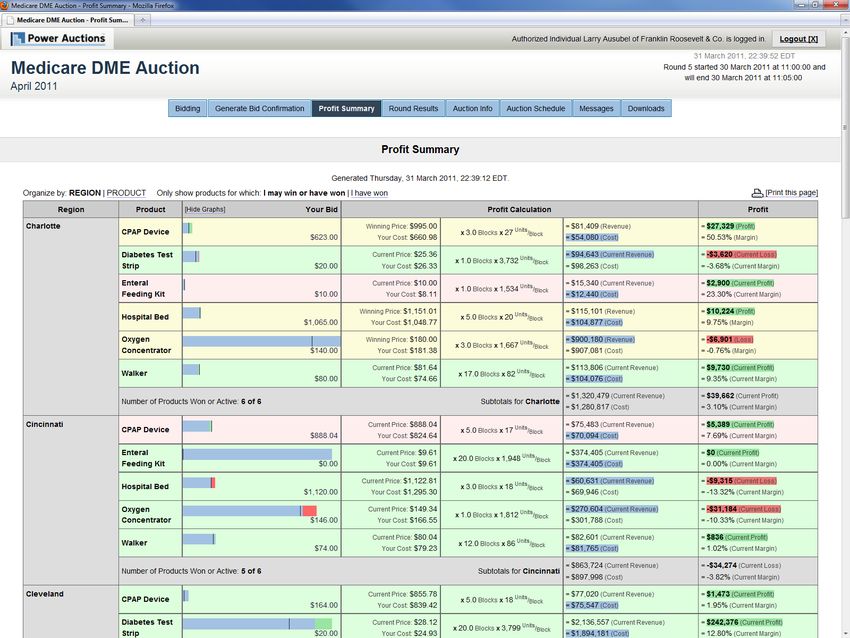
As described above, the dominant bidding strategy absent complements is to bid your cost. If
the bidding interface required bidders to type in all their bids without further guidance, they
would be facing an exercise of looking up their cost information for each product, shading it to
different degrees depending on their business model and bidding strategy, and then entering it
into the system. This is an error-prone process, especially under time pressure, and would not
allow bidders to focus on their business goals adequately.
We therefore added a unique feature to the software that allowed bidders to see their cost for
each product on the bidding screen. The bidding interface then allows them to bid their cost
with a single click. As the auction progresses and they understand the market better, they can
then adjust their bids by entering a different price. If they bid below their cost, their bid is
shown in red. This helps reduce errors, as it helps ensure that any bidding below cost is
intentional and not accidental.
The sorting features mentioned above allow bidders to quickly see all their bids organized by
region and by product, and adjust their bids to make them consistent with their bidding strategy
and business goals.

Profit calculation
The last challenge applies to the presentation of auction data on the screens. A primary goal for
all bidders in the auction is to maximize their profit. Since the cost data has been entered into
the system, the software can calculate the bidder's approximate profit (ignoring, however,
important details around the bidder's business goals).
A bidder b's total profit is given by:

 ( )         ∑          (    )      (    )( (   )     (    ))

W(b,p) indicates whether a bidder b won product p, U is the number of unites per block, for that
product, B is the number of blocks the bidder has been assigned for that product, and P and C
are the winning price and the bidder’s cost for the product.
For the overall profit, this is a function of 270 variables. The software allows bidders to visualize
this calculation based on all input numbers in the table shown in Figure 2. The bar graphs
indicate at a glance which products are profitable and how much they contribute to the overall
profit.
Figure 2: Profit calculation

Mock auction results
Auction outcome
The summary of auction result is shown in Table 1. Each measure is scaled by its theoretical
prediction to enable aggregation across 54 markets. Throughout the analysis we use a simple
theoretical model that ignores the region bonus for one-stop-shopping. The theory then
predicts that each company bids its cost. A richer theory that includes the region bonus is not
tractable, but intuition suggests that this would give the company an incentive to dropout late
(that is, bid below cost) in regions where it appeared winning all six categories would not be too
costly.
                                     Table 1. Auction results

                               Variable         Mean     Standard error
                         Relative price         1.035        0.006
                         Relative social cost   1.028        0.004
                                The number of observations is 54.
A relative price is defined as a ratio between actual and theoretical market clearing prices. On
average, Medicare beneficiaries pay 3.5 percent higher than the fully efficient level. The
histogram of relative price is shown in Figure 3. Most markets close at prices higher than the
theoretical prices.
15
12
Number of markets
9
6
3
0
0.8 0.9 1 1.1 1.2
Relative price
Figure 3. Relative price histogram
A social cost, defined as a sum of all contract suppliers’ costs, indicates the total cost of
providing DME to serve a fixed market demand. A lower social cost is desirable. Analogous to
relative price, a relative social cost is a ratio between actual and theoretical social cost. The
theory predicts that the social costs are at the minima. Thus, the lowest possible relative social
cost is one. The mock auction yields 2.8 percent higher costs than the theoretical predication.
The histogram of social cost is shown in Figure 4. Social costs in all markets except one outliner
are within 8 percent of the theoretical prediction. The mock auction performs relatively well in
terms of minimizing the cost of DME supply.30
Number of markets 25
20
15
10
5
0
1 1.05 1.1 1.15 1.2
Relative social cost
Figure 4. Relative social cost histogram
Individual bidding behavior
There are 2,183 bids submitted, 1,192 of which are still active at the final round. Thus, there are
a total of 991 inactive bidsbids superseded by bids in subsequent rounds. The bid breakdown
in terms of whether the bidder dropped out early or late is shown in Table 2 for inactive and
active bids.
Table 2. Bid breakdown
Bid type Inactive Active
Early dropout (bid > cost) 393
(39.7%) 1,155
Equilibrium bid (bid = cost) 460 (96.9%)
(46.4%)
Late dropout (bid < cost) 138 37
(13.9%) (3.1%)
Little conclusion can be drawn from active bids because participants may have submitted an
equilibrium bid or dropped out late if the auction had continued; nonetheless, only 3 percent of
active bids were below equilibrium. For inactive bids, roughly one-half were equilibrium bids, 40
percent were early dropouts and 14 percent were late dropouts.
We define “relative bid,” which is the dependent variable, as a ratio of actual to theoretical bids.
Figure 5, the histogram of inactive relative bid, shows that several companies dropped out well
before prices reach their costs.600
Number of inactive bids 500
400
300
200
100
0
0.8 1 1.2 1.4 1.6 1.8
Relative bid
Figure 5. Relative bid histogram
The regressions of the relative bid on various variables are shown in Table 3. The samples are
inactive bids. The first regression is simply an intercept model. The second and third regressions
include market fixed effects and the third is also clustered by bidder.
All regressions imply that bidders on average dropped out earlier than the theoretical
prediction. Early dropout is strictly dominated strategy. This bidding behavior is likely to go away
once participants gain experience.
Table 3. Regressions of relative bid
Variables (1) (2) (3)
Constant 1.07 1.09 1.09
(0.01) (0.03) (0.04)
Product-region fixed effects No Yes Yes
Clustered by bidder No No Yes
R-squared 0.00 0.02 0.07
The number of observations is 991.
The fear that some DME providers have expressed that bidders are apt to bid too aggressively
(and dropout too late) was not observed in this auction design, in sharp contrast to the CMS
design. Part of the explanation may be that bidders had known costs. With unknown costs,
experimental results would suggest that bidders, especially naïve bidders with less experience,
would be vulnerable to the winner’s curse and bid overly aggressively, dropping out too late,
relative to theory (see, for example, Kagel 1995; Kagel and Levin 2008). This would imply lower
prices and greater cost savings.
Additional summary figures from the mock auction as well as the individual bidding behavior in
each product-region are shown in an online appendix.Comments from bidders In the panel discussions following the mock auctions, the overwhelming majority of the bidders were pleased with the mock auction process. Only two kinds of critical comments were mentioned, both centered on the bidders’ cost for providing the products being auctioned. Many bidders stated that do not know their true costs. In practice, bidders in all auctions have uncertainty about their costs, and some bidders, typically the larger bidders with more experience can assess costs with greater accuracy. Bidders understood that having a good estimate of costs is an important part of running a successful business. However, understanding uncertainty about costs is also important. Bidders also expressed an unwillingness to disclose their true cost to the auction system. This concern is reasonable, yet it is readily addressed in practice through the information policy with respect to cost information. It is certainly possible to construct the system so that CMS would not have access to bidder-specified cost information, yet bidders could enjoy the benefit of submitting this information for simple profit calculations and bid error checking and alerts. Observations The bidding interface in the software was successful in facilitating efficient bid entry. Almost all bidders were able to place all bids they intended to place, despite an extremely fast schedule with some rounds lasting only 5 minutes, and despite the fact that they had never seen the software before. In a real auction, there would be more products, but also longer rounds— several hours would be typical—and bidders would have time to prepare. Although this was a mock auction, bidders appeared deeply engaged in the mock auction. Even the technical failure with the Wi-Fi network at the conference center did not stop bidders from following the auction; many of them resorted to bidding from their mobile phones. This suggests a high level of engagement in the mock auction. Future improvements As mentioned, a bidder’s reluctance to enter true costs into the system can easily be addressed. Furthermore, a commercial auction system would be able to encrypt the cost information on the client side, and only send an encrypted version of the data to the server. This encryption would happen in the web browser, and the source code for the encryption would be openly visible to the bidder. Bidders could therefore assure themselves that the encryption is safe and that indeed the auction administrators cannot see their confidential cost information. In practice, the source code would be published in advance of the auction, and an auditor could review it on behalf of the bidders and certify that it meets confidentiality requirements. A desirable improvement to the bidding interface would be the implementation of watch lists. This is a feature that is often used in auctions with many products to allow bidders to define which ones they are interested in; for example, watch lists are used in –Canadian and US spectrum auctions and in electricity auctions in New England. It can also be used to divide responsibility for products between multiple individuals entering bids for the same company. In contrast to existing auction systems with this feature, the Medicare auction has so many products that even choosing products one by one is infeasible. Therefore, we intend to allow bidders to create watch lists by specifying product categories and regions, rather than individual products.
Conclusion
The Medicare Auction Conference held at the University of Maryland on 1 April 2011
demonstrated the feasibility and efficiency of the auction design proposed in Cramton (2011a).
The mock auction conducted with 50 bidding teams, bidding for 54 product-regions, yielded an
efficiency of 97 percent, consistent with theory and experimental results. Although the setting
was simplified, the mock auction was a reasonably realistic representation of the Medicare DME
auction setting. The main simplifying features were the adoption of simple (additive) business
plans and known costs.
The conference also demonstrated the advantage of bringing the stakeholders together, both
government and industry, with auction experts to engage in a collaborative way on the
important questions of auction design. The approach was educational for all and illuminated
important issues and began to shed light on some of these issues. The approach appears to be a
good one to further develop the market design before it is implemented nationwide.

References
Ausubel, Lawrence M. and Peter Cramton, “Auctioning Many Divisible Goods,” Journal of the European
    Economic Association, 2, 480-493, April-May 2004.
Ausubel, Lawrence M. and Peter Cramton, “Dynamic Auctions in Procurement,” in Nicola Dimitri, Gustavo
    Piga, and Giancarlo Spagnolo (eds.) Handbook of Procurement, Cambridge, England: Cambridge
    University Press, 2006.
Cramton, Peter (2011a), “Auction Design for Medicare Durable Medical Equipment,” Working Paper,
    University of Maryland, March.
Cramton, Peter (2011b), “Medicare Auction Failure: Early Evidence from the Round 1 Rebid,” Working
    Paper, University of Maryland, June.
Cramton, Peter, Sean Ellermeyer and Brett E. Katzman (2011), "Designed to Fail: The Medicare Auction for
    Durable Medical Equipment" Working Paper, University of Maryland, April.
Cramton, Peter and Brett E. Katzman (2010), "Reducing Healthcare Costs Requires Good Market
    Design," The Economists' Voice, 7:4, www.bepress.com/ev/vol7/iss4/art8, October.
Kagel, John H. (1995), “Auctions: A Survey of Experimental Research,” in Alvin E. Roth and John H. Kagel
     (eds.), Handbook of Experimental Economics, Princeton University Press.
Kagel, John H. and Dan Levin (2008), “Auctions: A Survey of Experimental Research, 1995-2008,” in Alvin E.
     Roth and John H. Kagel (eds.), Handbook of Experimental Economics, Vol. 2, Princeton University
     Press.
“Letter from 167 Concerned Auction Experts on Medicare Competitive Bidding Program” to Chairman
     Stark, Health Subcommittee, Ways and Means, U.S. House of Representatives, 26 September 2010.
“Letter from 244 Concerned Auction Experts on Medicare Competitive Bidding Program” to President
     Obama, 17 June 2011.
Merlob, Brian, Charles R. Plott, and Yuanjun Zhang (2011), “The CMS Auction: Experimental Studies of a
    Median-Bid Procurement Auction with Non-Binding Bids,” Working Paper, California Institute of
    Technology, April.
You can also read