An Exploration of the Effects of Cross-Modal Tasks on Selective Attention - MDPI
←
→
Page content transcription
If your browser does not render page correctly, please read the page content below
behavioral
             sciences
Article
An Exploration of the Effects of Cross-Modal Tasks on
Selective Attention
Krithika Nambiar *                 and Pranesh Bhargava

                                         Birla Institute of Technology & Science, Pilani—Hyderabad Campus, Hyderabad 500078, India
                                         * Correspondence: p20190436@hyderabad.bits-pilani.ac.in

                                         Abstract: Successful performance of a task relies on selectively attending to the target, while ignoring
                                         distractions. Studies on perceptual load theory (PLT), conducted involving independent tasks
                                         with visual and auditory modalities, have shown that if a task is low-load, distractors and the
                                         target are both processed. If the task is high-load, distractions are not processed. The current study
                                         expands these findings by considering the effect of cross-modality (target and distractor from separate
                                         modalities) and congruency (similarity of target and distractor) on selective attention, using a word-
                                         identification task. Parameters were analysed, including response time, accuracy rates, congruency
                                         of distractions, and subjective report of load. In contrast to past studies on PLT, the results of the
                                         current study show that modality (congruency of the distractors) had a significant effect and load
                                         had no effect on selective attention. This study demonstrates that subjective measurement of load is
                                         important when studying perceptual load and selective attention.

                                         Keywords: perceptual load; selective attention; distractor processing; distractor congruency

                                         1. Introduction
                                               Successful engagement with the environment requires interaction with stimuli pre-
                                         sented to the various sensory organs. When performing tasks, we are faced with a continual
                                         stream of information in the form of perceptual stimuli. Attention is the mechanism that
                                         helps to process various stimuli presented by the different sensory organs. However,
                                         attending to stimuli has associated costs, because perceptual processing capacity is an
Citation: Nambiar, K.; Bhargava, P.      exhaustible resource [1,2]. One way to deal with this is to attend only to relevant informa-
An Exploration of the Effects of         tion, e.g., information from the relevant stimuli, i.e., the target, while ignoring distracting
Cross-Modal Tasks on Selective           information. This is achieved through selective attention allowing for the preferential
Attention. Behav. Sci. 2023, 13, 51.     processing of the presented sensory information relating to features, locations, orientation,
https://doi.org/10.3390/                 and modalities [3,4].
bs13010051                                     A pertinent question in this regard relates to the stage of information processing during
Received: 18 October 2022                which selective attention applies. So-called early-selection theories claim that task-relevant
Revised: 23 December 2022                information is selected at an early stage of processing, allowing targets to be perceptually
Accepted: 31 December 2022               encoded while ignoring distractors [5,6]. On the other hand, so-called late-selection theories
Published: 6 January 2023                claim that both the target and distractors are perceptually encoded in the initial stages
                                         of processing. It is only at a later post-perceptual stage that target selection for further
                                         processing takes place [7].
                                               With perceptual load theory (PLT), Lavie [8] brought together these two types of theory.
Copyright: © 2023 by the authors.        PLT posits that perceptual processing at all times involuntarily processes information to its
Licensee MDPI, Basel, Switzerland.       full capacity. While performing a task, top-down identification of relevant and irrelevant
This article is an open access article   information is led by the voluntary control of perception. Through selective attention, the
distributed under the terms and
                                         task-relevant aspects of the stimuli are prioritized for processing. If the task is low-load,
conditions of the Creative Commons
                                         attending to the target does not engage the whole perceptual process, but as perceptual
Attribution (CC BY) license (https://
                                         processing is involuntary and must be used to its full capacity, irrelevant information
creativecommons.org/licenses/by/
                                         including distractions is processed along with relevant information relating to the target.
4.0/).

Behav. Sci. 2023, 13, 51. https://doi.org/10.3390/bs13010051                                             https://www.mdpi.com/journal/behavsci
Behav. Sci. 2023, 13, 51 2 of 15
However, if the task is high-load, it consumes all the available processing capacity in
attending to the target, leaving no spare capacity for processing the distractions [1,9].
Thus, according to PLT, the stage at which selective attention applies and the allocation
of processing capacity depend on the load induced by the task at hand. The load induced
by a task is dependent on cognitive demand as well as the perceptual properties of the
task [9–11].
Thus, the concept of high or low perceptual load is operationalized on the basis of
distractors and targets [12,13]. The task is considered high perceptual load when the
distractions or non-target information are not processed. The task is considered low-
load when the attentional resources spill over and process distractions along with the
target information, a situation known as distractor interference. Corroborating this, results
from many studies on PLT have found that the perceptual demand induced by the task
determines the allocation of attentional resources. High-perceptual-load tasks preclude
processing irrelevant aspects of the stimuli [2,14,15].
Since perceptual load is observable only by the processing (or lack thereof) of distrac-
tions, the study and observation of perceptual load can involve manipulations of aspects of
tasks, such as the target itself, task-relevant and task-irrelevant distractors, or the objective
of the task. Studies involving PLT use these aspects to manipulate and study perceptual
load in three different ways. One of these ways is to alter the number of items displayed
during perceptual recognition tasks. Increasing the number of items on display increases
the complexity of the task, hence increasing the perceptual load. In one of her early studies,
Lavie [16] implemented this method of load manipulation by having the target appear
in one out of six possible positions on the visual display, with five positions empty un-
der low-load conditions. For high-load conditions, the five positions were occupied by
non-target letters. Another method of load manipulation is by keeping the nature and/or
number of displayed conditions unchanged while altering the number of operations to be
performed to complete the task. Increasing the number of perceptual operations involved
in a task increases the task’s complexity. In one such study, along with manipulating the
load by increasing or decreasing the number of letters in a visual search task, the demands
on perceptual judgement were varied by comparison with length discrimination or colour
detection using identical stimuli [11].
Perceptual load is also affected by increasing the similarity, also called the congruency,
between the target and the distractors [17–19]. Congruent distractors, which have similar
properties to the target, compete with the target for attentional resources. Incongruent
distractors, which are dissimilar to the target, do not compete with the target [20]. Studies
employing the letter-search paradigm reported that when searching for a target such as the
angular letter X, surrounded by congruent distractors like the angular letter Z, the response
was faster (shorter response time). If other irrelevant non-target stimuli, e.g., cartoon faces,
were also present, these were not even processed [10,15,21]. However, when searching
for the letter X among incongruent distractors such as the circular letter O, the response
was slower (longer response time), and irrelevant stimuli were also processed. Thus, for
congruent distractors, the perceptual similarity between the targets and the distractions led
to higher perceptual load, exhausting the attentional resources. In the case of incongruent
distractors, the task was less demanding and perceptual load stated as low, leaving spare
attentional capacity to process task-irrelevant information [22]. In short, congruency of
distractors and target has a significant effect on selective attention but only when the
perceptual load of the task is low.
1.1. Issues with PLT
There are two main issues affecting studies reporting the results of PLT, namely the
circularity problem and the limiting of experiments to the visual domain. The circularity
problem refers to the circular characterization of perceptual load. On one hand, distractor
interference is assumed to depend on whether the task is high- or low-load; on the other,
whether the task is high- or low-load itself depends on whether or not the distractor causesBehav. Sci. 2023, 13, 51 3 of 15
interference [12,13]. Thus, there is no independent validation of whether a task is high-
or low-load. The experimenter testing the effect of load on distractor interference decides
a priori whether a task is high- or low-load, and accordingly interprets the performance
of participants. To address this issue, in the current study, instead of the researchers
assuming the extent of the task load, the participants were asked to subjectively rate the
load separately after the experimental tasks.
The second issue with PLT is that the knowledge gained in this context about selective
attention and perceptual load is based largely on the visual domain, because studies
conducted under PLT have been predominantly in the visual domain. However, our
experience of the real world is multimodal in nature, i.e., involving more than one modality.
To imitate better the real world scenario of selective attention in studies of perceptual load,
it is important to study tasks involving both visual and auditory stimuli [23]. Because of the
evolutionary difference in the functions of vision and hearing in the real world, a difference
may also exist in the way an individual interacts with auditory and visual distractions
while performing tasks that need attention [24–26].
A small but growing niche of studies have begun to explore the role of auditory
modalities in perceptual load, with some reporting unimodal experiments with auditory
and visual modalities. These studies found that selective attention is dependent on load,
irrespective of the modality. For instance, in a figure–ground segregation study reported by
Molloy et al. [27], task-irrelevant sounds were presented during the performance of a visual
search task and the results revealed a ‘clear magnetoencephalography neural signature of
figure-ground segregation in conditions of low visual load, which was substantially reduced
in conditions of high visual load’. Therefore, for both of these modalities, distraction
recognition depends on the level of perceptual load. Other studies that conducted unimodal
experiments with auditory and visual stimuli included tasks in which the distractions were
presented in the same modality as the target [28–31]. Several studies involved tasks using
multiple modalities for targets and distractors, but these did not take the congruency factor
into consideration [24,25,32,33].
Thus, the research gap in the literature arises from a dearth of studies that (i) involve
cross-modal tasks (target from one modality, distractor from another), while (ii) taking into
consideration the congruency of the distractors, and (iii) including subjective measurement
of load from the participants.
1.2. Current Study
Studies of multisensory integration have demonstrated that humans perceive their
environment better when they are able to bind perceptual information from different
senses and combine this information into a coherent representation. Therefore, in order to
study cross-modal perceptual congruency, one must use an object that can be perceived
simultaneously by the corresponding senses [34,35]. One method employed to achieve
this is the use of a picture of an animal (e.g., dog or cat) as the visual stimulus and
a corresponding or non-corresponding call (e.g., barking or mewing) as the auditory
stimulus [36]. The problem with this is that the buttons for receiving the participant’s
response need to be labelled with pictures (e.g., of a dog and a cat), which supplies an
over-representation of the visual stimulus (i.e., not only as the visual task stimulus, but also
on the button label) compared with the auditory stimulus (because there is no ‘auditory
button’). An acceptable solution to this is to label the buttons with words (e.g., DOG and
CAT), which requires the participant to read the word on the button. In the current study,
we built upon this solution.
In languages with alphabetic writing systems (e.g., English), the textual spelling
and phonological pronunciation of a word are integrally connected through orthographic
knowledge [37,38]. For unknown and less familiar words, the speaker of a language would
read the words piecemeal, but for common and familiar words, the spelling and pronunci-
ation are stored together as a picture–sound unit in the individual’s lexical orthographic
knowledge, such that the sight of a printed or written word invokes its pronunciation,Behav. Sci. 2023, 13, 51 4 of 15
and vice-versa. Thus, words contained in the individual’s lexical orthographic knowledge,
i.e., very frequent and highly familiar words, undergo cross-modal (visual and auditory)
activation. Correspondingly, we assume that the task of reading one word while listening
to a different word would represent a cross-modal target–distractor paradigm. With this
in mind, we used frequently occurring Indian English words and their corresponding
utterances as cross-modal stimuli in the current study. The task was perceptual in nature
because it involved integration of two perceptual modalities in the form of targets and
distractors. This also allowed the buttons to be labelled with single letters (initial letters of
the names of the stimuli) which helped to avoid over-representation of the visual or audi-
tory stimuli. Within this paradigm, because of the use of meaningful words, the semantic
congruency was cognitive in nature.
We employed the aforementioned model in the current study design to address the
previously mentioned research gap by: (i) incorporating cross-modality in choosing the
targets and distractors, i.e., for a visual target, then the distractor was auditory (and
vice versa), (ii) using two different types of distractors, i.e., congruent and incongruent,
and (iii) asking the participants themselves to rate the load of the tasks after completion.
The overarching research objective was to see if congruency and modality of distractors
(vis-à-vis the target) affected the perceptual load of tasks.
On the basis of results from previous studies involving PLT, in the present study it
was expected that modality would not play a significant role in selective attention; thus:
Expectation 1: There would be no significant differences in the response times and
accuracy scores of the participants for tasks from any modality.
Furthermore, results from PLT studies also showed that congruency of distractions
has no significant effect on the performance of participants, thus:
Expectation 2: There would be no significant difference in the performance scores of
participants for tasks with varying distractor congruency.
If the performance scores of participants in bimodal audio–visual tasks do not fluctuate,
we can conclude that the results align with the existing research and study results relating
to PLT. Such a result would indicate that selective attention functions in a uniform way
irrespective of modality, and that the congruency of distractors on target recognition in a
task is load-dependent in its effect rather than modality-dependent. If the results do show
differences, it could indicate that selective attention varies with the nature and modality of
the task. This would imply that apart from load being induced by the task itself, i.e., some
tasks being inherently difficult or easy and thereby classified as high- or low-load tasks,
the inclusion of targets and distractors from two different modalities affected selective
attention, leading to slower reaction times and lower accuracy scores.
The current research incorporated a post-experiment questionnaire to measure the
load of the auditory and visual tasks included in the study. This provided a subjective
measurement of load as indicated by the participants. The participants were asked to
recall the task they completed involving a particular modality and to rate the task using
the parameters stated in the questionnaire. Consequently, two sets of the questionnaire
were distributed in order of completion of the experiments. The scores given by the
participants were assessed by the experimenters to discover whether the reaction times and
accuracy scores across the two tasks with different modalities were indeed affected by the
task loads. This post-hoc measurement is considered important to provide an unbiased
interpretation of load, which could not be achieved if the load were predetermined by the
experimenters. It is important to note that this post-experiment questionnaire provided
results that were indicative of the cognitive load or the working memory load, because it
involved participants’ recall [1].
2. Materials and Method
2.1. Participants
Thirty-one participants (14 females; mean age = 30 years), with reported normal
hearing and vision, were recruited from BITS Pilani’s Hyderabad campus. The participantsBehav. Sci. 2023, 13, 51 5 of 15
received rewards of stationery for their participation. Each participant took part in the two
experimental tasks on the same day. The participants provided informed consent before
their participation.
2.2. Apparatus and Stimuli
Audacity® (version 3.0.0) was employed to record and process the auditory inputs.
These inputs were then utilized for construction of the experiment in PsychoPy Experiment
Builder version 3.0. The open-source version of RStudio, the integrated development
environment (IDE) for R, was employed to analyse the data. RStudio used the statistical
tool R (64-bit, version 3.5.1) for the analysis. All the packages that were applied in R were
installed through the R-Cran cloud library. For plotting the graphs generated by R, Rcmdr
package version 2.5-1 was used. The auditory inputs were delivered using Audio-Technica
ATH-M20x over-the-ear headphones. The NASA task load index (TLX) Version 1.0 paper
and pencil package was used for subjective task-load ratings [39].
Three words for colours, namely Red, Green, and Blue, and three non-colour words,
namely Pen, Lid and Mug were recorded spoken by a female voice in a sound-treated
chamber. The words were monosyllabic, commonplace English terms, 500 ms in duration,
and normalized in intensity with each other.
2.3. Procedure
For experiments 1 and 2, the participants were seated in a sound-treated chamber
and presented with visual stimuli on a computer screen and auditory stimuli through
headphones. They recorded their responses with mouse clicks. Each of the experiments
comprised a training session followed by two experimental tasks. On-screen and verbal
instructions from the experimenters were provided to the participants during the training,
and before (but not during) each task. The participants kept the headphones on during the
training and the tasks.
The experiment commenced with training in which the participant was familiarized
with the user interface, the stimuli, and the process. During the training, participants
were permitted to adjust the volume of the audio and the brightness of the screen to meet
their preference. These settings then remained unchanged for that participant for both
experimental tasks. The training was repeated until a participant was confident and had
no more questions.
In order to reduce any strategy-based effects of modality on the performance of
participants, and to compensate for any potential bias, half of the participants performed
the visual task first, followed by the auditory task. The other half completed the auditory
task first, followed by the visual task.
2.3.1. Experiment 1: Visual Task (VT)
The effect of selective attention on visual modality was tested using the visual task. In
VT, the target of the task was the visual stimulus, and the distractor was the auditory stim-
ulus. Refer to Figure 1 for a representation of a typical trial. Before the task and during the
training, the participants were asked to ignore any auditory stimuli they might hear during
the task. For the first 500 ms of each trial, participants were presented with a ‘+’ fixation
symbol on the screen, along with an alerting auditory tone delivered through the head-
phones. Soon after the fixation and the alert tone, the visual target and auditory distractor
were presented simultaneously on the screen and through the headphones, respectively.using the mouse. Immediately after the response from the participant was received
through the mouse click on any of the three on-screen buttons, the next trial was presented
automatically.
There were 18 unique pairs of target visual stimuli (3 colour words) and distractor
Behav. Sci. 2023, 13, 51 auditory stimuli (6 colour or non-colour words). Each pair was presented three times, 6 of 15
making a total of 54 trials for the VT.
Figure 1. Schematic representation of a trial in the visual task (VT). The visual fixation ‘+’ was
presented with a simultaneous auditory fixation beep. The target presented on the screen was a
Figureword.
colour 1. Schematic representation
The distractor, of a trialpresented
simultaneously in the visual task (VT).
auditorily, was The visual
either fixation
a colour or a ‘+’ was pre-
non-colour
sented with a simultaneous auditory fixation beep. The target presented on the screen was a colour
word displayed on the screen. The response was recorded via on-screen buttons.
word. The distractor, simultaneously presented auditorily, was either a colour or a non-colour word
displayed on the screen. The response was recorded via on-screen buttons.
The visual target was a randomly selected word from the pool of only the colour
words. This word was displayed on the screen for 500 ms, in black Times New Roman
2.3.2. Experiment 2: Auditory Task (AT)
font. The auditory distractor was an auditory stimulus randomly selected from the pool of
colourThe
andauditory taskwords.
non-colour (AT) wasThesimilar,
visuallybut with an word
presented auditory target
in the of colour
VT was alwayswords, and
a colour
word, therefore a colour word as an auditory stimulus was a congruent distractor, while of
distractors of either a colour or a non-colour word presented on the screen. The effect a
selective attention
non-colour word ason anthe auditory
auditory modality
stimulus waswas tested with distractor.
an incongruent target stimuli from the audi-
toryAfter
domain
the and distractorofstimuli
presentation from
the target andthedistractor,
visual domain. During the
three on-screen training
buttons for the
appeared
task the
with andtext
again
‘R’before
for red,the‘B’actual taskand
for blue, began, participants
‘G’ for green. The were
taskasked
was totoidentify
attend to the
the audi-
colour
tory presented
word stimuli while ignoring
visually on theany visual
screen, by stimuli
clickingonthethe screen. Theon-screen
corresponding set-up and number
button usingof
trials were similar to VT as described earlier, except that for each trial
the mouse. Immediately after the response from the participant was received through the a randomly selected
colourclick
mouse wordonwas
anypresented
of the three through the buttons,
on-screen headphones as the
the next auditory
trial target stimulus,
was presented while
automatically.
There were 18 unique pairs of target visual stimuli (3 colour words) and distractor
auditory stimuli (6 colour or non-colour words). Each pair was presented three times,
making a total of 54 trials for the VT.
2.3.2. Experiment 2: Auditory Task (AT)
The auditory task (AT) was similar, but with an auditory target of colour words, and
distractors of either a colour or a non-colour word presented on the screen. The effect
of selective attention on the auditory modality was tested with target stimuli from the
auditory domain and distractor stimuli from the visual domain. During the training for
the task and again before the actual task began, participants were asked to attend to the
auditory stimuli while ignoring any visual stimuli on the screen. The set-up and number of
trials were similar to VT as described earlier, except that for each trial a randomly selected
colour word was presented through the headphones as the auditory target stimulus, while
a randomly selected visual stimulus from the pool of colour words (congruent distractor)
and non-colour words (incongruent distractor) were presented on the screen.
The task was to identify the colour word presented as the auditory stimulus through
the headphones, by clicking the corresponding on-screen button using the mouse.Behav. Sci. 2023, 13, 51 7 of 15
2.3.3. Post-Test: Task-Load Questionnaire
For measuring the subjective perception of load for visual and auditory tasks, the
NASA load TLX questionnaire was distributed to the participants, each receiving one
questionnaire after each task. The questionnaire asked the participants to rate the task sub-
jectively on a set of six scales (Mental, Physical, and Temporal Demand; Effort, Frustration,
and Performance)on a rating sheet. Each scale was presented as a line divided into 20 equal
intervals. The participants marked their responses using tick marks on the given rating
scales. Ratings were obtained after each task was completed. Computerised analysis (from
NASA Ames Research Centre) was employed to calculate the magnitude of load according
to the participant ratings [39].
2.4. Measures
Within each task, a trial was considered to be correctly attempted if the participant
clicked the button corresponding to the colour word presented as the target (visual in VT,
and auditory in AT); otherwise, the trial was deemed incorrectly attempted. Each trial
was considered a data point; a score was assigned for each correctly attempted trial, while
an incorrect attempt received no score. Total numbers of correct attempts were used for
statistical analysis.
For each trial, the response time (RT) in milliseconds was calculated as the time taken
from the presentation of the on-screen buttons to the event of the mouse click on one of the
buttons. Load scores from NASA load TLX indicated the task load.
2.5. Catch Condition
In Experiment 1 (VT), where the auditory distractors supplied to the ear were con-
gruent and incongruent in nature, the gender of the audio inputs were changed exactly
3 times. This change in gender of the audio inputs while performing the visual task was
the catch condition.
In Experiment 2 (AT) the visual distractors, both congruent and incongruent, were
displayed on the screen. In this case the catch condition was a change in font size from the
existing stimuli size to almost double to that of the visual inputs. The change in font size of
the visual inputs happened exactly 3 times.
The catch conditions in both the experiments were presented at regular intervals,
ensuring that the participant did not encounter the catch condition in back-to-back trials.
If the perceptual load of any of the tasks was deemed to be high, it was assumed that the
congruent and incongruent distractors and the catch conditions would not be processed.
3. Results
The G*Power test was conducted to find the power (1 − β err prob) using an F
test—ANOVA: repeated measures within-between interaction. This post hoc analysis
was carried out to compute achieved power. The effect size (f) was 0.25 and the α error
probability was set at 0.05. The power achieved was (1 − β err prob) = 0.913.
Across the two tasks, we were interested in the effect of modality on perceptual
load, and the effect of congruency of the distractor with the target. To this end, the mean
accuracy scores and mean RTs were calculated as a function of the effect of congruency of
the distractors and type of modality on the performance of the participants.
3.1. Accuracy
The plot of mean accuracy scores for AT and VT is shown in Figure 2. The accuracy
scores were lower for VT with congruent distractors (M = 0.92, SD = 0.25) compared with
incongruent distractors (M = 0.93, SD = 0.24). AT had better accuracy scores for congruent
and incongruent distractors, compared with VT (congruent M = 0.99, SD = 0.05; incongruent
M = 1.00, SD = 0.00). Furthermore, 2 × 2 ANOVA was conducted to examine the effect
of the type of modality (i.e., AT vs. VT) on accuracy scores. The result showed that theThe plot of mean accuracy scores for AT and VT is shown in Figure 2. The accuracy
scores were lower for VT with congruent distractors (M = 0.92, SD = 0.25) compared with
incongruent distractors (M = 0.93, SD = 0.24). AT had better accuracy scores for congruent
and incongruent distractors, compared with VT (congruent M = 0.99, SD = 0.05; incongru-
Behav. Sci. 2023, 13, 51 ent M = 1.00, SD = 0.00). Furthermore, 2x2 ANOVA was conducted to examine the 8 ofeffect
15
of the type of modality (i.e., AT vs. VT) on accuracy scores. The result showed that the
modality had a significant effect, F = 111.56; p < 0.001. The congruency type did not have
a significant
modality had a effect on the
significant type Fof=modality
effect, (F0.001.
111.56; p < = 0.92,The
p = congruency
0.33). type did not have a
significant effect on the type of modality (F = 0.92, p = 0.33).
Figure 2. Plot of mean accuracy scores for visual and auditory tasks. Note that the Y-axis does not
Figure
begin 2. Plot of mean accuracy scores for visual and auditory tasks. Note that the Y-axis does not
at zero.
begin at zero.
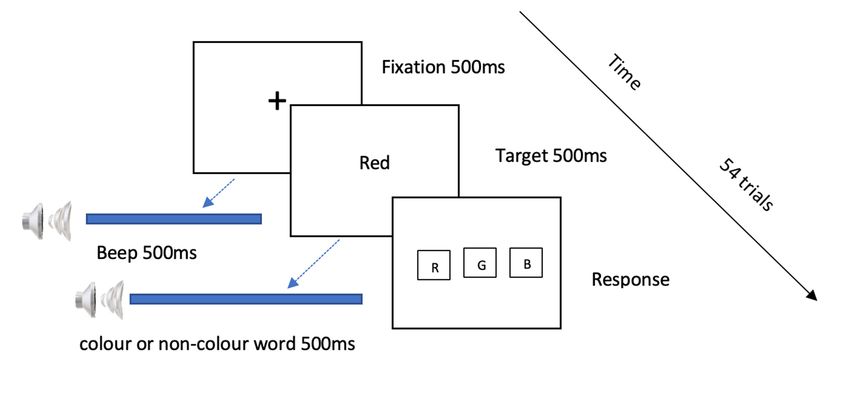
3.2. Response Time
3.2.
TheResponse mean response-time scores for AT and VT is shown in Figure 3. The 2 × 2
plot ofTime
logRT ANOVA
The plot of type
for meanofresponse-time
modality on response time
scores for ATshowed
and VT aissignificant effect, F3.=The
shown in Figure 17.26,
2×2
pBehav. Sci. 2023, 13, x FOR PEER REVIEW 9 of 16
with incongruent distractors were longer (M = 0.99, SD = 2.2) compared with congruent
Behav. Sci. 2023, 13, 51 9 of 15
distractors (M = 0.72, SD = 0. 45).
Figure 3. Mean response times for auditory and visual tasks. Note that the Y-axis does not begin
Figure 3. Mean response times for auditory and visual tasks. Note that the Y-axis does not begin at
at zero.
zero.
3.3. Load
The NASA load TLX was employed to calculate separately the perceived load scores
for both visual and auditory tasks. Mean load scores for the types of modality are shown in
Figure 6. For the participants who completed VT first, the mean visual load was 43.60, and
the mean auditory load was 33.17. For the participants who undertook AT first, the mean
auditory load was 36.03, and the mean visual load was 46.69. This shows that irrespective
of the order in which the tasks were performed, the mean load of VT was consistently
higher than that of AT. Consequently, while the mean load for AT remained the same
irrespective of the order in which the tasks were performed, the mean load for VT increased
substantially when VT followed AT. The MANOVA results for mean load scores and the
order in which participants completed the tasks showed no significant effect of task order
on the subjective load scores (F = 2, p = 0.937).Behav. Sci. 2023, 13, x FOR PEER REVIEW 10 of 16
Behav. Sci. 2023, 13, 51 10 of 15
Figure 4. Box plot showing the distribution of response times in seconds from all participants.
Figure 4. Box plot showing the distribution of response times in seconds from all participants.
Table 1. Two-way analyses of variance for accuracy and response times in auditory and visual tasks.
Significance codes: 0 ‘***’
AT in general 0.001 ‘**’
required 0.01. RTs (congruent M = 0.69, SD = 0.36; incongruent M =
shorter
0.69, SD = 0.35) compared with VT. Variable congruency type had a significant effect on
Measures Sum Sq F Pr (>F)
type of modality of tasks (F = 11.19, p < 0.001); refer to Table 1 for the ANOVA results.
Accuracy
Table 1. Two-way analyses of variance for accuracy
Congruency 0.030 and response0.9220
times in auditory and visual tasks.
0.3370
Significance codes: 0 ‘***’ 0.001 ‘**’ 0.01
Modality 3.614 111.5601 F)
0.7009
Accuracy
Response Time
Congruency 0.030 0.9220 0.3370
Congruency 14.9 11.194 0.0008298 ***
Modality 3.614 111.560113, x FOR PEER REVIEW 11 of 16
Behav. Sci. 2023, 13, 51 11 of 15
3, 13, x FOR PEER REVIEW 12 of 16
Figure 5. Plot of post hoc modality predictor effect for interaction between condition (congruent and
Figure 5. Plot of post hoc modality predictor effect for interaction between condition (congruent and
incongruent distractors) and modality (auditory or visual) of the tasks.
incongruent distractors) and modality (auditory or visual) of the tasks.
3.3. Load
Effect of Task Order on Load
The NASA load TLX was employed to calculate separately the perceived load scores
for both 50.00
visual and auditory tasks. Mean load scores for the types of modality are shown
45.00
in Figure 6. For the participants who46.69completed VT first, the mean visual load was 43.60,
and the 40.00 43.60
mean auditory load was 33.17. For the participants who undertook AT first, the
Mean Load Scores
35.00
mean auditory load was36.03 36.03, and the mean visual load was 46.69. This shows that irre-
30.00
spective of the order in which the tasks were performed,33.17 the mean load of VT was con-
sistently25.00
higher than that of AT. Consequently, while the mean load for AT remained the
20.00
same irrespective of the order in which the tasks were performed, the mean load for VT
15.00
increased substantially when VT followed AT. The MANOVA results for mean load
scores and10.00
the order in which participants completed the tasks showed no significant ef-
fect of task order on the subjective load scores (F = 2, p = 0.937).
5.00
0.00
A1V2(Auditory First) V1A2(Visual First)
Auditory Task Visual Task
Figure 6. Mean load scores
Figure according
6. Mean to type
load scores of modality.
according to type of modality.
Pearson’s correlation coefficient test was conducted to determine whether any corre-
lation existed between load and RT, or between load and accuracy across modalities. The
results show that for AT, there was no correlation between load and RT (r = 0.122, t = 0.50,
p = 0.618) or load and accuracy (r = -0.19, t = −0.82, p = 0.42). However, there was a positiveative medium correlation between load and accuracy (r = −0.311, t = −1.34, p = 0.19).
For the catch conditions across both experiments, a paired t-test was conducted. For
the AT, /t/ = 3.5, there was a significant difference between participants observing (no. of
catch conditions = ≤3) and not observing the catch conditions (no. of catch conditions = 0).
For the VT, /t/ = 1.75, there was no significant difference between participants observing
Behav. Sci. 2023, 13, 51 12 of 15
(no. of catch conditions = ≤ 3) and not observing the catch conditions (no. of catch condi-
tions = 0). Refer to Figure 7 for a summary of catch conditions for each task.
Summary of catch conditions across Auditory and
Visual Tasks
No. of Catch conditions observed by
12Behav. Sci. 2023, 13, 51 13 of 15
remained almost the same. Our post hoc results also confirm this (Figure 5). This shows
that distractors incongruent to the target, irrespective of their modality, interfered with
participants’ selective attention and had an effect on their performance.
It should be noted that the congruency between targets and distractors in both AT and
VT in our study can be classified as semantic congruency. Previous studies on cross-modal
semantic congruency show that multisensory stimuli affect attentional control [36,42].
Our results showed that incongruent distractors were more distracting than congruent
distractors, and congruent distractors had no effect on target selection. The latter may
be due to the reallocation of attentional resources to the target stimuli facilitating the
performance of participants, as we included cross-modal semantic congruency in our
tasks [43]. A previous study found that attentional load did not affect the integration of
audio–visual stimuli which were semantically congruent to the target, but also revealed
potential suppression of the alertness effects induced by incongruent stimuli [42]. We also
observed no effect of semantically congruent distractors on RT for AT or VT when there
was a shift in attentional load within the tasks. The load of the tasks did not suppress
the effect of incongruent stimuli on selective attention. Irrespective of cross-modality, the
incongruent semantic distractors were more distracting during the tasks. The extent of
interference from incongruent distractors reflected in slower RTs and lower accuracy rates
might be dependent on the high working memory load or high cognitive load. High
cognitive load induced by the incongruent condition results in greater interference from
incongruent distractors.
Our third result relating to the load induced by tasks its effect on distractors stands in
contrast to the findings of previous research in the field of PLT [2,29]. PLT suggests that
higher load is accompanied by lower distractor interference, and lower load allows higher
distractor interference. In the present study, the subjective load measured using the NASA
TLX questionnaire indicated higher load scores for VT compared with AT. Participants
reported higher load for VT when it was performed after AT. According to previous studies,
this should have eliminated the interference effect of congruent as well as incongruent
auditory distractors on VT. However, the Pearson’s correlation results for VT load showed
a medium positive correlation with RT and a medium negative correlation with accuracy.
This indicates that in the high-load task (VT), the RT of the participants increased and there
was a drop in accuracy rates. Although VT was marked as a high-load task, it was more
affected than AT by distractors. In VT, 24 participants reported noticing the catch condition,
compared with only 12 participants noticing it in AT. According to previous studies in
PLT [27,29], AT should have shown higher distractor interference, as the participants in our
study reported it to be a low-load task.
The Pearson correlation results showed no significant effect of load on RT or accu-
racy for AT. Contrary to previous findings [27,44–46], which suggest that high-load tasks
improved performance by effectively blocking distractions, the present study showed
comparatively low performance in the high-load VT compared with the low-load AT.
Modality, therefore, should be considered a significant parameter when designing tasks in
PLT studies.
5. Conclusions
The present study establishes that congruency of distractors and targets affects se-
lective attention and the perceptual load of tasks. It also seems that auditory distractors
in visual tasks cause more subjective load than visual distractors in auditory task. Pre-
vious studies in PLT have indicated that if the load of a task is particularly high, neither
the modality nor congruency of distractors should affect the performance of participants.
Contrary to that notion, our results indicate that even when the load is high, congruency
affects selective attention. Our results suggest that the effects of modality should be con-
sidered when designing tasks for the study of selective attention. These results emphasise
that modality is as influential as load in terms of its effects on selective attention. In fu-
ture, further studies should be performed with a larger pool of participants from varyingBehav. Sci. 2023, 13, 51 14 of 15
backgrounds to determine the effects of other parameters including culture, gender, and
socio-economic strata, to obtain richer results.
Author Contributions: Conceptualization, P.B. and K.N.; methodology, P.B. and K.N.; validation, P.B.;
formal analysis, K.N.; investigation, P.B. and K.N.; data curation, P.B. and K.N.; writing—original draft
preparation, P.B. and K.N.; writing—review and editing, P.B. and K.N.; visualization, K.N.; project
administration, P.B. All authors have read and agreed to the published version of the manuscript.
Funding: This research received no external funding.
Institutional Review Board Statement: The study was conducted in accordance with the Declaration
of Helsinki and approved by the Institutional Ethics Committee of Birla Institute of Technology and
Science, Pilani, Hyderabad Campus, India (Protocol Code—BITS-HYD/IHEC/2022/04).
Informed Consent Statement: Informed consent was obtained from all subjects involved in the study.
Data Availability Statement: Data are available at https://osf.io/3xu52/?view_only=fdd6a1e517
8b40dbb0feb3b0cff7f612.
Acknowledgments: The authors would like to thank Kiran Kishore and Srinivasa Kommajosyula for
logistical support during experiments, and the anonymous reviewers for the critical comments for
this publication.
Conflicts of Interest: The authors declare no conflict of interest.
References
1. Lavie, N. Attention, Distraction, and Cognitive Control Under Load. Curr. Dir. Psychol. Sci. 2010, 19, 143–148. [CrossRef]
2. Macdonald, J.; Lavie, N. Visual perceptual load induces inattentional deafness. Atten. Percept. Psychophys. 2011, 73, 1780–1789.
[CrossRef] [PubMed]
3. Posner, M.I.; Boies, S.J. Components of attention. Psychol. Rev. 1971, 78, 391–408. [CrossRef]
4. Treisman, A.M. Strategies and models of selective attention. Psychol. Rev. 1969, 76, 282–299. [CrossRef]
5. Broadbent, D.E. Perception and Communication; Pergamon Press: Oxford, UK, 1966. Available online: https://pure.mpg.de/rest/
items/item_2300885/component/file_2300884/content (accessed on 18 October 2022).
6. Cherry, E.C. Some Experiments on the Recognition of Speech, with One and with Two Ears. J. Acoust. Soc. Am. 1953, 25, 975–979.
[CrossRef]
7. Deutsch, J.A.; Deutsch, D. Attention: Some theoretical considerations. Psychol. Rev. 1963, 70, 80–90. [CrossRef]
8. Lavie, N.; Tsal, Y. Perceptual load as a major determinant of the locus of selection in visual attention. Percept. Psychophys. 1994, 56,
183–197. [CrossRef]
9. Lavie, N.; Dalton, P. Load theory of attention and cognitive control. In The Oxford Handbook of Attention; Nobre, A.C., Kastner, S.,
Eds.; Oxford University Press: Oxford, UK, 2014; Volume 1, pp. 56–75. [CrossRef]
10. Beck, D.M.; Lavie, N. Look Here but Ignore What You See: Effects of Distractors at Fixation. J. Exp. Psychol. Hum. Percept. Perform.
2005, 31, 592–607. [CrossRef]
11. Cartwright-Finch, U.; Lavie, N. The role of perceptual load in inattentional blindness. Cognition 2007, 102, 321–340. [CrossRef]
12. Benoni, H.; Tsal, Y. Conceptual and methodological concerns in the theory of perceptual load. Front. Psychol. 2013, 4, 522.
[CrossRef]
13. Tsal, Y.; Benoni, H. Diluting the burden of load: Perceptual load effects are simply dilution effects. J. Exp. Psychol. Hum. Percept.
Perform. 2010, 36, 1645–1656. [CrossRef] [PubMed]
14. Lavie, N.; Lin, Z.; Zokaei, N.; Thoma, V. The role of perceptual load in object recognition. J. Exp. Psychol. Hum. Percept. Perform.
2009, 35, 1346–1358. [CrossRef] [PubMed]
15. Lavie, N.; Cox, S. On the Efficiency of Visual Selective Attention: Efficient Visual Search Leads to Inefficient Distractor Rejection.
Psychol. Sci. 1997, 8, 395–396. [CrossRef]
16. Lavie, N. Perceptual load as a necessary condition for selective attention. J. Exp. Psychol. Hum. Percept. Perform. 1995, 21, 451–468.
[CrossRef] [PubMed]
17. Li, Z.; Lou, J. Flanker tasks based on congruency manipulation are biased measures of selective attention in perceptual load
studies. Atten. Percept. Psychophys. 2019, 81, 1836–1845. [CrossRef]
18. Pfister, R.; Frings, C.; Moeller, B. The Role of Congruency for Distractor-Response Binding: A Caveat. Adv. Cogn. Psychol. 2019, 15,
127–132. [CrossRef]
19. Rosner, T.M.; D’Angelo, M.C.; MacLellan, E.; Milliken, B. Selective attention and recognition: Effects of congruency on episodic
learning. Psychol. Res. 2014, 79, 411–424. [CrossRef]
20. Forster, S.; Lavie, N. Failures to ignore entirely irrelevant distractors: The role of load. J. Exp. Psychol. Appl. 2008, 14, 73–83.
[CrossRef] [PubMed]
21. Lavie, N. Distracted and confused?: Selective attention under load. Trends Cogn. Sci. 2005, 9, 75–82. [CrossRef]Behav. Sci. 2023, 13, 51 15 of 15
22. Lavie, N.; De Fockert, J.W. Contrasting effects of sensory limits and capacity limits in visual selective attention. Percept. Psychophys.
2003, 65, 202–212. [CrossRef]
23. Murphy, G.; Groeger, J.; Greene, C. Twenty years of load theory—Where are we now, and where should we go next? Psychon.
Bull. Rev. 2016, 23, 1316–1340. [CrossRef]
24. Nees, M.A.; Sampsell, N.G. Simple auditory and visual interruptions of a continuous visual tracking task: Modality effects and
time course of interference. Ergonomics 2021, 64, 879–890. [CrossRef]
25. Spence, C. Extending the study of visual attention to a multisensory world (Charles W. Eriksen Special Issue). Atten. Percept.
Psychophys. 2020, 83, 763–775. [CrossRef]
26. Szychowska, M.; Wiens, S. Visual load effects on the auditory steady-state responses to 20-, 40-, and 80-Hz amplitude-modulated
tones. Physiol. Behav. 2020, 228, 113240. [CrossRef] [PubMed]
27. Molloy, K.; Lavie, N.; Chait, M. Auditory figure-ground segregation is impaired by high visual load. J. Neurosci. 2018, 39,
1699–1708. [CrossRef] [PubMed]
28. Merz, S.; Frings, C.; Spence, C. When irrelevant information helps: Extending the Eriksen-flanker task into a multisensory world.
Atten. Percept. Psychophys. 2020, 83, 776–789. [CrossRef]
29. Molloy, K.; Griffiths, T.D.; Chait, M.; Lavie, N. Inattentional Deafness: Visual Load Leads to Time-Specific Suppression of Auditory
Evoked Responses. J. Neurosci. 2015, 35, 16046–16054. [CrossRef]
30. Rees, G.; Frith, C.; Lavie, N. Processing of irrelevant visual motion during performance of an auditory attention task. Neuropsy-
chologia 2001, 39, 937–949. [CrossRef] [PubMed]
31. Roth, C.; Gupta, C.N.; Plis, S.M.; Damaraju, E.; Khullar, S.; Calhoun, V.D.; Bridwell, D.A. The influence of visuospatial attention
on unattended auditory 40 Hz responses. Front. Hum. Neurosci. 2013, 7, 370. [CrossRef]
32. Robinson, C.W.; Hawthorn, A.M.; Rahman, A.N. Developmental Differences in Filtering Auditory and Visual Distractors During
Visual Selective Attention. Front. Psychol. 2018, 9, 2564. [CrossRef] [PubMed]
33. Turoman, N.; Tivadar, R.I.; Retsa, C.; Murray, M.M.; Matusz, P.J. Towards understanding how we pay attention in naturalistic
visual search settings. NeuroImage 2021, 244, 118556. [CrossRef] [PubMed]
34. Laurienti, P.J.; Kraft, R.A.; Maldjian, J.A.; Burdette, J.H.; Wallace, M.T. Semantic congruence is a critical factor in multisensory
behavioral performance. Exp. Brain Res. 2004, 158, 405–414. [CrossRef] [PubMed]
35. Mishra, J.; Gazzaley, A. Attention Distributed across Sensory Modalities Enhances Perceptual Performance. J. Neurosci. 2012, 32,
12294–12302. [CrossRef]
36. Li, Q.; Yu, Y.; Liu, Y.; Xu, Z.; Fan, L.; Takahashi, S.; Yang, J.; Ejima, Y.; Wu, Q.; Wu, J. Whether attentional loads influence
audiovisual integration depends on semantic associations. Atten. Percept. Psychophys. 2022, 84, 2205–2218. [CrossRef] [PubMed]
37. Apel, K. What Is Orthographic Knowledge? Lang. Speech Hear. Serv. Sch. 2011, 42, 592–603. [CrossRef]
38. Apel, K.; Henbest, V.S.; Masterson, J. Orthographic knowledge: Clarifications, challenges, and future directions. Read. Writ. 2018,
32, 873–889. [CrossRef]
39. Gore, B.F.; Kim, R.H. NASA TLX for iOS: User Guide v1.0. NASA-Human Systems Integration Division. 15 August 2019.
Available online: https://humansystems.arc.nasa.gov/groups/tlx/tlxapp.php (accessed on 18 October 2022).
40. McEvoy, S.P.; Stevenson, M.R.; Woodward, M. The prevalence of, and factors associated with, serious crashes involving a
distracting activity. Accid. Anal. Prev. 2007, 39, 475–482. [CrossRef]
41. Forster, S.; Lavie, N. Faces are not always special for attention: Effects of response–relevance and identity. Vis. Res. 2021, 189,
1–10. [CrossRef]
42. Yu, H.; Wang, A.; Zhang, M.; Yang, J.; Takahashi, S.; Ejima, Y.; Wu, J. Semantically congruent audiovisual integration with
modal-based attention accelerates auditory short-term memory retrieval. Atten. Percept. Psychophys. 2022, 84, 1625–1634.
[CrossRef]
43. Mastroberardino, S.; Santangelo, V.; Macaluso, E. Crossmodal semantic congruence can affect visuo-spatial processing and
activity of the fronto-parietal attention networks. Front. Integr. Neurosci. 2015, 9, 45. [CrossRef]
44. Lavie, N.; Beck, D.; Konstantinou, N. Blinded by the load: Attention, awareness and the role of perceptual load. Philos. Trans. R.
Soc. B Biol. Sci. 2014, 369, 20130205. [CrossRef] [PubMed]
45. Nagle, F.; Lavie, N. Predicting human complexity perception of real-world scenes. R. Soc. Open Sci. 2020, 7, 191487. [CrossRef]
[PubMed]
46. Stolte, M.; Bahrami, B.; Lavie, N. High perceptual load leads to both reduced gain and broader orientation tuning. J. Vis. 2014,
14, 9. [CrossRef] [PubMed]
Disclaimer/Publisher’s Note: The statements, opinions and data contained in all publications are solely those of the individual
author(s) and contributor(s) and not of MDPI and/or the editor(s). MDPI and/or the editor(s) disclaim responsibility for any injury to
people or property resulting from any ideas, methods, instructions or products referred to in the content.You can also read