Anatomy of a Work Truck - Doyle Sumrall
←
→
Page content transcription
If your browser does not render page correctly, please read the page content below
Anatomy of a Work Truck

Understand the Terms, Lingo   Doyle Sumrall
                              Managing Director
and Processes Used by OEMs,
Upfitters and Fleets
December
Clean Cities / 1 2013
ABOUT THE NTEA
Established in 1964, NTEA, the Association for the Work Truck Industry, represents approximately1,600 companies that

manufacture, distribute, install, sell and repair commercial trucks, truck bodies, truck equipment, trailers and

accessories. Buyers of work trucks and the major commercial truck chassis manufacturers also belong to the

Association. The NTEA provides in-depth technical information, education and member programs and services, and

produces The Work Truck Show®. The Association maintains its headquarters in suburban Detroit and a government

relations office in Washington, DC. For more information, call 1-800-441-6832 or visit www.ntea.com.

About the Green Truck Association

The GTA is an affiliate division of the NTEA. Its mission is to improve the efficiency and productivity of work trucks

through the development and deployment of strategies to reduce diesel and gasoline consumption and the associated

environmental impacts. To learn more, visit www.greentruckassociation.com.

                                                                                                                         2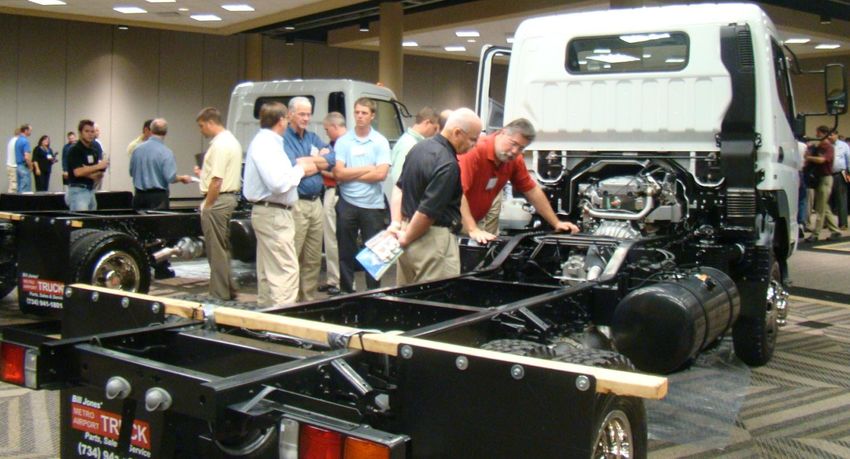
Class 1-8 U.S. Retail Sales

                                                U.S. Retail Truck Sales
                          3,000

                          2,500

                          2,000
 Strong
          Units (000's)

Ongoing                   1,500

Market
                          1,000

                           500

                             0
                                  2007   2008   2009   2010   2011   2012   2013    2014     2015   2016   2017

                                          Class 1-2    Class 3-5     Class 6-7     Class 8

                                                                                                                  3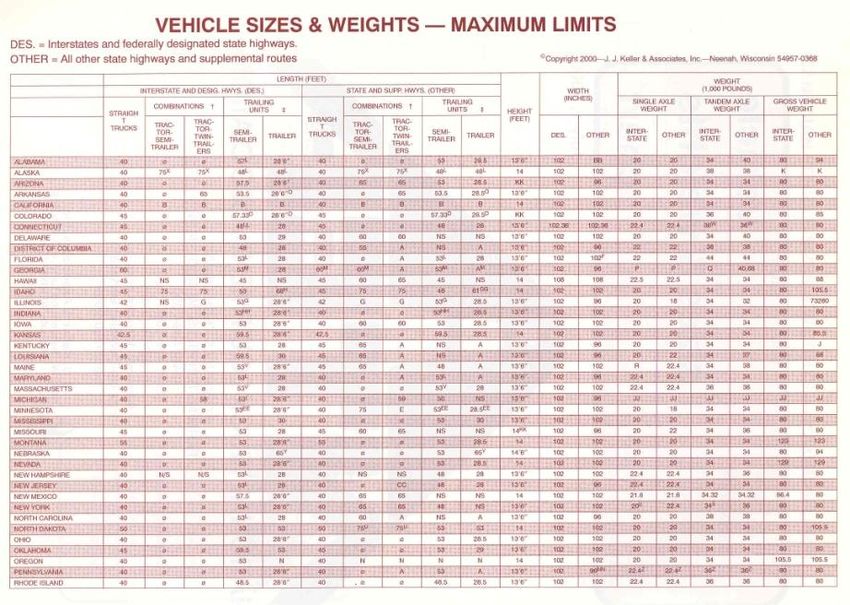
Complexities of the Supply Chain
                           Federal
                         Government
       State & Local
                         Funding and
        Funding and
                        Tax Incentives
       Tax Incentives

 Clean Cities,
 Associations,
    Others

    Green Tech
     Suppliers

                                         4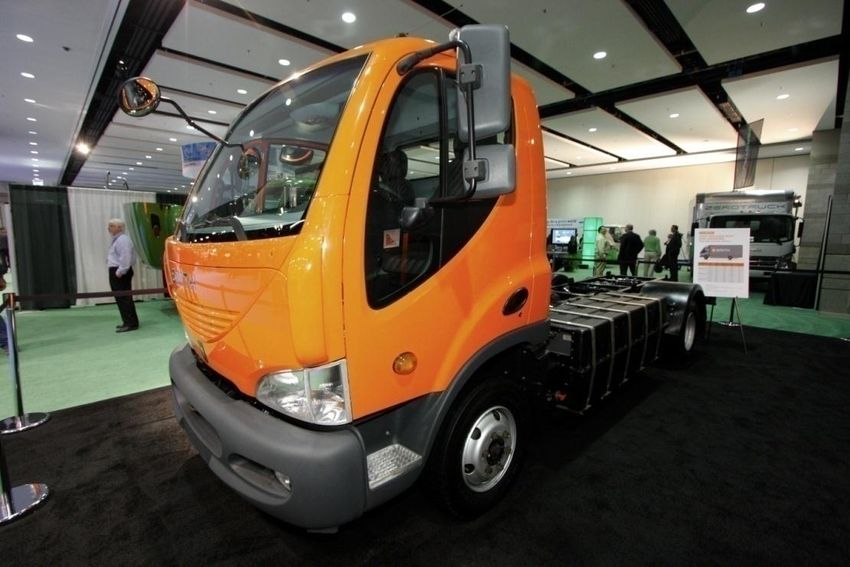
Vocational Demographics

 287 Fleet Respondents
 Source: 2013 NTEA Fleet Purchasing Outlook
Fuel-saving Strategies

      FLEETS TAKE MULTI-FACETED APPROACH

Source: 2013 NTEA Fleet Purchasing Survey

                                            6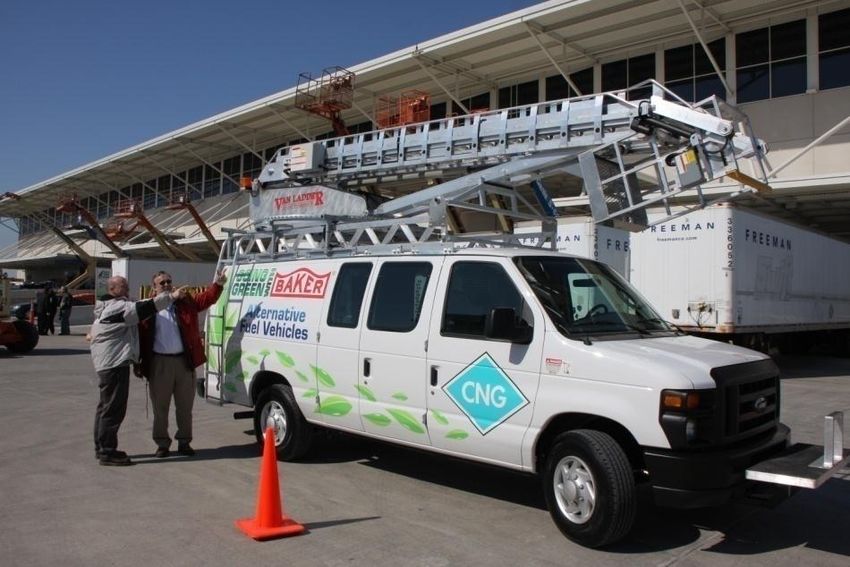
OEM Perspective

  • CNG is a prime focus
  • An order of magnitude breakthrough is needed for
    electric hybrid and/or electric drive
  • Diesel will be with us for a very long time and we
    can expect breakthroughs in this engine
    technology
  • Fleets / users see life-cycle cost as the prime
    acquisition criterion
ANATOMY OF A WORK TRUCK
Understanding the terms and lingo used by
OEMs and Fleets
America's truck population is estimated to be more than 90 million
vehicles with 4 million being vocational vehicles. Employing more
than 175,000 Americans, the truck body and equipment industry
produces $15 billion+ in annual sales. Adding chassis manufacturers
to this already-substantial figure creates a total market of $67 billion.
Although these figures represent only a small percentage of the
multibillion-dollar transportation industry, our country's economy and
productivity depend largely on this highly specialized trade.

                                                                            9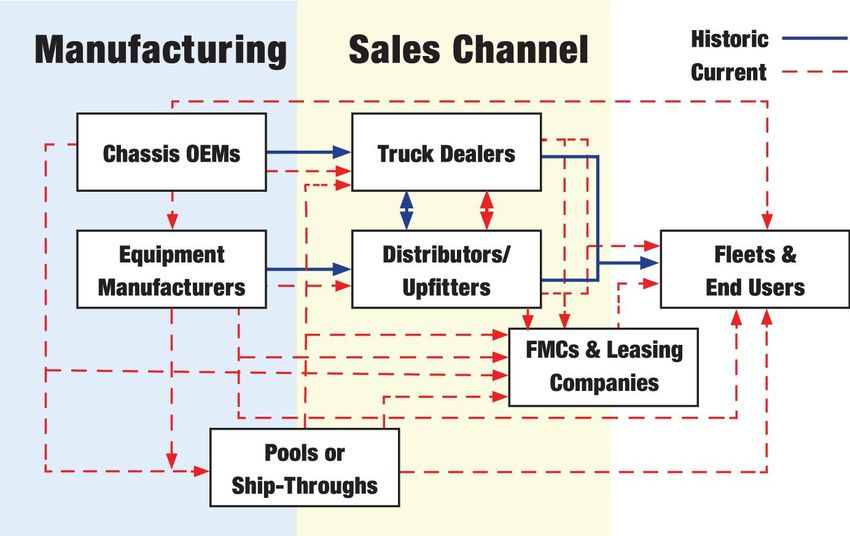
Work Trucks

 Unlike mass-produced assembly-line passenger cars and
 trucks, commercial vehicles are primarily designed and
 produced individually, on a custom-order basis. Their diverse
 applications, limited volume, and nearly limitless body and
 equipment variations dictate this method of production.

                                                                 10
Where a Work Truck Starts
Each commercial vehicle originates at the assembly plant of one of
the world's truck/truck chassis manufacturers. Approximately 15
companies produce light- and medium-duty trucks, truck chassis,
and cab-chassis (basically, a cab, frame and drive -train) suitable for
completion as commercial vehicles. Through truck dealerships,
these products are supplied to truck body and equipment firms for
final assembly and installation before delivery to the customer or
end-user.
11WB = Chassis Wheel Base
CA/CT = Cab to Axle/or Cab to Center of Tandem
CB = Cab to Body Clearance
AC = Front Axle to Back of Cab (WB - CA = AC)
or (BBC - BA = AC)
BA = Front Bumper to Front Axle
BBC = Front Bumper to Back of Cab
BL = Body Length
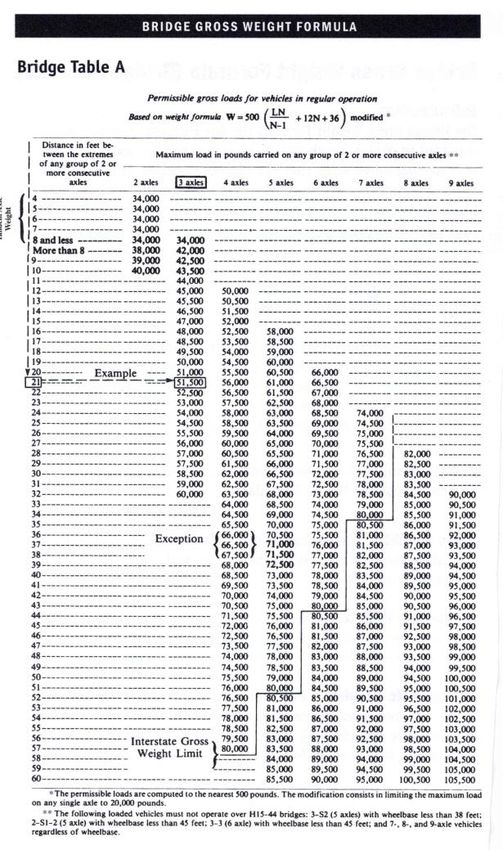
12Carrying Loads
CW = Chassis Curb Weight
CWR = Chassis Curb Weight - Rear
GAWR.F = Gross Axle Weight Rating - Front
GAWR.R = Gross Axle Weight Rating - Rear
GVWR = Chassis Gross Vehicle Weight Rating
1314
Adding Axles
The dead axle is installed either ahead of the live axle or behind
it, depending on the truck and the operation. When installed
behind the live axle it is called a tag axle. When installed in front of
the driving axle it is called a pusher axle.
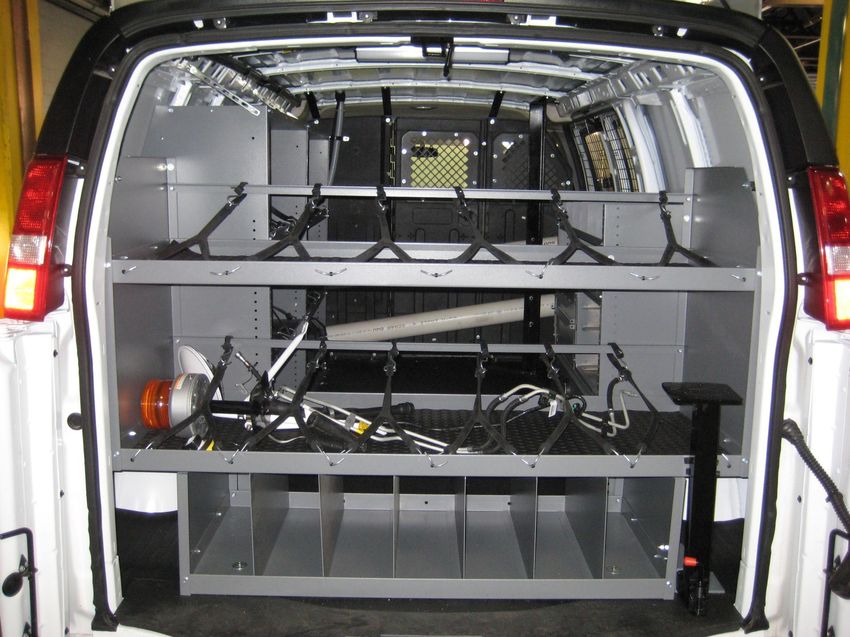
15Common Components Components of commercial vehicles range from tiny gears and parts to larger products such as cranes, snowplows and liftgates. Here are some common truck equipment and accessories: Aerial Devices Lift Axles Alarms Lift Gates/Platforms Brake Components Lights Bumpers Power Take-Offs (PTOs) Cabs Pumps Cargo Control Equipment Racks Cranes Ramps Drive-line Components Refrigeration Systems Fifth Wheels Refuse Equipment Fuel Tanks Shelving/Bins Hardware Snowplows Hitches Toolboxes Hoists Winches Hydraulic Components 16
Making a Chassis a Work truck
Depending on its application, a commercial truck can require a
few basic pieces of equipment (such as a snowplow or a stake
body) or a wide variety of components. It is the distributor's role to
combine and install all of these components, supplied by their
various manufacturers, to complete the truck for its specific use.
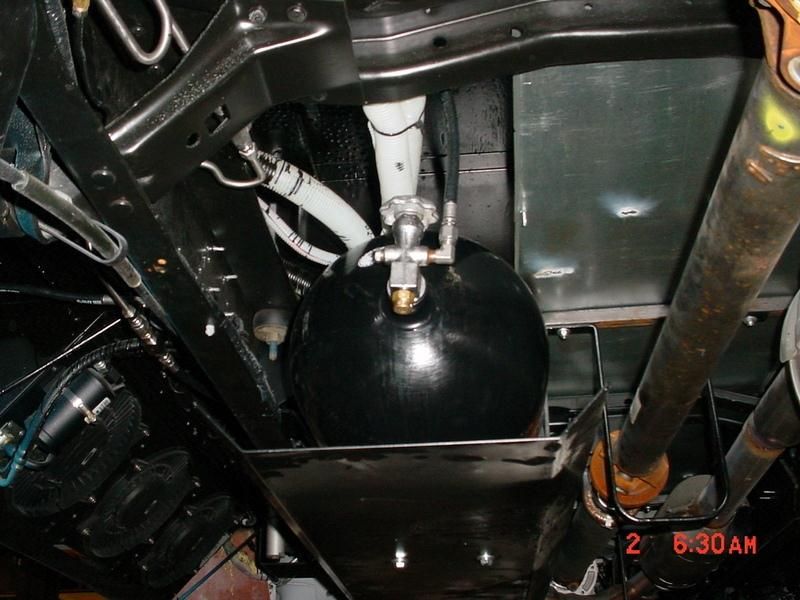
17Green Fleet & Truck Efforts
18DESIGN AND ENGINEERING
OF A WORK TRUCK
19Motor Vehicle Certification
Understanding Multi-Stage Vehicle Certification
and Labeling Requirements
20Certify to What?
Certify that the motor vehicle conforms to all
applicable Federal Motor Vehicle Safety
Standards (FMVSSs).
• 49 CFR Part 571 - FMVSS
• 61 FMVSS
• 48 FMVSS applicable to “Trucks”
21Law & Regulations
Law: Title 49, United States Code Section 30115 –
Certification of Compliance
National Highway Traffic Safety Administration
(NHTSA) Regulations:
• 49 CFR Part 567-Certification
• 49 CFR Part 568-Vehicle manufactured in two or
more stages
22Who is Required to Certify?
Final stage manufacturers,
intermediate manufacturers and
alterer of motor vehicles and motor
vehicle equipment
23It is about the work system, not the just the truck!
24What and Why of Weight
Distribution
WHY? For compliance with:
Wheel/tire capacities State weight laws
Axle capacities – GAWRs Federal weight laws
Vehicle capacity – GVWR FMVSS
25CRITICAL ELEMENTS OF
CERTIFICATION
Payload analysis
Weight Distribution
FMVSS Compliance Analysis
Drive and Duty Cycle
26Payload Analysis
27Maximum Net Payload Analysis
Component Weight
Chassis 5,906 lbs / GVWR 9,800 lbs
Body 1,355 lbs
Winch 150 lbs
Crane 630 lbs
Cargo 1,300 lbs (Customer Requested)
Passengers 450 lbs
28Space
Weight
Safety
Vertical CG
29Basic Principles
Combined Center of Gravity
When a group of objects are combined
they have a combined Center of Gravity.
3D View Front View Side View
30What and Why of Weight
Distribution
32,000 lbs 46,000 lbs
12,000 lbs 20,000 lbs 12,000 lbs 17,000 lbs each
34,000 lbs total
WHAT – weight distribution is the amount of the total vehicle weight imposed on the ground at an
axle, group of axles, or an individual wheel. The weight on a truck must be distributed on the
axles to comply with the chassis manufacturer’s axle ratings and the weight laws.
In the examples above, having the correct wheelbase on the chassis and placing the bodies and
loads in the proper place will assure that the axles are loaded correctly. Doing a weight
distribution will tell us that we can achieve the proper axle loadings before building the truck.
31Center of Gravity
Dt
Dw Dc Wt
Ww Wc
Dg
Db
Wb Wg
Moments give us a way to combine a number of components or items to calculate a center-of-
gravity for them as a group. When we know the center-of-gravity distance for all of the items
combined, we can calculate the weight on each axle.
(Total Moment)
Dc*Wc + Db*Wb - Dw*Ww + Dg*Wg
Dt =
Wc + Wb + Ww + Wg
(Total Weight = Wt)
32Weight Distribution
• Perform weight distribution using maximum net
payload to determine if GAWRs are exceeded. If
so, reduce payload accordingly and revise
payload analysis.
• Both payload analysis and weight distribution
need to be kept as part of certification
documentation.
33Vehicles 10,000 lbs GVWR and
Under
Some example restrictions due to barrier test
requirements:
• Maximum vertical Center-of-Gravity for the body
• Maximum added equipment weight
• Curb weight of the finished vehicle
• Minimum cab-to-body clearance
34Final Stage Certification Label
For Chassis Cabs, Cutaways, Chassis Cowls
and Strip Chassis
35Final Stage Certification Label
For Chassis Cabs, Cutaways, Chassis Cowls and
Strip Chassis Over 10,000 lbs
+ or or
Not Necessary
36Hierarchy of Application
?
Electric Vehicles
Hybrid Vehicles
Gaseous Fuel
Aerodynamics High Efficiency Engines
Component Electrification Telematics
Driver Involvement Weight Reduction Idle Reduction
Pyramid of Solutions
37% of Fleets See Factor as High
Importance GRANTS
LIFE CYCLE TAX
COST INCENTIVES
REDUCED
ABILITY TO
OPERATING ALL FLEETS
LEASE
COST GOVT. & MUNICIPAL
AGRICULTURAL
CONSTRUCTION
UTILITY/ TELECOM
ACQUISITION 3 YEARS
DELIVERY/ CARTAGE
COST PAYBACK
OTHER
Source: 2013 NTEA Fleet Purchasing Outlook
(Acquiring fleets)Using Analysis and Tools to
Understand Payback
Life Cycle Cost
Validation & Insights
Drive & Duty Cycle Data
Refine
• UNDERSTANDING USE & NEEDS
• COMPARING TECHNOLOGY & FUELS
• DEVELOPING BUY-IN
• REFINING RESULTS 39Using Analysis and Tools to
Understand Payback
Drive and Duty Cycle Data
Validation and Insights
40Green Fleet Tool
For details, contact aburnham@anl.gov
41Hybrid Work Truck Payback Calculator
Hybrid Work Truck Payback Worksheet
Conventional Vehicle Usage Profile:
Average vehicle use per year (Days) 235
Projected vehicle life (Years) 13.5 (Maximum 15 years)
Average Hours of vehicle use per day 8.1
Operating Profile: Hours per day -- Stop / Go 2.3
Hours per day -- Open highway 0.1
Hours per day -- Idle time 4.7
Hours per day -- Shutdown 1
Stop & Go Driving Profile: (Select one) High frequency stop and go driving 15+ cycles / hour)
(Place an "X" in appropriate block) x Medium frequency stop and go driving conditions (8-14 cycles / hr.)
Low frequency stop and go driving conditions (7 or fewer cycles per hour)
Fuel Consumption Data -- Current Application
Average gallons of fuel consumed per hour -- In Transit 2
Average gallons of fuel consumed per hour -- Idling 1.8
Average gallons of aux engine fuel consumed per hour 0.5
Average cost of fuel (per gallon) 5.15
Hybrid Projected Operating Cost Reductions:
Idle reduction: 4.3 Hours per day (average)
Auxiliary engine use reduction 2 Hours per day (average)
Data Source © 2013 Odyne Systems, LLC All rights reserved
42Hybrid Work Truck Payback Calculator
Hybrid Work Truck Payback Worksheet
Hybrid Projected Maintenance Cost Differential:
Brakes -- Current application demand cost per year 250
Engine -- Current application demand cost per year 2000
Auxiliary engine savings / year (reduced use or elimination) 500
Hybrid energy storage system maintenance cost 1000 in year 8
(battery replacement, accumulator rebuild, etc.)
Projected Hybridization Cash Flows per year
Year Transit Fuel Savings Idle Fuel Savings Aux Fuel Savings Maintenance Cost Differential Hybrid Total $ by
Gallons $ Gallons $ Gallons $ Brakes Engine Auxiliary Maint. Year
1 432 2,227 1,011 5,204 235 1,210 180 1,211 500 10,532
2 432 2,227 1,011 5,204 235 1,210 180 1,211 500 10,532
3 432 2,227 1,011 5,204 235 1,210 180 1,211 500 10,532
4 432 2,227 1,011 5,204 235 1,210 180 1,211 500 10,532
5 432 2,227 1,011 5,204 235 1,210 180 1,211 500 10,532
6 432 2,227 1,011 5,204 235 1,210 180 1,211 500 10,532
7 432 2,227 1,011 5,204 235 1,210 180 1,211 500 10,532
8 432 2,227 1,011 5,204 235 1,210 180 1,211 500 -1,000 9,532
9 432 2,227 1,011 5,204 235 1,210 180 1,211 500 10,532
10 432 2,227 1,011 5,204 235 1,210 180 1,211 500 10,532
11 432 2,227 1,011 5,204 235 1,210 180 1,211 500 10,532
12 432 2,227 1,011 5,204 235 1,210 180 1,211 500 10,532
13 432 2,227 1,011 5,204 235 1,210 180 1,211 500 10,532
14 432 2,227 1,011 5,204 235 1,210 180 1,211 500 10,532
Total Fuel 6,054 14,147 3,290
Total Dollars 31,176 72,857 16,944 2,516 16,958 7,000 -1,000 146,450
Net present value of total life cycle savings at 5.2% rate of return: $102,592.04
Data Source; © 2013 Odyne Systems, LLC All rights reserved 43Commercial Vehicles In Use
Class 3-8 U.S.
(January 2011-September 2013)
14,000,000
12,000,000
U 10,000,000
n
i 8,000,000
t
s 6,000,000
4,000,000
2,000,000
0
2011 2012 Sep-13
Class 3 Class 4-7 Class 8
44Work Trucks Come in All Shapes
and Types
45Where should a fleet begin? Source:
Anatomy of a Work Truck

     Thank you!
         Doyle Sumrall, Managing Director, NTEA
                    (330) 283-2176
                   doyle@ntea.com

                                                  47
You can also read