Anger and Support for Retribution in Mexico's Drug War
←
→
Page content transcription
If your browser does not render page correctly, please read the page content below
Anger and Support for Retribution
                in Mexico’s Drug War

                                        April 8, 2020

                                           Abstract

How does exposure to violence shape attitudes towards justice and the rule of law? We argue
that anger following violence increases the demand for retribution, even at the expense of the
rule of law. We test this theory using three observational and experimental studies from an
original survey of 1,200 individuals in Western Mexico, a region affected by organized crime
and vigilantism. We first show that individuals exposed to more violence are angrier and
more supportive of punitive justice, including vigilantism. Second, both experiments show
that citizens are more supportive of harsh punishments, and place less value on their legality,
for morally outrageous violence. Third, the innocence of the victim has a stronger effect on
anger and punitiveness than the severity of the violence. Our findings suggest that individual
emotional reactions to violence—particularly against civilians—can lead to cycles of retribution
that undermine the rule of law and perpetuate insecurity.

                                   Word Count: 11,971
1
Introduction
“They kidnapped my sisters. They tried to kill my wife and my children. And when they started
going into the schools and taking the baby girls, 11-year-olds, 12-year-olds, that was my breaking
point... We have a lot of anger.”
—José Manuel Mireles, Autodefensa leader quoted in The Washington Post1
In February 2013, Hipólito Mora organized a group of residents from La Ruana, a small town in
Michoacán, Mexico, to fight against Los Templarios, the drug cartel that had terrorized the state for
years. Vigilante groups like those formed in La Ruana became known as autodefensas (self-defenders).
In the period before the uprising, Los Templarios were demanding 20 percent of local farmers’
revenues and kidnapping or killing those who refused to pay. In La Ruana and other localities,
many civilians gave money and other support to the autodefensas’ action against corrupt police
forces and violent drug cartels.2
For a short period in 2013, security in areas under the autodefensas’ control seemed to im-
prove. Yet by early 2014, some autodefensas leaders were accused of being allied with criminal
organizations, and engaged in clashes with neighboring autodefensas over control of lucrative lime
orchards.3 Almost seven years after the emergence of the autodefensas, official statistics show that
violence in the region around La Ruana has increased. Cases like La Ruana are puzzling: Why do
citizens support vigilantes although they often seem to exacerbate violence and undermine the rule
of law?
1 McCrummen, Stephanie, “In the hills of Michoacán, self-defense groups battle a Mexican drug
cartel,” The Washington Post, 9 Sep 2013, https://www.washingtonpost.com/world/the_americas/
in-the-hills-of-michoacan-self-defense-groups-battle-a-mexican-drug-cartel/2013/09/09/
6947e47a-119f-11e3-a2b3-5e107edf9897_story.html?noredirect=on&utm_term=.a8465e5752d9.
2 See https://www.newyorker.com/magazine/2017/11/27/a-mexican-town-wages-its-own-war-on-drugs.
3 Macias, Veronica, “Edil de Buenavista defiende a El Americano,” El Economista, 11 Mar 2014, https://www.
eleconomista.com.mx/politica/Edil-de-Buenavista-defiende-a-El-Americano-20140311-0129.html.2
The sequence of events in La Ruana follows a common pattern in communities affected by
violence: outrageous crimes lead to a demand for harsh punishment, even at the cost of the rule
of law. Political parties and leaders in diverse contexts, including Brazil, El Salvador, and the
Philippines, have used populist appeals to harsh, punitive justice to great electoral success, with
little evidence of actual crime reduction (Holland, 2013). Even in the U.S. ‘stand your ground’
laws are supported by a majority or large plurality of Americans, despite evidence suggesting that
these laws may actually increase homicides (Cheng and Hoekstra, 2013; Humphreys, Gasparrini
and Wiebe, 2017).4 In contrast, public opinion has stymied efforts to scale up incentive-based
programs to reduce violence, although evaluations suggest these programs are effective.5 It seems
that citizens—and victims of crime in particular—support harsh or violent criminal justice even
if this leads to increased violence, and oppose less punitive policies that have a track record of
reducing violence. What drives this taste for harsh punishment? Under what conditions is it likely
to dominate considerations like the prevention of future crime or procedural legality?
We propose a theory that emotions induced by violence affect citizens’ attitudes towards
criminal justice policies. We argue that citizens do care about the effectiveness of different policies or
actions when thinking about punishing criminals. Yet they also want to punish criminals in a way
that corresponds to their crimes. Specifically, we theorize that exposure to criminal violence induces
anger, which increases the demand for punishment. Yet, only certain types of crime—those in
which the victims are perceived as innocents—cause people to feel outraged and therefore prioritize
retribution.
Our research is related to studies on how exposure to violence, including crime, affects political
beliefs and behavior (see Bauer et al., 2016, for a review). Recent work has examined the political
4 DeLuca, Matthew, “Majority of Americans support ’Stand Your Ground’ laws: poll,” NBC News, 3 Nov 2015, https://
www.nbcnews.com/news/us-news/majority-americans-support-stand-your-ground-laws-poll-flna6C10825023.
5 Davis, Aaron, The Washington Post, “D.C. abandons plan to pay criminals to stay out of trouble,” 5 May 2016, https://
www.washingtonpost.com/local/dc-politics/dc-abandons-plan-to-pay-criminals-to-stay-out-of-trouble/
016/05/05/6e4ad018-12af-11e6-8967-7ac733c56f12_story.html.3
effects of crime exposure in Latin America (Malone, 2010; Bateson, 2012; Romero, Magaloni and
Díaz-Cayeros, 2016; Ley, 2017). One important issue raised by these studies is whether exposure
to violence is associated with political attitudes that exacerbate or defuse violence. The empirical
evidence is mixed. Canetti-Nisim et al. (2009) and Getmansky and Zeitzoff (2014) find that violence
exposure increases public support for escalatory policies, while others find that it leads to more
conciliatory, pro-compromise positions (Lyall, 2009; Hazlett, 2013; Beber, Roessler and Scacco, 2014;
Zeitzoff, 2014). This literature does not disaggregate violence based on characteristics that might
shape citizens’ reactions, such as the manner in which civilians are targeted, the severity of the
violence, and the amount of time that has passed since exposure occurred. It has also generally
remained agnostic about the mechanisms that might link violence to changes in preferences or
behavior. In this study, we develop and test a theory regarding the types of violence that are most
likely to cause increases in support for harsh escalatory policies, and measure emotions as a specific
mechanism driving those preferences.
We also contribute to the literature on vigilantism, an important and understudied form of
political violence. While we are primarily focused on support for harsh punishments, regardless of
whether they are carried out by the state or vigilantes, increases in punitiveness can lead citizens
to increase support for vigilante punishments if the state is not carrying out the punishments that
citizens want. Much of the recent literature focuses on the structural determinants of vigilante acts
and groups, including the legitimacy of state security forces (Tankebe, 2009; Zizumbo-Colunga,
2017; Jung and Cohen, 2019), the presence of indigenous communal organization (Mattiace, Ley
and Trejo, 2019), or economic institutions that activate and channel citizen grievances over crime
into action (Moncada, 2019). Others have found support for economic explanations for vigilante
groups. For example, Ley, Ibarra Olivo and Meseguer (2019) find that remittance flows increase
the presence of armed vigilantes, and Phillips (2017) shows that local inequality is associated4
with vigilante presence. In contrast to these structural explanations, we show that individual-
level psychological processes have an important causal effect on support for harsh and vigilante
punishments, regardless of an important structural factor like the level of state coercive capacity.
We conduct three separate observational and experimental studies to test this theory. We
conducted these tests as part of a face-to-face survey of 1,200 residents in Western Mexico, including
in some areas with a history of vigilante mobilization. First, we examine whether those exposed
to higher levels of violence prefer more punitive policies and are angrier (Study 1). Second, we
test whether scenarios that induce higher levels of anger and moral outrage cause people to prefer
harsh, illegal punishments (Study 2). Finally, we use a set of 125 randomly generated scenarios to
test whether across a broad spectrum of violent crimes, violence that is more severe or targeted on
innocent victims induces higher levels of anger, and causes people to prefer harsh and extrajudicial
punishments (Study 3).
The combination of these three studies enables us to draw conclusions that are based on
highly realistic variation, generalizable to a large population of interest, and causal. The first
study’s observational design looks at real variation in exposure to violence and its effects on policy
preferences and anger in a representative sample. This research design enables us to examine
whether there is a substantively meaningful relationship between policy preferences, anger, and
exposure to violence. The second study, a survey experiment, enables us to test for specific
causal mechanisms and to estimate the effects of anger resulting from hypothetical exposure to
outrageous violence. Finally, in the third study, we use a factorial experimental design that provides
causal estimates of the effects of a wide range of crime scenarios. All of our hypotheses, and the
research designs of the two experiments, were pre-registered in advance of analysis with the EGAP
experimental design registry.6
6 See EGAP ID #XXXX for more information.5
These studies yield four key findings. First, exposure to violence is correlated with increased
levels of anger and support for harsh punishments, including those carried out by vigilantes. Sec-
ond, across our two experiments we find that morally outrageous crimes increase support for harsh
punishments, and cause citizens to care less about the legality of punishments. Importantly, we
find no evidence that exposure to violence causes citizens to develop a specific taste for vigilantism.
Instead, our evidence suggests that citizens turn to vigilantes because they promise harsher punish-
ments than the state is willing or able to deliver. Third, the innocence of victims rather than the
severity of the violence has the largest effect on outrage and preferences for harsh punishments.
Finally, we find no evidence that the relationship between exposure to violence and support for
harsh or extrajudicial punishments is stronger in areas of low state security capacity. This last
finding suggests that the relationship between violence, anger, and support for harsh punishments
is driven by a desire for punishment for its own sake, and not a strategic logic of deterrence in
places where the state is absent.
Many studies of political violence highlight the role of elites and group identities in shaping
violence (Wilkinson, 2006; Wolf, 2017). Yet our study provides a bottom-up explanation for why
suboptimal cycles of violence may continue. We show that anger is a key emotional mechanism
connecting violence to support for punitive and extrajudicial justice. But the type of violence
matters. Specific types of violent events (in particular violence where victims are perceived as
innocent) set off the desire for harsh punishment. This desire for harsh punishment comes at the
cost of the rule of law. This suggests that voters may be willing to tolerate high levels of violence, as
long as the violence is restricted to perceived criminals. It also suggests that policymakers who care
about the rule of law should invest first in reducing the types of violence that are directly targeted
on civilians, like extortion and other forms of abuse, rather than pursuing the most high-profile
murders. More generally, these findings suggest that emotions play a critical role in setting off cycles6
of retributive violence that may end up making citizens less safe. Citizens exposed to outrageous
violence want harsh punishments and are more willing to welcome vigilante acts regardless of
whether state security forces are present or not.
Anger, Exposure to Violence, and Attitudes Towards Justice
Principles Underlying Criminal Justice Preferences
Early political theorists suggested two rationales for punishing crimes: retribution and prevention.
Retribution is retrospective, focusing on the perpetrator’s “just deserts” to argue that the punishment
should be proportional to the severity of the crime or how morally outrageous it is (Kant, 1952). If
punishments are determined according to this principle, the severity of the harm and the existence of
extenuating circumstances that mitigate or exacerbate the moral outrage should be strongly related
to the severity of the punishment (Darley, Carlsmith and Robinson, 2000). In contrast, utilitarian
legal scholars argue that “general prevention ought to be the chief end of punishment” (Bentham
1962). More recent theorists argue that citizens also care about equitable treatment, otherwise
known as “procedural justice” (Lind and Tyler, 1988). Procedural justice theorists argue that while
individuals care about punishing wrongs, what they really care about is fairness and transparency
in the judicial process because punishments derive their legitimacy from fair processes (Tyler, 2006).
Research in the U.S. has attempted to identify whether aggregate attitudes towards criminal
justice policy are driven by a logic of retribution, prevention, or procedural justice. Public opinion
researchers have argued that the popularity of the death penalty and three strikes laws is primarily
motivated by a logic of retribution (Roberts et al., 2002; Enns, 2014). Political psychologists have
also used vignette experiments to show that participants prefer harsher punishments for crimes
that are morally outrageous, but not necessarily for those in which the punishment is more likely7
to deter or incapacitate a future crime (Darley, Carlsmith and Robinson, 2000; Carlsmith, Darley
and Robinson, 2002). Research from behavioral economics suggests that this preference for harsh
punishments may be part of a more general willingness to punish, even when it is personally costly
(Camerer and Thaler, 1995; Carpenter, 2007).
Emotions and Preferences Over Criminal Justice
What cognitive processes make someone willing to sacrifice their personal welfare in order to exact
a severe punishment? Theories on emotions and cognition from psychology provides a foundation
for how anger can increase the taste for punishment. Anger is an approach-oriented emotion that
prepares individuals to take action in order to rectify perceived wrongs or slights (Frijda, 1986;
Carver and Harmon-Jones, 2009); this push to action distinguishes anger from other moral emotions
like contempt or moral disgust (Haidt, 2001; Hutcherson and Gross, 2011). Previous experiments in
psychology and behavioral economics have shown that inducing anger increases punitiveness and
associated appraisals and behaviors (Lerner and Keltner, 2001; Srivastava, Espinoza and Fedorikhin,
2009; Bastian, Denson and Haslam, 2013).
There is evidence that anger is correlated with a preference for harsh criminal justice policy
(Johnson, 2009) and can cause increases in punitiveness in hypothetical crime scenarios in an
experimental setting (Lerner, Goldberg and Tetlock, 1998). Research in political science has also
argued that anger can be a strong driver of participation in politics and violence (Petersen, 2002;
Wood, 2003; Balcells, 2017; Young, 2015). Similarly, social psychologists have argued that anger
plays an integral role in explaining preferences for punishment because crime violates sacred values
and produces moral outrage. Garland (2012) argues that “(t)he criminal act violates sentiments
and emotions which are deeply ingrained in most members of society – it shocks their healthy
consciences – and this violation calls forth strong psychological reactions, even among those not8
directly involved. It provokes a sense of outrage, anger, indignation, and a passionate desire for
vengeance” (30). Studies of political violence and terrorism have similarly argued that the emotions
and stress induced by violent events can affect threat perceptions, punitiveness, and political
preferences (Huddy et al., 2005; Merolla and Zechmeister, 2009; Canetti et al., 2013; Hirsch-Hoefler
et al., 2016).
What kind of punishments or policies will angry individuals prefer when the state is unable
or unwilling to punish? Most of the public opinion research on criminal justice policy has been
conducted in high-capacity states like the U.S. However, exposure to violence is generally higher in
poorer states where the public is less confident that the government can effectively implement harsh
punishments.7 In such a setting, the taste for punishment might be more likely to lead affected
individuals to prioritize retribution over legality and prevention of future harm, and ultimately to
turn to extrajudicial options such as spontaneous lynchings or vigilante groups.
A Theory of Emotions, Violence, and Justice
What forms of violence are most likely to set off angry reactions that lead citizens to prioritize
retribution? In this section we outline a theory of how exposure to certain types of violence will
induce emotions that cause shifts in how citizens prioritize justice, punitiveness, and effectiveness
in crime responses.
The first stage of our theoretical framework is exposure to violence. Violence that violates
moral principles should be particularly likely to induce anger. We focus on two types of violence
that violate clear moral tenets: first, violence that is extremely severe, and second, violence that is
targeted on innocents. LeeAnn Fujii calls extreme violence intended to transgress shared norms
about proper treatment of persons and bodies “extra-lethal” and notes that it is often also described
7 See“2018 Gallup 2018 Global Law and Order Report” https://news.gallup.com/reports/235310/
gallup-global-law-order-report-2018.aspx.9
as “senseless,” “gratuitous” or “excessive” (2013). This type of violence should generate anger by
going beyond what is perceived as necessary to achieve a violent actor’s goal of killing a victim or
by violating core values (Atran, Axelrod and Davis, 2007). Conversely, violence between different
groups of professional criminals—which characterizes a large proportion of homicides and other
violence in Mexico—should not have the same anger-inducing effects. Thus, our first prediction is
that exposure to violence will be associated with the emotion of anger, especially if the violence is
severe or targets victims who are perceived as innocent (Prediction 1).
The second stage of our theoretical framework focuses on the role of anger in shaping criminal
justice preferences. We argue that anger shifts the weight that individuals place on punishments
being punitive, legal, and effective in preventing future violence. We thus expect that exposure to
violence—particularly violence that is severe or targets innocent victims—will increase support
for harsh punishments (Prediction 2). This increase in support for harsh punishments can also be
expressed as an increase in support for punitiveness as a general principle of criminal justice policy,
at the expense of the competing principles of legality or procedural justice, and at the expense of
effectiveness in reducing violence. We also expect this type of violence to be associated with higher
support for extrajudicial punishments (Prediction 3). While anger could lead citizens to support
vigilantes because they are an ends to the means of harsh punishments, this final hypothesis predicts
that conditional on the harshness of the punishment, anger may cause citizens to develop a separate
preference for punishments that are meted out by vigilantes.
Finally, we test whether the link between exposure to violence and our outcomes of interest—
i.e., emotions, support for harsh punishments, and support for extrajudicial punishments—is
conditional on the presence of the Mexican security forces. Although Mexico’s security forces
are often seen as insufficient and ineffective in fighting crime (Olson, Shirk and Selee, 2010),
there is substantial variation in the extent to which state security forces are present across the10
country. If harsh and extrajudicial punishments were part of a strategic reaction to violence, then
we would expect to see a stronger relationship between exposure to violence and support for
harsh, extrajudicial punishments in communities with lower state security capacity (Prediction
4A). However, if support for harsh punishments was instead driven by a taste for punishment at
the expense of long-term security and the rule of law, then we would expect to see this reaction
regardless of the state’s capacity to punish and deter crime (Prediction 4B).89
Violence and Vigilantism in Mexico
Mexico’s Drug War
Drug-related violence is the largest security threat in Mexico, affecting numerous parts of the
country for more than 10 years. Based on official data from the National Institute of Statistics and
Geography (INEGI), over 250,000 Mexicans have been killed since December 2006, when former
Mexican president Felipe Calderón began a ‘war’ against organized crime by sending the army into
the state of Michoacán. Mexico’s president at the time of this study, Enrique Peña Nieto, adopted
a similar strategy towards combatting drug trafficking organizations. The army and the federal
police were deployed throughout the territory to capture or kill criminal bosses.
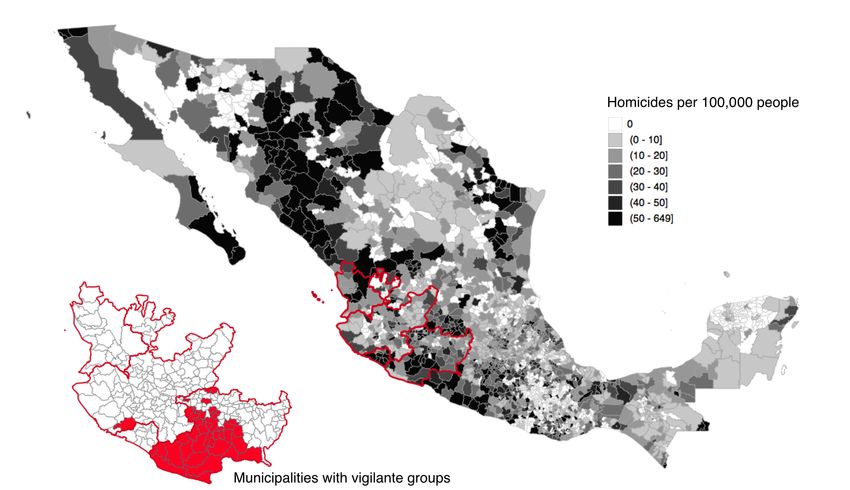
Figure 1 shows the geographic distribution of homicide rates at the municipality level for 2017,
one of the most violent years in Mexico over the past three decades, based on data from INEGI.
While much of the violence is concentrated in the northern part of the country along drug-trafficking
8 Prediction 4 was not preregistered. We also preregistered two hypotheses about individual characteristics that would
moderate participants’ reactions to the crime scenarios. We write these results up in a separate analysis of individual
differences and reactions to violent crime.
9 Ideally, we would also test whether support for harsh and extrajudicial punishments is stronger in places where
the state is more corrupt, as both the will and the capacity of the state to punish should affect citizens’ strategic choices
about punishments. It is not possible to implement this test in an unbiased way using our data for reasons discussed
below. Nevertheless, even if there is also variation in the will to implement justice and security, variation in state security
capacity should still moderate support for harsh punishments to the extent that there are capacity constraints and support
for harsh punishments is a strategic response to state weakness.11
routes, there is substantial spatial variation across the country, particularly in the western region
where drug production is concentrated (Dube, García-Ponce and Thom, 2016). The state borders in
red demarcate Western Mexico, which includes the states of Nayarit, Jalisco, Colima, and Michoacán.
These states exhibit varying levels of violence, but all of them have experienced significant increases
in their murder rates over the past decade.
Scholars and policymakers have pointed to institutionalized corruption and an ineffective
judicial system as key drivers of the violence.10 Other factors that have led to heightened violence
over the past decade include the fragmentation of the drug cartels, the diversification of organized
crime from drug trafficking into other criminal activities like extortion, human trafficking, and
fuel theft, and a fierce battle for controlling lucrative coast ports such as Manzanillo in Colima and
Lázaro Cárdenas in Michoacán.11
Figure 1: Homicide rates at the municipality Level, 2017
10 See http://harvardkennedyschoolreview.com/justice-in-mexico-the-mexican-drug-wars-most-important-change-that-nob
11 See https://www.wilsoncenter.org/article/whats-behind-rising-violence-colima-brief-look-2016s-most-violent-mexic12
Vigilantism and Support for Extrajudicial Violence
In early 2013, groups of civilians in the state of Michoacán formed self-defense militias, or vigilante
groups called autodefensas, to fight organized crime, with the initial goal of kicking out an exception-
ally violent drug cartel known as Los Templarios. Violence and extortion are longstanding problems
in Michoacán, particularly in the region known as the “Hot Land” (tierra caliente). One leader of the
autodefensas explained that Los Templarios had crossed a line when they started to kidnap women
and children in groups in order to rape them. Others have argued that they formed the militias
when Los Templarios started exerting direct control over agricultural production, taking over farms
illegally, displacing owners and exploiting workers.12
The emergence of self-defense militias is not a new phenomenon in Mexico, but the autode-
fensas were different in notable ways from other self-defense groups. Many of the autodefensas
clashed with both drug cartels and state security forces in their attempt to maintain territorial
control, and were accused of carrying out lynchings and human rights abuses.13 As shown in
the smaller map in Figure 1, vigilante groups have operated in recent years in more than than
one-third of all municipalities in Michoacán. Based on public opinion polls conducted shortly after
the creation of the autodefensas, a majority of Mexican citizens supported the creation of such
groups and perceived them as more effective than the state security forces.14
Although the autodefensas were mainly made up of local farmers and business owners, it is
suspected that their ranks were infiltrated by drug cartels members.15 On May 2014, after federal
authorities arrested one of the autodefensas leaders, the government offered to incorporate the
autodefensas into official public security forces, which resulted in the newly formed rural police
12 See https://www.washingtonpost.com/news/monkey-cage/wp/2014/05/20/how-does-a-drug-cartel-become-a-lime-cartel/
?utm_term=.049f2190dc34
13 See https://news.vice.com/article/mexican-authorities-say-they-dont-exist-vigilantes-standing-up-to-the-zetas
14 See http://www.animalpolitico.com/2014/07/7-de-cada-10-mexicanos-apoyan-a-los-grupos-de-autodefensas/
15 See https://www.businessinsider.com/autodefensas-causing-violence-in-guerrero-and-michoacan-in-mexico-2016-1213
forces. While some studies suggest that the autodefensas have improved the provision of local order
in Mexico (Osorio, Schubiger and Weintraub, 2016), Michoacán’s violence levels as measured by
homicide rates did not decrease as a result of the emergence of vigilante groups. In fact, the murder
rate has increased sharply over the past two years.16 More recently, the western state of Colima has
experienced a large uptick of violence based on jockeying of rival cartels, with a homicide rate of
113 per 100,000, a four-fold increase from 2015.
Sampling Strategy
Our target population for this study was adult residents of the four states that make up Western
Mexico. Respondents were randomly selected using a stratified multistage cluster sampling design,
using electoral precincts as our primary sampling units (PSUs). Our sampling strategy takes into
account variation in the presence of autodefensas, violence severity, and urbanization. The presence
of autodefensas is coded at the municipality level using data collected from Mexico’s National
Human Rights Commission and Phillips (2017); strata on violence severity were constructed using
the number of homicides per 100,000 people that took place in municipalities of Western Mexico
during 2016,17 based on data from INEGI; and electoral precincts are coded as either urban or
rural as defined by Mexico’s National Electoral Institute. Half of our sample is from Michoacán
because of its high exposure to vigilantes, with the rest selected proportional to population from
Colima, Jalisco, and Nayarit. 18 After stratifying based on these characteristics, we sampled PSUs
proportional to the size of their populations.
We generated five random samples so that surveyors could replace PSUs if necessary. Six out
of 120 (5%) PSUs from the first sample had to be replaced.They were replaced with five PSUs from
16 See http://www.businessinsider.com/mexico-sinaloa-jalisco-cartel-fighting-violence-in-colima-2017-1
17 We construct three levels of violence by splitting the distribution of homicides per 100,000 people into terciles.
18 Because the vast majority of localities outside of Michoácan do not have known vigilante group presence, we only
stratified on vigilante group presence in Michoácan.14
the second sample.19 Within each PSU, surveyors used maps and a random number generator
to select blocks or clusters of households proportional to their size. Within each block or cluster,
they sampled households by starting at the northeast corner, walking clockwise, and skipping
households in regular intervals of three. Once a household was selected, the surveyors selected a
respondent from eligible adult household members by creating a household roster of a randomly
selected gender20 and then using a random number generator programmed into their questionnaire.
If the respondent was not available or declined, we made one replacement within the household
and then replaced the household with its nearest neighbor. The interview was administered using
tablets with a questionnaire programmed in Open Data Kit.
This strategy produced a sample with considerable variation in terms of exposure to violence
and criminal justice preferences. Half of the respondents in our sample are in Michoácan, 40% are
in Jalisco, 6% are in Nayarit, and 4% in Colima. Full demographic summary statistics are presented
in Appendix Table A.1.
Study 1: Is Victimization Correlated with Support for Harsh, Vigilante
Policies?
In the first study we test whether exposure to violence is correlated with punitiveness and anger.
This provides an observational test of whether exposure to violence is related to stronger preferences
for harsh and vigilante punishment including more punitiveness and more anger. If we find the
expected positive relationships between exposure to violence, punitiveness, and anger, then this
would suggest a mechanism for how violence corrodes support for the rule of law.
19 36 respondents were also surveyed in PSUs that were not in any of the samples, mostly in two Guadalajara PSUs.
These respondents have been dropped for all the analyses in this article, but interpretation of the results does not change
if they are included.
20 We sampled men with a 60% probability in order to produce a sample with better gender balance because men were
more likely to be unavailable to participate in the survey.15
Our main measure of exposure to violence, the key independent variable in Study 1, is a
standardized additive index of five different types of violence (abduction, extortion, paying for
protection, being threatened with a weapon, and assault). Because we assessed that it was unethical
to ask respondents to directly report on personal experiences with severe violence, we proxy for
personal exposure with an indirect measure. Specifically, we asked respondents to estimate how
likely it is that someone in their community has experienced different types of violence in the past
30 days. We selected five forms of violence based on past applications of the Harvard Trauma
Questionnaire with Mexican respondents and crime statistics for the four states included in our
study (O’Connor, Vizcaino and Benavides, 2015). To validate these measures as proxies for personal
exposure, we also measure a subset of less sensitive types of violence directly by asking people
if they have ever personally experienced them. As Appendix C shows, the direct questions are
strongly predictive of responses to the indirect questions, even after including fixed effects for the
119 PSUs. This validation suggests that respondents are drawing on their personal experiences to
answer the indirect questions about violence, and that these measures can be used as proxies for
personal exposure.
Our measures of violence, however, are not strongly related to municipal-level data on homi-
cide rates. The correlation between our violence index and the homicide rate at the municipality
level in the month prior to the survey implementation is 0.14. One explanation for this pattern is
that our survey questions and homicide data are simply picking up different types of violence that
affect different populations. Many of the homicide victims are affiliates of drug trafficking organiza-
tions rather than civilians.21 This explanation is also supported by the fact that our measures of
witnessing the display of violence among drug cartels (e.g., personally seeing a narco banner or a
21 According to the NGO Semáforo Delictivo, approximately 75% of intentional homicides that were commit-
ted in Mexico in 2017 were organized crime executions. See https://www.huffingtonpost.com.mx/2018/01/24/
75-de-los-asesinatos-en-mexico-en-2017-fueron-ejecuciones-del-crimen-organizado_a_23342429/.16
narco blockade) are more strongly correlated with homicides than our measures of lower intensity
violence that targets civilians, such as extortion, paying for protection, or being threatened with a
weapon. Appendix C presents a longer discussion of the data.
There is considerable variation in exposure to violence in our sample, both within and across
states. In Figure 2 we plot the distribution of the estimated likelihood that someone in the respon-
dent’s community has experienced each type of violence in the past thirty days.
Figure 2: Estimated incidence of severe violence by state
Very
●
●
●
Somewhat ● ●
●
● ●
● ●
Likelihood
● ● ● ●
● ●
● ●
● ●
●
● ● ● ●
●● ● ●
● ● ● ● ● ● ● ●
● ● ●● ● ●
● ●● ●
● ●
● ● ●
● ●● ● ● ●
● ●
● ●
●● ●● ●
● ● ● ● ●● ● ● ● ●
● ● ● ●
● ●●● ●● ●
●
● ●
●● ●
● ● ● ● ● ●
A little bit ●● ●●
● ●● ●●
● ● ●● ● ●●●
●● ● ●●
●
●
●●●● ●●
● ●● ● ●●
● ●●
●● ● ●
● ●●●●●● ● ● ●●●
● ●●
●
● ● ● ●
●● ●● ● ● ● ●
●
●●●● ● ● ●● ● ●
●● ●● ● ● ●● ● ●● ● ● ●
● ●
● ●● ●● ● ● ●● ●●● ● ●● ● ●● ● ●●● ●
● ● ●● ● ●● ● ●● ● ●●● ● ● ● ● ● ●● ●
● ●●
● ● ● ● ● ●
● ●● ● ●
● ● ●●● ●● ●●
● ●● ●
●● ● ● ●●
● ● ● ●
● ● ● ● ● ● ● ●● ● ● ● ●
●●● ● ●
●●
● ●● ●●● ● ●●●● ●●● ● ● ●● ● ● ● ●● ●●●●●●
● ● ● ●●
● ●●● ●● ● ●
●● ● ● ●●
●●●●
● ●● ● ●
● ● ● ● ●●● ●
●●● ●● ●● ●●● ●●
● ●
● ● ●● ● ● ●
●●
●●● ● ●
●
● ● ● ● ●● ●● ●● ● ●
● ● ●●● ●
● ●●●● ●●●
●
● ● ●● ●
● ● ●●
● ●● ● ● ● ● ●
● ● ●● ●● ● ● ●● ●● ●● ● ● ● ●●●● ● ●
●● ●●
●
● ●● ●●● ● ●
● ● ●●
●
●●
●● ●● ● ●
●●
●●
● ●●● ● ● ● ●
●
Not at all ● ● ●● ●●● ●●●●
●● ● ● ●●
●●●● ●● ●●●●●
n
lt
on
n
n
u
io
tio
po
sa
rti
ct
ec
ea
to
du
As
ot
W
Ex
Ab
Pr
Violence
State ●
Colima ●
Jalisco ●
Michoacan ●
Nayarit
Our data suggests that extortion is the most common type of violence that people experience.
The extremely high incidence of extortion is also supported by our direct measure of exposure to
this type of violence: 14% of our respondents say that they have personally experienced extortion
in the context of the drug war or drug trafficking. The high prevalence of extortion is also in line
with other data sources, including the 2016 National Crime Victimization Survey (ENVIPE) and
other recent academic surveys (Magaloni et al., 2017).22
22 See http://www.inegi.org.mx/saladeprensa/boletines/2016/especiales/especiales2016_09_04.pdf.17
We examine the correlation between our index of exposure to violence based on these five
measures and respondents’ preferences on five different policy questions.The five policy questions
measure the extent of support or opposition to 1) non-governmental armed groups, 2) the autode-
fensas, 3) lynching a criminal rather than releasing him on a technicality, 4) reinstating the death
penalty, and 5) a proposal to pay narcotraffickers to stop participating in violence.Figure 3 presents
the distribution of responses to each of these five policy proposals.
Figure 3: Support for pro-vigilante and harsh criminal justice policy
Support Death Penalty Oppose Paying Narcos
0.6
0.4
0.2
0.0
Support Non−Govt Armed Groups Support Autodefensas
0.6
Proportion
0.4
0.2
0.0
Prefer Lynching to Release on Technicality
e
ee
e
er
e
re
re
re
th
r
ag
ag
Ag
Ag
ei
N
is
is
0.6
y
D
D
gl
n
y
gl
ro
n
St
0.4
ro
St
0.2
0.0
ee
ee
er
ee
ee
th
r
r
r
r
ag
ag
Ag
Ag
ei
N
is
is
y
D
D
l
ng
l y
ro
ng
St
ro
St
Response
We find strong support for punitive, state-implemented criminal justice policies. 36% of
respondents support bringing back the death penalty. A large majority (86%) of respondents are
opposed to a policy that would financially reward narcotraffickers for abstaining from violence. We
find similar levels of support for vigilante solutions to drug violence. Across the two questions that18
ask directly about support for non-governmental armed groups or autodefensas, a sizable minority
of respondents say that they support or strongly support these groups (34-37%). 28% would prefer
that a criminal be lynched than released legally on a technicality.
Finally, in some specifications, we test whether the relationship between exposure to violence
and our attitudinal outcomes of interest depends on the presence of state security forces. We have
two measures of state security force presence. Our preferred measure is based on administrative
data and measures the distance from a municipality to the nearest police station or military base.23
As a secondary measure, we also look at an individual survey measure of whether the respondent
believes that state security forces (police or army) would have been active in a municipality like
theirs in the last year.
We now test whether people who are exposed to more narcotrafficking violence are more
likely to prefer harsh or extrajudicial criminal justice policies.24 Our main analysis, presented in
Columns 1-3 of Table 1, is based on a mean effects index built from the five distinct survey questions
presented above. In Columns 4 and 5, we also include the interaction of exposure to violence and
a municipality- or individual-level measure of the presence of state security forces. Finally, in
Columns 6 and 7 we replace our preferred measure of violence exposure with two alternatives: the
municipality-level homicide rate during the month prior to our survey25 and our direct measure of
personal exposure to extortion. The full text of all the measures is included in Appendix B.1.
We estimate the relationship with exposure to violence using OLS. We estimate a specification
without any control variables, with individual-level controls, and with PSU fixed effects. The
individual controls include gender, education, an assets index, age, marital status, and employment
23 To be precise, we use data from the Mexican Attorney General?s Office (PGR) and the Mexican Army (SEDENA) to
generate a measure of distance to the nearest state security station, defined as either a federal police headquarter, military
garrison, or airforce base.
24 These specifications were not preregistered, although the hypotheses tested here were.
25 Specifically, we use the log of the annualized rate of homicides per 100,000 people plus 1, based on administrative
data from the Secretariado Ejecutivo del Sistema Nacional de Seguridad Pública (SESNSP).19
of the household head. We selected these demographic characteristics because they are both likely
to explain variation in exposure to violence, and because they are the kind of slow-changing
demographic characteristics that are unlikely to introduce post-treatment bias (Montgomery, Nyhan
and Torres, 2016). We cluster standard errors by locality because violence exposure is likely
correlated across residents at the local level.26
Table 1: Exposure to violence is associated with higher support for punitive and pro-vigilante
criminal justice policy preferences
Dependent variable:
Policy Attitudes Index
(1) (2) (3) (4) (5) (6) (7)
Violence Index 0.07∗∗∗ 0.06∗∗∗ 0.05∗∗ 0.06∗∗∗ 0.05∗∗
(0.02) (0.02) (0.02) (0.02) (0.02)
Homicide Rate 0.01
(0.01)
Extortion - Direct 0.21∗∗∗
(0.04)
Female −0.03 −0.03 −0.03 −0.03 −0.03 −0.03
(0.03) (0.03) (0.03) (0.03) (0.03) (0.03)
Education 0.01 0.003 0.01 0.01 0.01 0.003
(0.01) (0.01) (0.01) (0.01) (0.01) (0.01)
Assets Index 0.03∗ 0.02 0.03∗ 0.02 0.03∗ 0.01
(0.02) (0.02) (0.02) (0.02) (0.02) (0.02)
Age −0.003∗∗∗ −0.01∗∗∗ −0.003∗∗∗ −0.01∗∗∗ −0.004∗∗∗ −0.01∗∗∗
(0.001) (0.001) (0.001) (0.001) (0.001) (0.001)
Married 0.01 0.03 0.01 0.02 0.01 0.03
(0.04) (0.03) (0.04) (0.03) (0.04) (0.03)
Employed −0.01 −0.03 −0.01 −0.03 −0.02 −0.03
(0.03) (0.03) (0.03) (0.03) (0.03) (0.03)
Proximity to Security Base −0.03∗
(0.01)
Prox. to Security Base 0.01
× Violence Index (0.02)
Presence of State Security 0.003
(0.02)
Presence of State Security −0.005
× Violence Index (0.02)
PSU FEs X X X
Constant 0.03 0.14∗ 0.07 0.14∗ 0.07 0.12 0.10
(0.03) (0.07) (0.07) (0.08) (0.08) (0.08) (0.07)
Observations 1,149 1,117 1,117 1,117 1,095 1,133 1,130
R2 0.02 0.04 0.20 0.04 0.20 0.03 0.20
∗ p20
Columns 1-5 of Table 1 shows that past exposure to narcotrafficking violence using our survey-
based measure is strongly and robustly correlated with preferences for harsh and vigilante criminal
justice policy. A one standard deviation increase in the Violence Index is associated with a 0.05 to
0.07 standard deviation increase in the index of preferences for harsh and pro-vigilante criminal
justice policy. These effects are robust to the inclusion of a battery of individual-level controls
and PSU fixed effects and are larger in magnitude than any of the standard demographic controls.
Disaggregated results presented in Appendix D.1 show that these results are driven primarily
by two sub-indicators in the dependent variable: support for the death penalty, and support for
lynching as opposed to releasing criminals on technicalities.
Substantively, the magnitudes of these coefficients on policy preferences are important. People
who are exposed to above-average levels of narcotrafficking violence, for example, are 10 percentage
points more likely to support bringing back the death penalty, an increase of 30% over the low-
violence group. High-violence respondents are also ten percentage points more likely to prefer
that criminals are lynched in the town square rather than released from jail on a technicality, a 37%
increase over the low-violence group.
The relationship between exposure to violence and preferences for harsh and vigilante criminal
justice policy does not depend at all on either of our measures of state security capacity. Columns
4 and 5 show that the interaction between both distance to a police or army base (Column 4) and
the individual-level survey measures of presence of state security forces (Column 5) and exposure
to violence are close to zero and far from statistically significant. This is particularly important,
since one concern might that our finding on the relationship that our exposure to violence variable
was simply proxying state capacity. The fact that both measures of state security capacity and their
interactions with exposure to violence have no systematic relationship with support for harsh and
vigilante punishments show that this is not the case.21
Columns 6 and 7 replace the Violence Index with two measures of violence that are more
objective to assess whether our results might be driven by endogenous subjective perceptions of
violence. Column 6 replaces our measure of violence exposure with the municipality-level homicide
rate in the month prior to our survey. There is no relationship between this homicide rate and the
Policy Attitudes Index. There is, however, a strong and highly statistically significant relationship
between our direct measure of exposure to extortion (one of the five types of violence in the index)
and support for policies that allow for harsh, extrajudicial punishments. On the other hand, Column
7 shows that people who report that they experienced extortion in the past year are .21 standard
deviations higher on the Policy Attitudes Index than those who have not been extorted. These
additional results suggest that the correlations are unlikely to be driven by subjective responses to
our indirect violence exposure questions, and that civilian attitudes may be more sensitive to crimes
that victimize civilians (like extortion) than murders that often target organized crime affiliates. This
heterogeneity based on the type and targeting of violence is tested more systematically in Studies 2
and 3.
Our explanation for the link between exposure to violence and policy preferences is that
violence leads to changes in the psychological states of those affected, which in turn leads to
changes in their policy preferences. We next test whether past exposure to narcotrafficking violence
is associated with higher levels of anger, an emotional reaction that should increase support for
punitive, pro-vigilante justice policies.
Table 2 shows that the emotion reactions of residents in violence affected areas are also in line
with our expectations. Specifically, people who have been exposed to more violence – both on our
indirect measures (Columns 1-5) and the direct measure of extortion (Column 7) – report feeling
anger more frequently than those with less exposure. A one-standard deviation increase in the
Violence Exposure Index is associated with a 0.14-0.17 standard deviation increase in the frequency22
Table 2: Exposure to violence is associated with more anger
Dependent variable:
Anger
(1) (2) (3) (4) (5) (6) (7)
Violence Index 0.14∗∗∗ 0.14∗∗∗ 0.17∗∗∗ 0.14∗∗∗ 0.16∗∗∗
(0.02) (0.02) (0.03) (0.02) (0.03)
Homicide Rate −0.01
(0.02)
Extortion - Direct 0.27∗∗∗
(0.09)
Female 0.05 0.07 0.05 0.08 0.04 0.06
(0.05) (0.06) (0.05) (0.05) (0.05) (0.06)
Education −0.01 −0.01 −0.01 −0.01 −0.003 −0.01
(0.02) (0.02) (0.02) (0.02) (0.02) (0.02)
Assets Index −0.02 −0.01 −0.02 −0.02 −0.01 −0.01
(0.03) (0.03) (0.03) (0.03) (0.03) (0.03)
Age −0.003∗∗ −0.003∗ −0.003∗∗ −0.003∗∗ −0.004∗∗∗ −0.005∗∗
(0.001) (0.002) (0.001) (0.002) (0.001) (0.002)
Married −0.03 −0.04 −0.03 −0.03 −0.03 −0.03
(0.06) (0.07) (0.06) (0.07) (0.06) (0.08)
Employed 0.02 0.04 0.02 0.02 0.03 0.04
(0.06) (0.06) (0.06) (0.06) (0.06) (0.06)
Proximity to Security Base 0.001
(0.01)
Prox. to Security Base 0.02∗
× Violence Index (0.01)
Presence of State Security 0.09∗∗∗
(0.03)
Presence of State Security −0.03
× Violence Index (0.03)
PSU FEs X X X
Constant 0.01 0.16 0.32∗∗ 0.16 0.37∗∗∗ 0.17 0.44∗∗∗
(0.03) (0.11) (0.13) (0.11) (0.13) (0.12) (0.13)
Observations 1,147 1,115 1,115 1,115 1,093 1,132 1,129
R2 0.03 0.04 0.14 0.04 0.15 0.01 0.12
∗ p23
of feeling anger over the past week. As in Table 1, there is no relationship between the number
of homicides and the frequency of anger, and there is a large and significant relationship between
past personal exposure to extortion (asked directly) and anger. Appendix Tables D.6, D.7, and D.8
show that past exposure to violence is also associated with other negative emotions of fear and
sadness. Generally, the relationship between violence and these other emotions is slightly smaller
in magnitude than the relationship with other negative emotions, although not significantly so.
Columns 4 and 5 show that there is some evidence that state security capacity is also associated
with variation in anger. A one standard deviation increase in perceived presence of state security
forces is associated with a 0.09 standard deviation increase in anger, but there is no relationship with
the administrative measure. The relationship between state capacity and negative emotions deserves
future attention. More importantly for the hypotheses that we set out to test, the relationship
between exposure to violence and anger is robust to including these state capacity proxies as
controls, and does not vary across high and low capacity areas.
The ability of the Mexican state to carry out security and justice is arguably hindered more
by problems of will such as corruption than by real capacity constraints. This implies that we
could also test whether the relationship between exposure to violence and our outcomes of interest
is conditional on corruption in state security and justice institutions as a test of whether citizens
preferences are driven by a logic of strategic deterrence. Unfortunately, we are not aware of a
local-level observational proxy for corruption in the courts or security agencies, and our survey
measures of beliefs about state corruption are all likely influenced by citizen experiences with
violence, which would introduce post-treatment bias into our specifications. Nevertheless, to the
extent that the reader believes that attitudes towards the state are not affected by exposure to
violence, tests shown in Appendix D.3 show that the relationship between exposure to violence and
our outcomes of interest is also not dependent on individual trust in or views of the legitimacy of24
the state.
Overall, Study 1 shows that past exposure to violence is positively and consistently correlated
with punitive policy preferences and anger. One of the more important findings in this section
is actually a null effect. If the harsh response to violence were driven by a calculated strategy of
deterrence, then we would expect it to be stronger in places where the state is less present, because
those are places where a strategy of deterrence should be more advantageous. However, the
interaction coefficients in Columns 4 and 5 show that there is no interaction between state capacity
and responses to violence. The interaction of the Violence Index and both the administrative
and survey-based measure of state security capacity are precisely estimated null effects in Table
1. In Table 2 the interaction is significant at the 10% level in Column 4, but is in the opposite
direction of what a strategic deterrence explanation would suggest. Furthermore, the significance
and magnitude of the relationships between violence exposure and policy preferences and anger is
completely unchanged by including either of the measures of state capacity as control variables.
This suggests that the preference for harsh justice after violence is an individual-level phenomenon,
and is unlikely to be driven by a strategic logic of deterrence.
This observational research design does not allow us to rule out the possibility that these
correlations are driven by an omitted variable that jointly explains exposure to violence and
psychological variables and justice attitudes, or reverse causation due to some kind of selection
into violence exposure. In the next sections, we turn to experimental research designs that use
randomly-assigned variation in exposure to hypothetical forms of violence to address some of the
endogeneity concerns and identify the type of violent events that are most likely to set off a cycle of
anger and retribution.25
Study 2: Do Outrageous Crimes Increase Support for Harsh, Vigilante
Policies?
In Study 2 we use an experiment to test whether outrage is driving the relationship between
exposure to violence and preferences for harsh, vigilante criminal justice policy. This eliminates the
possibility that a confounding factor or reverse causation might bias our estimate of the relationship
between violence, anger, and policy preferences. We directly test how individuals respond to
morally outrageous violence, compared to similar scenarios that do not trigger outrage. While the
experimental design comes at the cost of less external validity because we rely on hypothetical
scenarios and respondents’ self-assessments of what they would do and feel in such situations,
the gains in terms of causal identification make Study 2 a strong complement to the observational
methods in Study 1.
We manipulate the level of moral outrage that respondents feel in response to a crime by
violating moral tenets in three different scenarios described during the course of a survey. We
then ask respondents to report how they would react if such a crime occurred, including what
emotions they would feel and how they would evaluate two different potential punishments: one
that is clearly very harsh and extra-judicial (Outcome B), and another that is legal and less severe
(Outcome A). The full text of the crime scenarios and two potential punishments are presented in
Table 3. The sections of the scenarios that are randomized are italicized, and the “moral outrage”
version of the scenario is also bolded.
The three scenarios violate various moral tenets, and in two of the three scenarios the crime
is violent. In all of the scenarios, the victims are presented as innocents, but this is particularly
strong in Scenarios 1 and 2 where the victims in the outrageous versions are children. In Scenario 3,
the crime evokes the idea of “extra-lethal” violence (Fujii, 2013) that is particularly performative26
Table 3: Crime scenarios and punishment options in Study 2
Scenario 1 Scenario 2 Scenario 3
Imagine a situation in which a Imagine a situation in which a Imagine that a narco abducts a
Scenario
narco gang controls the town. corrupt politician is in charge of small business owner because
They control the drug trade, and a large city. He does political fa- he won’t pay them part of his
they also are notorious for abus- vors for his friends and powerful profits. A week later, the busi-
ing and exploiting the local popu- people, and steals money from ness owner’s body is found
lation / children under the age of government contracts / a hospital outside town, and he has been
10. for disabled children. shot to death / beheaded and his
body shows signs of torture.
A: The narco gang members are
arrested and put on trial for their A: The politician is arrested and A: The narco is arrested and
Outcomes
crimes. put on trial for corruption. put on trial.
B: The narco gang members are
B: Local citizens attack the B: The narco is killed by au-
killed by locals in the town
mayor and burn his house down. todefensas.
square.
and brutal. On the other hand, a number of factors are held constant between the moral outrage
and control versions of the scenarios that might influence the perceived effectiveness and justice of
punishment, including the perpetrator’s identity, the likely motivation, and the amount of harm.
All respondents were asked to evaluate all three scenarios in a random order.
In this experiment we have four main outcomes of interest. First, we test whether respondents
say that the scenarios would make them angry. Because the experiment is designed to induce
anger, we consider this a manipulation check. We also measure fear, another emotion that could be
plausibly induced by the moral outrage versions of the scenarios. We consider the experiment to
have passed the manipulation check if participants report that the outrage scenario would make
them feel significant levels of anger and have little effect on fear. Figure 4 plots the coefficients from
an analysis of the effects of the three treatments on how angry and afraid respondents say they
would feel if the hypothetical crime scenario occurred in their community.
In Scenarios 1 and 2, the treatments had large, statistically significant positive effects on
how angry respondents thought they would be if the crime occurred in their community. TheyYou can also read