Annual SACOSS Briefing to the Minister for Energy: Energy Pricing Issues Affecting South Australian Consumers
←
→
Page content transcription
If your browser does not render page correctly, please read the page content below

Annual SACOSS Briefing to the Minister for Energy:
Energy Pricing Issues Affecting South Australian Consumers

                                                 June 2021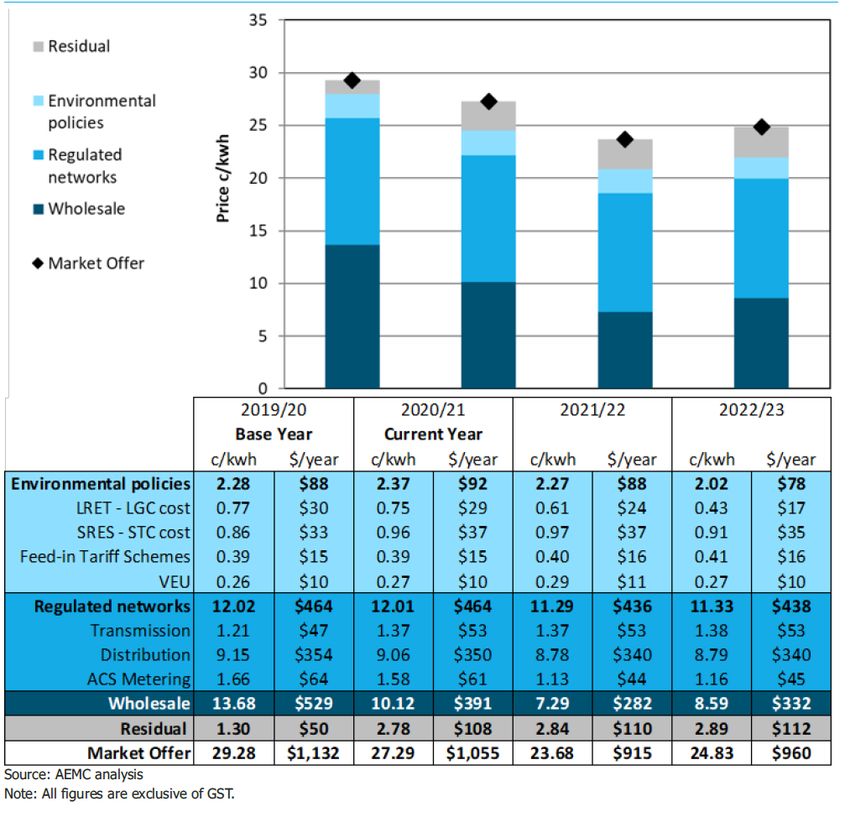
Annual SACOSS Briefing to the Minister for Energy: Energy pricing issues affecting South Australian Consumers.
June 2021.

First published in June 2021 by the South Australian Council of Social Service

47 King William Road

Unley, SA, 5061 Australia

Ph (08) 8305 4222

Fax (08) 8272 9500

Email: sacoss@sacoss.org.au

Website: www.sacoss.org.au

© South Australian Council of Social Service, 2021

This publication is copyright. Apart from fair dealing for the purpose of private study, research, criticism or review, as
permitted under the Copyright Act, no part may be reproduced by any process without written permission. Enquiries
should be addressed to the Communications Coordinator, South Australian Council of Social Service.

                                                                                                                             2
Background
As per the funding agreement with the Minister for Energy and Mining (“Minister”) for SA
Energy Consumer Advocacy Capacity, SACOSS is required to provide an annual briefing to
the Minister about energy pricing issues that affect South Australian consumers. The
briefing is to include provision of an ongoing comparison between South Australia and
Victoria as a benchmarking tool. This paper fulfils this annual briefing output.

The following briefing focuses on tariffs in SA, in particular the introduction of time of use
tariffs and energy debt for households, which increased for South Australian households
throughout 2020.

Wholesale and retail electricity prices
Wholesale electricity prices across the National Electricity Market (NEM) have reduced by 21
to 68 percent since early 2020. The largest reductions in prices occurred in Victoria and NSW
with average reductions of approximately $51 per megawatt hour (MWh) (AEMO, 2021,
p.3). AEMO notes that the main drivers of reduced wholesale prices include reductions in
price volatility, lower prices from renewable energy, hydro and coal generation as well as
low operational demand over the first quarter of 2021. There was some price volatility in SA,
following trips at the Torrens Island Power station; however, overall SA average quarterly
price on the wholesale market was $41 MWh. Negative prices also occur frequently in SA
and Victoria during times of peak solar production (10am – 3.30pm), leading to prices at
negative $12 MWh (AEMO, 2021, p.3). Despite low wholesale electricity prices, the retail
market is taking some time to see any significant savings for households.

The retail electricity market in SA consists of approximately 35 different retailers; however,
the majority of people in SA are customers with AGL who have a market share of almost 38
percent of customers in the state in Q2 of 2020/2021. Origin has the second highest share
of customers in the state at 27.3 percent and Simply Energy have over 10 percent of
customers in the state. Other retailers include Energy Australia (6.8%), Alinta Energy (5%)
and Lumo Energy (5.2%). The remainder of customers in the state are with various other
retailers with approximately 6 percent of the market share in SA (AER, 2021).

Prices on the retail electricity market have reduced and are projected to continue to
decrease by 10.8 percent in SA out to 2023. The majority of decreases as noted is due to
reduced wholesale electricity prices. Network costs and environmental scheme costs also
reduced by a smaller margin; 0.6 and 0.8 percent respectively (AEMC, 2021, p.20-21). Figure
1 below from the Australian Energy Market Commission (AEMC) shows current price trends
as well as projected price trends for SA across all components of consumer bills (i.e.,
wholesale, network and environmental policies).

                                                                                                 3
Figure 1 – Trends in SA electricity pricing. (Source: AEMC, 2021)
For Victoria, prices on the retail electricity market have also reduced and are projected to
continue to decrease by 15.2 percent out to 2023. The majority of decreases in Victoria are
also correlated with wholesale electricity reductions of 17.4 percent. Network costs in
Victoria will reduce by 2.4 percent, and environmental scheme costs are projected to reduce
0.9 percent (AEMC, 2021, p.13-14). Figure 2 below shows current and projected price trends
for Victoria.
4Figure 2 – Trends in Victoria electricity pricing. (Source: AEMC, 2021)
As figure 1 and 2 above show, there is a significant difference in market offer tariffs in SA
and Victoria. In 2019/20, Victoria had market offer tariffs of 29.28c/kWh. South Australia in
the same period had market offer tariffs of 37.68c/kWh. In 2020/21 tariffs in Victoria
reduced to 27.29c/kWh, whereas SA had market offer tariffs of 34.84c/kWh.
Time of use tariffs
The following section will discuss the introduction of time of use (TOU) tariffs by South
Australian Power Networks (SAPN) from 1 July 2020 in an attempt to shift energy use to the
period of day between 10am to 3pm, when most solar is generated on the grid.
SAPN will progress the reassignment of all type 4 (smart meters) in SA from 1 July 2021 to
31 December 2021. By January 2022, all customers with a smart meter in SA will have been
reassigned to the TOU tariff. There are approximately 170,000 customers or 22 percent of
customers in SA that will be reassigned within this six-month period. Of the 22 percent of
customers in SA with a smart meter, there are approximately 12 percent of customers with
solar PV (SAPN, 2021). From discussions with SAPN, electricity retailers and the Department
for Energy and Mining, retailers will pass the cost of TOU tariffs on to customers, with no
ability to opt out or choose another tariff. SACOSS has expressed significant concern about
5this move, due to the potential for some customers being unable to switch their electricity
use to the non-peak period from 10am to 3pm, and instead being subjected to higher tariffs
after 3pm, when most people use electricity.
Literature on the topic of TOU tariffs, consistently shows that people on low incomes, the
elderly, families with children, minorities, and people with disabilities are most likely to be
unresponsive to TOU and are therefore most likely to be impacted with higher electricity
costs (White and Sintov, 2019; Burns and Mountain, 2021). White and Sintov (2019) found
that the elderly and people with disabilities are most likely to experience the greatest cost
increases due to being home bound and having more reliance on energy for medical
equipment and temperature control, and thus less ability to shift their time of use. Higher
electricity costs can also lead to physical and mental health impacts, illness and mortality in
cold and hot weather (White and Sintov, 2019). The research undertaken by White and
Sintov (2019), also recommend the importance of having the ability to opt out of time of use
tariffs, particularly for vulnerable groups to ensure that they are not exposed to higher
prices.
SACOSS conducted surveys on time of use tariffs in SA to understand people’s awareness of
and ability to shift their energy use. The results show that the majority of people use most
of their electricity in the period between 3pm to 1am on weekdays and weekends (Table 1).
However, 42 percent of respondents also stated they use most of their electricity between
10am to 3pm on weekdays, with 60 percent of people stating they use most of their
electricity at this time on weekends. It should be noted that of the 436 responses,
approximately 55 percent indicated they use electricity throughout the day, from 10am
onwards. Demographically, Leslie et al (2021, p.16) observe that households with elderly
residents, larger households and overseas born have higher than average daily energy use
across all hours of the day.
Table 1. Household electricity time of use
Typical Typical
weekday weekend
6am – 10am 27% 23%
10am – 3pm 42% 60%
3pm – 1am 76% 77%
1am – 6am 8% 11%
Column n 436 436
Total sample; Unweighted; base n = 436
*Note: survey respondents were able to choose more than one time. Approximately 55 percent of
respondents indicated they use electricity throughout the day
The survey asked respondents to indicate how confident they (and their household) felt
about shifting their energy use to different times of the day (i.e., 10am – 3pm) or early
morning (1.30am – 6am) if they were able to save money on their electricity bills. The
results also indicated that only 31 percent of respondents felt “very confident” in being able
to shift their electricity use to different times of the day. The survey results found that 28
percent of people are “not very confident” in being able to shift their electricity use, with
the majority of this percentage being older and sole person households (Refer to figure 3).
6Figure 3. Confidence to shift time of use of electricity
Meetings with Origin Energy and other retailers indicate that they are passing the cost of
time of use tariffs from SAPN to customers and this will be mandatory from 1 July, with no
option to revert to a flat tariff or opt out. With a significant proportion of customers in SA
with Origin Energy, tariffs from Origin under time of use are higher with peak tariffs charged
at approximately 39.26c kWh (inclusive of GST) and the solar sponge at 20.55c kWh (Table
2). Tariffs from AGL under time of use are similar (Refer to Table 3), with peak tariffs with
AGL being marginally less at 38.74c kWh.
Table 2. Origin Energy residential tariffs under time of use (June, 2021)
Tariff Structure TOU – Peak, off-peak & shoulder
Tariff (incl GST) 39.26c kWh peak (incl GST) (6am – 10am &
3pm – 1am)
24.76c kWh off-peak (incl GST) (1am – 6am)
20.55c kWh solar sponge (10am – 3pm)
[shoulder] (incl GST)
Connection fee $50.25
Daily Supply 73.71c per day (incl GST)
Charge (incl GST)
Source: Energy Made Easy
Table 3. AGL residential tariffs under time of use (June, 2021)
Tariff Structure TOU – Peak, off-peak & shoulder
Tariff (incl GST) 38.74c kWh peak (incl GST) (6am – 10am &
3pm – 1am)
726.73c kWh off-peak (incl GST) (1am – 6am)
21.25c kWh solar sponge (10am – 3pm)
[shoulder] (incl GST)
Connection fee $50.25
Daily Supply 76.92c per day (incl GST)
Charge (incl GST)
Source: Energy Made Easy
Customers in SA with a smart meter and on a standing offer from Origin, will pay
significantly more for electricity. The solar sponge or “shoulder” tariff from 10am to 3pm
will be 23.32c kWh (inclusive of GST), which is barely a saving from normal flat rate tariffs.
Not only is the “shoulder” period a minimal saving, customers will then be charged 46.60c
kWh for peak usage from 6am to 10am and 3pm to 1am.
Table 4. Origin Energy residential tariffs – standing and market (Feb, 2021)
Tariff Structure TOU – Peak, off-peak & shoulder
Tariff (incl GST) 46.60c kWh peak (incl GST) (6am – 10am &
3pm – 1am)
25.13c kWh off-peak (incl GST) (1am – 6am)
23.32c kWh solar sponge (10am – 3pm)
[shoulder] (incl GST)
Daily Supply 85.70 per day (incl GST)
Charge (incl GST)
Source: Origin Energy
Energy Locals provides much better rates for people on time of use tariffs (Refer to Table 5).
However, customers with Energy Locals are also charged a monthly membership fee of $13
per month. As can be seen in table 5 below, the solar sponge rates between 10am and 3pm
for households with Energy Locals is 17c kWh, with a peak tariff of 31c kWh. This is a
significant improvement on AGL and Origin Energy figures, therefore people who are
mandatorily placed onto time of use tariffs are likely to be better off with Energy Locals than
any other retailer. Energy Locals however have a small market share in SA of 0.7 percent in
Q2 2020/21 (AER, 2021).
Table 5. Energy Locals residential time of use tariff (June, 2021)
Tariff Structure TOU – Peak, off-peak & shoulder
Tariff (incl GST) 31c kWh peak (incl GST) (6am – 10am &
3pm – 1am)
17c kWh off-peak (incl GST) (1am – 6am)
17 c kWh solar sponge (10am – 3pm)
[shoulder] (incl GST)
New connection $50.25
fee
Annual $103.92
membership fee
Daily Supply 62c/day (incl GST)
Charge (incl GST)
Source: Energy Made Easy
8An important conclusion to take from the survey results and the literature is the difficulty
and inequalities inherent in trying to change the behaviour of households, rather than
incentivising when solar energy is exported into the grid, to better align with peak demand
that occurs mostly in the afternoon and evening. Mandating time of use tariffs for all
households with a smart meter in SA as discussed here is not an optimum solution to
resolve the issue of increasing solar on the grid between 10am and 3pm and peak demand
in the afternoon.
There is evidence that many households do not, or cannot respond to the price signals and
will continue to use electricity in peak periods, thus increasing electricity costs for these
households, particularly the elderly, families with children and people with disabilities. It is
preferable to include an opt out option for households that will be moved onto time of use
tariffs from 1 July 2021. There is some evidence that having an opt out mechanism for time
of use tariffs results in a small reduction of 3.9 percent in peak demand (Conway and
Prentice, 2020, p.302). SACOSS does not recommend mandating time of use tariffs for all
households that have a smart meter in the state. It is imperative that households have
choice in their retail tariffs, so they can best manage their electricity costs. The burden of
shifting demand should not be placed upon people who are least able to respond and are
likely to carry the additional costs of doing so.
Energy Debt in South Australia
The average amount of energy debt for residential customers in SA (who are not part of a
hardship program) has increased from $991 in December 2019 to $1,266 in December 2020.
This is an increase in average debt of $275 or 27 percent in 12 months. This is the highest
average amount of energy debt in jurisdictions reporting to the Australian Energy Regulator
(AER), with average national debt at $1,008. NSW has the next highest with the average
residential energy debt being $1,017 as at December 2020.
Despite the increase of 27 percent in average debt for South Australian customers not on
hardship programs in the last 12 months; there has been no increase in formal hardship
supports offered to customers. Concerningly, In SA there has actually been a decrease in
hardship customer numbers from the same time last year (down from 17,222 customers
(2.2%) in December 2019 to 14,253 (1.8%) in December 2020. There has also been a
decrease in the number of customers on payment plans in SA during the last year, down
from 13,220 to 13,055. This is likely due to retailers deferring debt, which has increased by
27 percent over the last year as discussed. Retailers should instead offer payment plans or
hardship supports to customers who are experiencing increasing energy debt. The AER’s
Statement of Expectations1 placed a moratorium on retailers disconnecting customers in
payment difficulty; however, this was not a moratorium on retailers offering supports to
customers in payment difficulty.
1
Australian Energy Regulator (2021) Statement of Expectations of energy businesses: Protecting
customers and the market during COVID-19. https://www.aer.gov.au/publications/corporate-
documents/aer-statement-of-expectations-of-energy-businesses-protecting-customers-and-the-
energy-market-during-covid-19
9The average energy debt for hardship customers in SA has increased from $1784 in
December 2019, to $2,249 in December 2020. This is an increase in average debt levels of
$465 or 26 percent in 12 months. This is the highest average debt for hardship customers
nationally, with the next closest being ACT, reporting average hardship customer debt of
$1,694.
Despite hardship numbers decreasing in the last 12 months in SA, we still had the highest
number of hardship customers in mainland Australia between October and December 2020:
14,253 or 1.8 percent of customers, while Tasmania has 2.32 percent of customers on
hardship programs. The National average is 1.04 percent.
Disconnections in SA
SA had the highest percentage of residential customers disconnected in the National Energy
Customer Framework (NECF) jurisdictions (ACT, NSW, QLD, Tas, SA) between October and
December 2020. Nearly three times more customers were disconnected between October
and December in 2020, than were disconnected in July to September 2020. A total of 841
(0.11%) of SA residential customers were disconnected in Q2 2020-21, up from 292 (0.04%)
in Q1 2020-21. This is despite the ongoing protections against disconnection contained in
the AER’s Statement of Expectations. NSW was next highest with a percentage of 0.07
percent of residential customers disconnected (or 2153 customers).
A total of 59 percent of residential customers disconnected in SA between October and
December 2020 had an energy debt under $1500. The average annual electricity bill in
South Australia is about $1,4442, so most customers are being disconnected for being
unable to pay one average annual energy bill. Disconnection of residential customers should
always be a last resort option for retailers after they have offered payment plans and
hardship supports.
Many customers struggling to pay their energy bills don’t know their retailer is obliged to
help them with payments plans and other supports before they can be disconnected.
Advising customers to contact their retailer and ask for help before they suffer the impacts
of disconnection, can work to move customers from the credit collection arm of the retailer,
to the payment supports arm. Disconnection should always be a last resort, and struggling
households should be given every opportunity to contact their retailer for help before
suffering the impacts of disconnection. SACOSS is calling for pre-disconnection site visits to
be introduced as a ‘business as usual’ practice in SA. This is especially important given the
roll out of smart meters which can be disconnected remotely.
SA Power Networks has undertaken a very successful trial of this practice – reducing
disconnections by 56 percent and Essential Energy in NSW now has a ‘knock before you
disconnect’ program for all its customers, reporting reductions in disconnections of around
80 percent.
2
Canstar Blue (2021) What is the average electricity bill?
https://www.canstarblue.com.au/electricity/average-electricity-bills/
10The AER’s fourth and final Statement of Expectations for energy businesses (updated in April
this year), prohibits retailers from disconnecting residential customers who are in contact
with their retailer. Given the ever-increasing levels of energy debt and rising numbers of
disconnections, SACOSS is expecting that debt collection activity and disconnections will
both rapidly increase once the AER’s Statement of Expectations no longer applies to
retailers from 30 June 2021.
The AER has advised its future focus will be on enforcing compliance with the regulatory
framework, and has identified the “effective identification of consumers in financial
difficulty and offer of payment plans having regard to the consumer’s capacity to pay” as
the number one compliance and enforcement priority area for 2021-22. SACOSS is very
supportive of this focus, and will be monitoring retailer’s behaviour over the coming
financial year. SACOSS would like to see evidence that retailers are offering payment
support in the form of payment plans and hardship supports; helping customer manage
their energy debts through sustainable payment arrangements, assisting customers to make
sure they are on the best plan, providing advice on energy usage, ensuring customers have
access to concessions and Centrepay, and protecting customers struggling to pay from the
invidious impacts of disconnection.
Credit collection
Nationally, in Q2 2020-21, 36,080 customers were referred to an external credit collection
agency for debt recovery, with 52 percent of those customers having a debt less than $500.
Most of those customers (83%) had a debt under $1500 (about the amount of annual
average bill). In SA, 4,154 customers were referred to an external credit collection agency
between October and December 2020, with 44 percent of those having debt of less than
$500. Again, most of those customers (77%) had debt under $1,500 (around the amount of
annual average bill).
Given lower hardship numbers and lower payment plan numbers, SACOSS is concerned that
retailers are referring debt to external credit collection agencies, without first offering those
customers support to pay their bills (in the form of a payment plan or hardship supports).
11References
Australian Energy Market Commission (2021) Residential Electricity Price Trends 2020.
https://www.aemc.gov.au/sites/default/files/2020-
12/2020%20Residential%20Electricity%20Price%20Trends%20report%20-%2015122020.pdf
Australian Energy Market Operator (2021) Quarterly Energy Dynamics Q1 2021.
https://aemo.com.au/-/media/files/major-publications/qed/2021/q1-
report.pdf?la=en&hash=6EBB0A2B39B0205CEF782695505A87E9
Australian Energy Regulator (2021) Retail energy market performance update for Quarter 2,
2020-21. https://www.aer.gov.au/retail-markets/performance-reporting/retail-energy-
market-performance-update-for-quarter-2-2020-21. Released on 6 April 2021
Burns, K., Mountain, B. (2021) Do households respond to Time-of-Use tariffs? Evidence from
Australia. Energy Economics, 95. https://doi.org/10.1016/j.eneco.2020.105070
Conway, L., Prentice, D. (2020) How much do households respond to electricity prices?
Evidence from Australia and Abroad. Economic Papers, Vol 39, no.3. Pp. 290-311.
https://onlinelibrary.wiley.com/doi/abs/10.1111/1759-3441.12284
Leslie, G., Pourkhanali, A., Roger, G. (2021) Can real time pricing be progressive? Identifying
cross-subsidies under fixed-rate electricity tariffs. SSRN:
http://dx.doi.org/10.2139/ssrn.3774556
South Australian Power Networks (2021) Residential tariffs presentation to the Essential
Services Group. February, 2021.
White, L.V., Sintov, N.D. (2019) Health and financial impacts of demand-side response
measures differ across sociodemographic groups. Nature Energy 5, 50–60.
https://doi.org/10.1038/s41560-019-0507-y
12You can also read