APA submission - Towards 2050: Gas Infrastructure in a zero emissions economy Interim Report
←
→
Page content transcription
If your browser does not render page correctly, please read the page content below
Australian Pipeline Limited ACN 091 344 704
                 Level 25, 580 George Street, Sydney NSW 2000
                         PO Box R41, Royal Exchange NSW 1225
                        P: +61 2 9693 0000 | F: +61 2 9693 0093
                                       APA Group | apa.com.au

APA submission – Towards
2050: Gas Infrastructure in a
zero emissions economy
Interim Report
16 August 2021

                                                                  1
Australian Pipeline Limited ACN 091 344 704
                                          Level 25, 580 George Street, Sydney NSW 2000
                                                  PO Box R41, Royal Exchange NSW 1225
                                                 P: +61 2 9693 0000 | F: +61 2 9693 0093
                                                                APA Group | apa.com.au

1   Executive Summary

     Key points

     •   APA supports the transition to net zero emissions. We recently announced our
         own ambition of net zero operations emissions by 2050.

     •   As recent experience in South Australia and Victoria has shown, gas
         infrastructure plays a critical role in helping maintain system security and will help
         unlock low-cost renewable generation capacity.

     •   Continuing to utilise gas infrastructure to support Victoria’s decarbonisation can
         reduce emissions at a lower cost to Victorian consumers than electrifying the
         services provided by gas. The significant cost of electrification appears to be
         understated in the scenarios presented in the Interim Report.

     •   In its advice to Government, it is important that Infrastructure Victoria adopts a
         technology neutral approach and allows for all possible infrastructure scenarios
         to eventuate. This will ensure that the transition to a lower carbon future occurs
         at least cost. As Infrastructure Victoria’s engineering consultant pointed out,
         there may be other scenarios that deliver improved affordability and reliability
         outcomes whilst achieving net zero emissions.

     •   Decarbonisation of the Victorian economy should be considered as a whole,
         rather than on an industry-by-industry basis. Overseas jurisdictions with similar
         energy profiles to Victoria, such as the UK and the Netherlands, are prioritising
         the retirement of the more carbon intensive coal generation.

    APA is a leading Australian Securities Exchange (ASX) listed energy infrastructure
    business. Consistent with our purpose to strengthen communities through responsible
    energy, our diverse portfolio of energy infrastructure delivers energy to customers in
    every state and territory on mainland Australia.

    Our 15,000 kilometres of natural gas pipelines connect sources of supply and markets
    across mainland Australia. We operate and maintain networks connecting 1.4 million
    Australian homes and businesses to the benefits of natural gas. And we own or have
    interests in gas storage facilities, gas-fired power stations.

                                                                                              3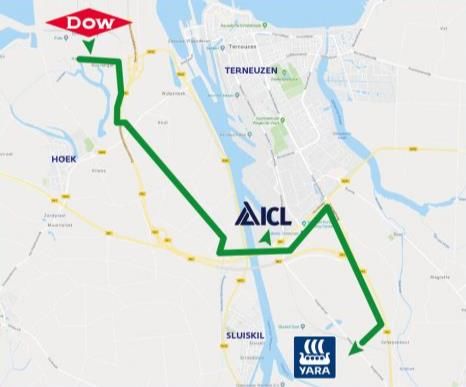
Australian Pipeline Limited ACN 091 344 704
                                      Level 25, 580 George Street, Sydney NSW 2000
                                              PO Box R41, Royal Exchange NSW 1225
                                             P: +61 2 9693 0000 | F: +61 2 9693 0093
                                                            APA Group | apa.com.au

Our investments also include    Figure 1
over     $750   million   in
renewable      generation,
while our high voltage
electricity    transmission
connects Victoria with
South Australia and New
South       Wales       with
Queensland.

APA is supporting the
transition to a lower carbon
future. Our ambition is to
achieve         net      zero
operations emissions by
2050. Through our Pathfinder Program, we are investigating how hydrogen and other
technologies such as batteries and microgrids, can support a lower carbon future.

In the Interim Report, Infrastructure Victoria considered that the opportunity to
repurpose existing gas infrastructure over the long term (beyond 2040) is limited. An
increasing number of projects around the world, however, are demonstrating the
potential for re-use of gas infrastructure to transport renewable gases. For example,
the Gasunie hydrogen pipeline in the Netherlands has been transporting hydrogen
along a modified natural gas pipeline since 2018. On 30 June 2021, Gasunie
announced a significant expansion of the Dutch hydrogen transmission network. The
new Dutch national hydrogen network will consist of 85% reused natural gas pipelines,
resulting in costs four times lower than if entirely new pipelines were laid.

Gas infrastructure has an essential role to play in helping Australia meet its net zero
ambitions targets. As the penetration of variable renewable energy sources, such as
wind and solar, increase, and aging coal power stations retire, Gas Powered
Generation (GPG) will play a critical role in meeting electricity demand and
maintaining the security of the system.

Electricity generation accounts for approximately 45% of Victoria’s overall net
emissions, with 96% of electricity generation emissions coming from three brown coal
power stations. Not only does GPG’s flexibility make it a perfect complement to
variable renewable energy, it also has the advantage of emitting approximately half
the carbon emissions of brown coal.

This advantage has been recognised in many international jurisdictions that have
historically relied heavily on gas and coal. For example, as Infrastructure Australia’s
international comparisons points out, the United Kingdom and the Netherlands have
both achieved significant emissions reductions by retiring coal in the first instance, with
gas supporting the economy during that transition.

                                                                                         4
Australian Pipeline Limited ACN 091 344 704
                                     Level 25, 580 George Street, Sydney NSW 2000
                                             PO Box R41, Royal Exchange NSW 1225
                                            P: +61 2 9693 0000 | F: +61 2 9693 0093
                                                           APA Group | apa.com.au

Determining a pathway to a lower carbon future requires a consideration of many
complex and interrelated issues. To ensure that the transition to a low carbon
economy occurs at least cost, Infrastructure Victoria should adopt a technology
neutral approach in its advice to Government. ‘Picking winners’ or attempting to
choose an optimal infrastructure scenario risks exposing Victorian customers to
inefficient outcomes and higher costs on the long run. As Infrastructure Victoria’s
engineering consultant pointed out, there may be other scenarios that deliver
affordability and reliability improvements over and above the four scenarios
considered.

Our submission to the Interim Report is structured as follows:

   •   PART A contains the key issues we wish to raise, including the importance of
       gas in maintaining energy security and reliability.

   •   PART B contains answers to the questions for consideration in the Interim Report.

                                                                                      5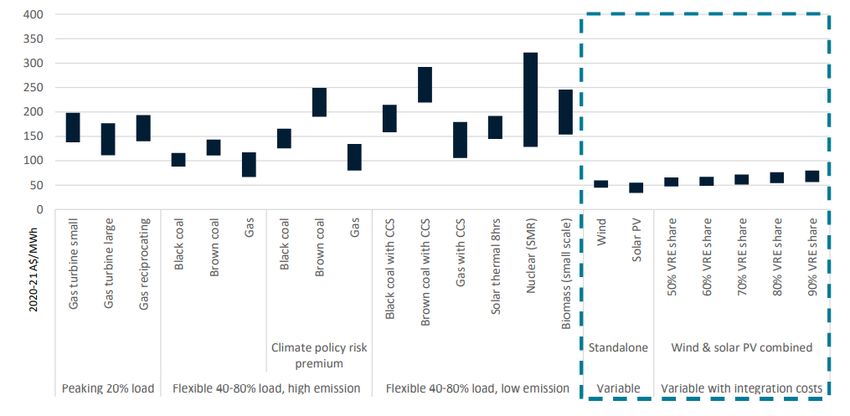
Australian Pipeline Limited ACN 091 344 704
                                              Level 25, 580 George Street, Sydney NSW 2000
                                                      PO Box R41, Royal Exchange NSW 1225
                                                     P: +61 2 9693 0000 | F: +61 2 9693 0093
                                                                    APA Group | apa.com.au

2       PART A – Overview
2.1     Natural gas is essential for energy security
        The National Electricity Market is going through a period of fundamental change, with
        large volumes of VRE displacing aging thermal generation, mostly coal power stations,
        at great speed. This transition is not without its challenges.

        Recent experience has demonstrated the critical role that gas plays in supporting
        renewables and providing a critical backup when large renewable generation such
        as wind and solar is not available.

        The gas network is also a flexible, affordable and safe store of energy, making it ideal
        to help support energy supply during extreme weather or periods of reduced supply.
        The ability to locate GPG close to major demand centres also reduces exposure to
        transmission capacity constraints often experienced by the overconcentration of
        renewable generation in common areas of the grid.

        The build out of renewable generation will require substantial increases in electricity
        transmission and related infrastructure costs with a consequential impact on
        household and industry electricity bills. Gas, on the other hand, can be sited in suitable
        grid locations and will not materially add to such costs.

2.1.1   Gas’s role in complementing VRE
        As recent experience in South Australia has shown, periods of low wind and solar
        availability require significant volumes of dispatchable resources to be available to
        support the reliability and security of the system. Similar issues are likely to be
        experienced in other states, including Victoria, as coal power stations retire.

        For example, in the recent period from 8 July to 12 July 2021, Gas Powered Generation
        (GPG) was critical in keeping the lights on, due to periods of low wind and solar
        generation. On four out of the five days, GPG provided:

           •   over 75% of peak electricity consumption

           •   over 50% of total daily consumption.

        These four days are shown in Figure 2, with the critical role of gas during the 6pm daily
        peak highlighted. These four days are not a unique occurrence. While the days in
        which SA is powered exclusively by VRE are well publicised, the days in which gas
        provides reliable, dispatchable generation do not get so much attention.

                                                                                                6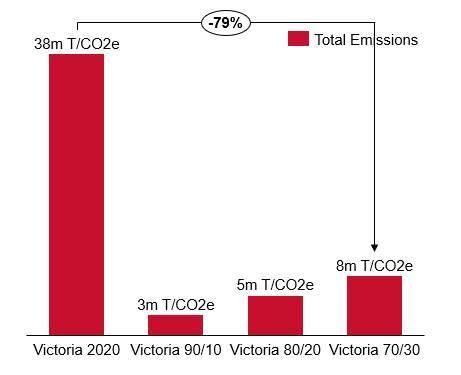
Australian Pipeline Limited ACN 091 344 704
                                         Level 25, 580 George Street, Sydney NSW 2000
                                                 PO Box R41, Royal Exchange NSW 1225
                                                P: +61 2 9693 0000 | F: +61 2 9693 0093
                                                               APA Group | apa.com.au

Figure 2: Case Study 8 to 12 July 2021 in South Australia

The important role played by gas was recognised in a recent speech by the new
AEMO Chief Executive Officer, Daniel Westerman, on 14 July 2021. Mr Westerman
recognised that gas firming is invaluable because it can be called on for short or long
periods. Most importantly, Mr Westerman argued that gas is critical in supporting
greater volumes of VRE:1

          “… dispatchable generation like this unlocks many multiples of low-
          cost renewable generation capacity into the market, by providing
         the security for when the sun isn’t shining, the wind isn’t blowing, and
                          other storage can’t bridge the gap.”

The critical role that gas will continue to play into the future was also recognised by
the Grattan Institute in its recent report Go for net zero: A practical plan for reliable,
affordable low-emissions electricity.2

Grattan correctly identified that the economics of GPG make it ideal for providing
backstop capacity in a system powered mostly by solar and wind. The main reasons
for this include:

    •   in contrast to coal, gas turbines can ramp up and down quickly to balance
        fluctuations in demand;

    •   gas plants are cheaper to build;

1       AEMO, A view from the control room, CEDA keynote address, 14 July 2021
2       Grattan Institute, Go for net zero, April 2021, p30

                                                                                          7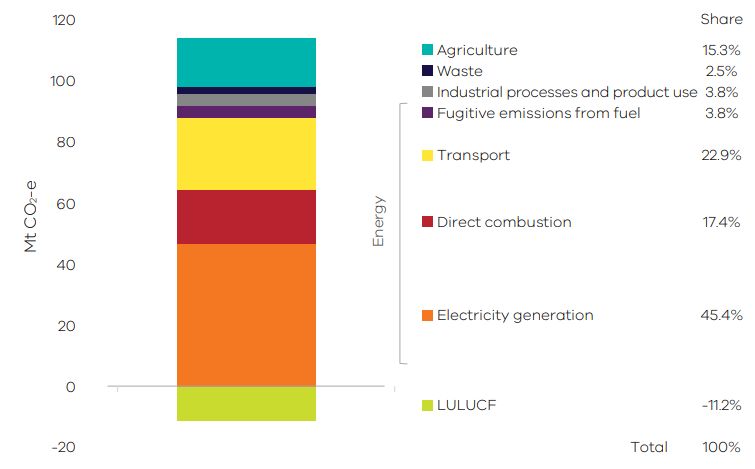
Australian Pipeline Limited ACN 091 344 704
                                                Level 25, 580 George Street, Sydney NSW 2000
                                                        PO Box R41, Royal Exchange NSW 1225
                                                       P: +61 2 9693 0000 | F: +61 2 9693 0093
                                                                      APA Group | apa.com.au

            •   it is easier and cheaper to store gas and liquid fuels than electricity, which
                make them ideal for energy storage in case of a particularly challenging winter
                or summer; and

            •   Australia has substantial infrastructure for moving and storing gas.

        The Victorian Government’s Gas Substitution pathway must recognise the important
        role of GPG in providing Victorian customers with an affordable and reliable electricity
        supply.

2.1.2   Gas’s role in supporting the NEM
        Recent events in Queensland and Victoria have also demonstrated the flexibility and
        security offered by GPG:

            •   On 25 May 2021a failure of one of the generation units at Callide Power Station
                in Queensland caused 477,000 customers to lose power.

            •   In mid-June 2021, Yallourn Power Station in Victoria reduced electricity
                generation to approximately 20% capacity due to the threat of floodwater
                from the Morwell River. This was the second time Yallourn experienced a
                significant flooding event, with the Power Station shutting in 2012 when
                floodwaters entered the adjoining mine.

        Following both these recent events, GPG stepped up to help provide crucial
        electricity generation in both Queensland and Victoria. GPG doubled its output while
        not increasing overall emissions. The ability of gas turbines to quickly ramp up and
        provide long term dispatchable generation shows they will be a critical part of the
        energy system for many years to come.

2.1.3   The gas network is a vital energy store
        Due to their ability to compress and store gas, pipelines are ideally placed to help with
        energy supplies either during extreme weather or in the event of supply failure. In
        many respects they are just like big batteries capable of being turned on in minutes,
        and able to be sustained for days, offering a unique ability to deliver energy security
        when it’s needed most. This was shown to be the case following the supply disruption
        at Longford.

        In mid-July 2021, the Longford gas plant in Victoria suffered a reduction in production
        due to technical problems, significantly reducing the amount of gas being supplied
        to the Victorian market. This led to AEMO issuing a notice of threat to system security.3

        In response to this event, it was the flexibility of APA’s 7,500 kilometres of
        interconnected gas transmission pipelines that form East Coast Gas Grid that enabled

        3       AER, Weekly Gas Market Report, Weekly Summary, 20-26 June

                                                                                                 8
Australian Pipeline Limited ACN 091 344 704
Level 25, 580 George Street, Sydney NSW 2000
PO Box R41, Royal Exchange NSW 1225
P: +61 2 9693 0000 | F: +61 2 9693 0093
APA Group | apa.com.au
us to get gas from the north to the south, helping to rapidly address these shortfalls.
APA utilised its substantial inventory position (known as ‘linepack’) on the Moomba to
Sydney Pipeline (MSP) to support shippers supply through this event. A recent capacity
upgrade of compression prior to this winter ensured flows from the MSP into the
Victorian Transmission System (VTS) via the Victorian Interconnect at Culcairn. Further
additional capacity was available during this event should the market have required
it.
APA’s Dandenong Liquid Natural Gas (LNG) facility also played an important role in
supporting the VTS by injecting LNG at the Dandenong city gate, directly into the
Melbourne metro area. The Dandenong LNG Facility was also available to inject
additional volumes of gas should the market have required it.
Following this rapid response, AEMO subsequently removed the threat to system
security.
2.1.4 The gas network provides energy resilience for customers
Given that gas pipelines are underground, it is a very rare occurrence for network
faults to disrupt customer supply. The fact that gas can be compressed and ‘stored’
in gas pipelines means that even during maintenance activities customers are rarely
disrupted.
Gas transmission pipelines and distribution networks are not subject to formal reliability
standards. One of the key reasons for this is that gas reliability is very good. The last gas
distribution performance report published by the AER, for example, showed that the
average Victorian gas customer had an outage once every 36 years.4 This contrasts
with electricity networks where customers often experience outages due to storms
taking down power lines or outages to conduct maintenance.
The resilience of gas infrastructure and its complementary nature to electricity suggest
that every possible avenue should be pursued to retain its use. Repurposed natural
gas pipelines that deliver renewable gases will provide customers with an efficient
and resilient energy supply for many generations to come.
2.2 Decarbonisation of the economy should be considered as a whole
The Victorian Gas sector contributes 15.8% of Victoria’s total emissions which is around
a third of emissions produced by Victoria’s heavy reliance on brown coal for electricity
generation.5
4 AER, Victorian Gas Distribution Performance Report 2012, p. 13
5 Victorian Government, Gas Substitution Roadmap Consultation Paper, May 2021, p.10
9Australian Pipeline Limited ACN 091 344 704
Level 25, 580 George Street, Sydney NSW 2000
PO Box R41, Royal Exchange NSW 1225
P: +61 2 9693 0000 | F: +61 2 9693 0093
APA Group | apa.com.au
The most recent Victorian Greenhouse Gas Emissions Report, published in 2020,
provides a summary of where all of Victoria’s carbon emissions come from (see
Figure 3).
Electricity generation accounts for approximately 45% of overall net emissions, with
96% of electricity generation emissions coming from the three Victorian brown coal
power stations.6
Figure 3: Victorian Emissions by sector 2018
Source: Victorian Government
One of the key risks associated with focussing attention on just the gas sector is that
policy makers risk ‘picking winners’ or choosing a pathway that may not be the most
optimal way to lower carbon emissions at least cost.
In the Interim Report, Infrastructure Victoria relies heavily on Net Zero Emission Scenario
Analysis Study Report prepared by DORiS Engineering (the DORiS Report) when
presenting infrastructure scenarios to achieve net zero emissions.7 The DORiS Report
conducted analysis of four possible decarbonisation scenarios and considered the
strengths and costs of each. Based on the method adopted, the DORiS Report was
not able to differentiate the three strongest scenarios.8 More importantly, DORiS
Engineering identified an alternative scenario that may deliver a more affordable and
reliable energy scenario:9
6 Victorian Government Greenhouse and Energy Information by Designated Generation Facility,
2019-20
7 DORiS Engineering, Net Zero Emission Scenario Analysis Study Report, May 2021
8 DORiS Engineering, Net Zero Emission Scenario Analysis Study Report, May 2021, p.244
9 DORiS Engineering, Net Zero Emission Scenario Analysis Study Report, May 2021, p.7
10Australian Pipeline Limited ACN 091 344 704
Level 25, 580 George Street, Sydney NSW 2000
PO Box R41, Royal Exchange NSW 1225
P: +61 2 9693 0000 | F: +61 2 9693 0093
APA Group | apa.com.au
“…elements of a potential “hybrid scenario” were
identified that may deliver improvements over the
base scenarios in affordability and reliability of
energy whilst achieving a Net Zero Emissions position
by 2050.”
The DORiS Report demonstrates the difficulty in attempting to predict the future and
forecast the optimal infrastructure scenario for Victoria. Attempting to do so risks
higher costs and inefficient outcomes for customers in the long run.
In our view the decarbonisation of the energy system should be considered as a
whole, rather than on an industry-by-industry basis. An emissions reductions pathway
should take a technology neutral approach and focus on measures that achieve the
maximum carbon reductions at lowest marginal abatement cost.
The existing electricity generation mix in the NEM, and in Victoria in particular, has a
higher carbon profile than emissions associated with the combustion of natural gas.
Brown coal, the primary source of electricity in Victoria, has approximately double the
carbon emissions intensity of energy produced by a combined cycle gas turbine
(CCGT) (see Figure 4).
While it is recognised that the ultimate aim is to reduce all forms of emissions, including
from gas combustion, any short to medium term electrification of gas demand is likely
to increase overall emissions, given the heavy reliance on brown coal to supply
electricity. A rapid uptake of electric vehicles or grid connected batteries could
exacerbate this issue if they are charging from the Victorian grid which is dominated
by brown coal generation. Should either of these situations eventuate, meeting
Victoria’s interim emissions reductions targets would become harder to achieve.
Figure 4: Carbon intensity of natural gas compared to coal
Source: APA analysis of OpenNEM emissions data from 16 May to 21 June 2021
The early retirement of brown coal is the biggest single emissions reduction initiative
that Victoria could undertake and would increase the likelihood of Victoria not just
11Australian Pipeline Limited ACN 091 344 704
Level 25, 580 George Street, Sydney NSW 2000
PO Box R41, Royal Exchange NSW 1225
P: +61 2 9693 0000 | F: +61 2 9693 0093
APA Group | apa.com.au
meeting, but exceeding, its 2025 and 2030 emission reductions targets. This is clearly
demonstrated below:
• Figure 5 shows that a future energy mix of 70% renewables supported by 30%
gas could reduce the emissions intensity of Victoria’s electricity generation by
around 80%, from 0.89 TCO2e/MWh to 0.15 TCO2e/MWh.
• Figure 6 shows that this would result in annual emissions from electricity
generation reducing by approximately 80% in the 70/30 energy mix. Given that
electricity generation accounts for 45% of overall Victorian emissions, this would
result in a large 36% reduction in overall Victorian emissions.
Figure 5: Emissions intensity of Victoria in Figure 6: Annual energy generation
2020 compared with 70/30 scenario emissions in Victoria in 2020 compared
with 70/30 scenario
Source: APA analysis based on 50/50
peak/baseload mix and AEMO data
International jurisdictions have come to similar conclusions when considering options
to meet emissions targets. In its Gas infrastructure: international comparisons prepared
for Infrastructure Victoria, Accenture Strategy looked at several jurisdictions that also
relied heavily on gas and coal and have taken measures to reduce coal consumption
as a logical first step in moving to a low emissions economy:10
• United Kingdom – coal will soon be completely phased out of the UK economy,
with the government recently announcing plans to bring forward the 2025
phase out of coal to October 2024 (see Figure 7). Major upgrades of the
10 Accenture Strategy, Gas infrastructure: international comparisons, April 2021
12Australian Pipeline Limited ACN 091 344 704
Level 25, 580 George Street, Sydney NSW 2000
PO Box R41, Royal Exchange NSW 1225
P: +61 2 9693 0000 | F: +61 2 9693 0093
APA Group | apa.com.au
natural gas network will continue until 2032. This will reduce methane leakage
and provide options to switch to hydrogen in the future.11
Figure 7: Input for UK electricity generation by source
Source: Accenture Strategy
• Netherlands – gas consumption in the Netherlands is similar to Victoria, driven
by historical low gas prices and high local production and the dominant role
of gas in heating. The abundant supply of gas has supported the transition
from coal and the Netherlands is now considering various measures to
decarbonise gas.12
2.3 The cost of electrification must be carefully evaluated
One of the key unknowns when developing the Roadmap is the potential cost of
electrification. Using publicly available sources, it is possible to determine the
magnitude of the task being considered.
In Victoria there is a significant difference between summer and winter energy use, as
shown in Table 1.
11 Accenture Strategy, Gas infrastructure: international comparisons, April 2021, pp31-32.
12 Accenture Strategy, Gas infrastructure: international comparisons, April 2021, pp46-48.
13Australian Pipeline Limited ACN 091 344 704
Level 25, 580 George Street, Sydney NSW 2000
PO Box R41, Royal Exchange NSW 1225
P: +61 2 9693 0000 | F: +61 2 9693 0093
APA Group | apa.com.au
Table 1: 2019 Maximum electricity and gas demand
2019 Winter Summer
Electricity - maximum demand 7.6GW13 8.7GW14
Gas – Hourly peak day demand15 75 TJ/hr 25.4 TJ/h
It is possible to convert hourly gas demand into GW to compare how much energy
the electricity and gas networks are delivering at their summer and winter peaks. This
is achieved by multiplying the number of TJ/h by 0.27778 to determine the number of
GW. For example:
75 TJ/h x 0.27778 = 20.8GW
The resulting electricity and gas winter and summer maximum demand, expressed in
GW, are shown in Table 2.
Table 2: 2019 Maximum electricity and gas demand expressed in GW
2019 Winter Summer
Electricity - Maximum demand 7.6GW 8.7GW
Gas – Forecast hourly peak day demand in 20.8GW 7.1GW
MW
Source: APA analysis of AEMO data
Recognising this is a simplistic comparison, it demonstrates that while the electricity
and gas networks had a comparable peak demand on a summer day in 2019 (i.e.,
8.7GW compared to 7.1GW) on a peak winter day the gas network delivered more
than twice the peak energy demand of the electricity network (20.8GW compared
to 8.7GW).
The fact that the gas network delivers over twice the peak energy demand of the
Victorian electricity network is one of the key hurdles associated with the Roadmap.
Electrification of gas use is one of the proposed decarbonisation pathways identified
by the Interim Report (Scenario A). As the simple analysis above demonstrates,
electrifying Victoria’s winter gas load could require the electricity network to handle
three times its current load. That is, instead of a peak demand of around 10GW, the
13 AER, Seasonal peak demand – regions: https://www.aer.gov.au/wholesale-markets/wholesale-
statistics/seasonal-peak-demand-regions, Winter 2019, accessed 23 July 2021
14 AER, Network performance report 2020, TNSP operational performance data 2006-2019
15 AEMO, VGPR 2021, p.80
14Australian Pipeline Limited ACN 091 344 704
Level 25, 580 George Street, Sydney NSW 2000
PO Box R41, Royal Exchange NSW 1225
P: +61 2 9693 0000 | F: +61 2 9693 0093
APA Group | apa.com.au
electricity network would need to be able to carry a peak demand of around 30GW
(10GW plus the additional 20GW from gas).
APA is studying entry to US energy markets to inform possible decarbonisation
scenarios. ‘Cold-climate’ states in the US exhibit similar characteristics to Victoria, in
that seeking to electrify the winter heating load is cost-prohibitive. Electrification also
concentrates supply interruption risks to the electricity grid, which is subject to winter
storm events.
The Interim Report recognises that any shift towards electricity in place of gas will have
a significant impact on Victoria’s electricity network. Based on a Grattan Report,
Infrastructure Victoria estimates that peak electricity use could increase by an
estimated 40% compared with the current summer peak demand, if household and
small business gas loads were to be electrified.16 Grattan’s analysis does not appear
to be available on its website, but it is difficult to reconcile Grattan’s 40% figure with
the simple analysis above, and the fact that 60.5% of Victorian gas use is for cooking,
space heating and hot water.17 Given its significant influence on the cost of upgrading
the electricity network, the impact of electrification on peak demand must be
investigated as part of the Roadmap development.
Estimating the cost of upgrading the Victorian electricity distribution and transmission
networks to cater for additional peak demand is a very complex exercise. However,
two important points should be highlighted:
• Any electrification pathway needs to consider the parallel electrification of
another key energy source: liquid fuels for transport. The uptake of EVs for
domestic, commercial, and public use is increasing rapidly. In the absence of
price signals to encourage efficient use of the electricity distribution network,
EVs are likely to place extra demands on electricity networks and generation.
• Victorian distribution networks are the most well utilised in the NEM.18 Utilisation
is derived by comparing maximum demand to the total capacity of the
distribution network, at the zone substation level. In 2019, for example,
Powercor, one of Victoria’s electricity distribution businesses, had a network
utilisation of 0.78. This shows that there is not significant ‘headroom’ on the
electricity distribution network for any electrification of gas use.
It is essential that Infrastructure Victoria attempts to estimate the actual cost (as
opposed to the relative cost between scenarios) of upgrading both the electricity
distribution and transmission system for its final advice to the Victorian Government.
16 Infrastructure Victoria, Interim Report, p.19
17 Victorian Government, Gas Substitution Roadmap Consultation Paper, May 2021, p17.
18 AER, Network performance report 2020, Electricity DNSP operational performance data 2006-
2019
15Australian Pipeline Limited ACN 091 344 704
Level 25, 580 George Street, Sydney NSW 2000
PO Box R41, Royal Exchange NSW 1225
P: +61 2 9693 0000 | F: +61 2 9693 0093
APA Group | apa.com.au
The DORiS Report appears to have significantly underestimated the cost of building
new electricity infrastructure. For example, while the report clearly attempts to
quantify the cost of new electricity transmission required to connect new solar and
wind assets, the report appears to be silent on the cost or extent of electricity
distribution investment.19 Delivering renewable electricity from regional Victoria to
urban centres will require significant investment in both transmission and distribution
electricity networks.
The Victorian electricity distribution networks are well utilised and are the largest cost
component in electricity delivery. In 2020-21 for example, the average residential
electricity bill included $53 in transmission costs and $350 in distribution costs.20 It is very
important that the cost of distribution investment is included in Infrastructure Victoria’s
analysis. As experience in other jurisdictions has shown, rapid increases in capital
expenditure can quickly flow through to network charges and therefore customer bills.
2.4 Infrastructure Victoria’s scenarios contain very challenging timeframes
The Interim Report and DORiS Report foreshadow some very challenging timeframes
for establishing new hydrogen and electricity infrastructure, as well as the potential
decommissioning of gas infrastructure:
• Electricity transmission upgrades – the DORiS Report identifies that future
scenarios require between 6,000 and 7,000km of new 220kv transmission lines
by 2030 to connect new renewable generation across Victoria.21 The length of
new transmission increases significantly out to 2050 (see Figure 8).
Figure 8: Electricity powerlines installed under Infrastructure Victoria's scenarios
Source: DORiS Engineering
To put these figures into perspective, the Victorian Transmission Network Service
Provider, AusNet Services, has an existing transmission network of
approximately 6,700km.22 and has taken many decades to plan and build.
19 DORiS Engineering, Net Zero Emission Scenario Analysis Study Report, May 2021, p.52-53
20 AEMC, Residential Electricity Price Trends 2020 Final Report, 21 December, p13
21 DORiS Engineering, Net Zero Emission Scenario Analysis Study Report, May 2021, p.55
22 AER, AusNet Services Transmission Benchmarking RIN response 2019-20
16Australian Pipeline Limited ACN 091 344 704
Level 25, 580 George Street, Sydney NSW 2000
PO Box R41, Royal Exchange NSW 1225
P: +61 2 9693 0000 | F: +61 2 9693 0093
APA Group | apa.com.au
Scenarios A, B and C effectively duplicate the existing Victorian transmission
system by 2030. There are many concerns across the National Electricity Market
at present about the slow timeframes for building new electricity transmission
to connect new renewable generation to the grid. There are also significant
social licence issues associated with building new infrastructure. It is extremely
unlikely that the transmission investment required in scenarios A, B and C can
be provided in the timeframes indicated.
• Potential decommissioning of gas assets – the DORiS Report identifies scenarios
that require 20% of the gas distribution network to have been decommissioned
by 2030.23 For the reasons outlined in this submission, we consider that the
decommissioning of the gas network is not an efficient or optimal option for
reaching net zero. Regardless of the merits of this option, however,
decommissioning 20% of the gas distribution network by 2030 is an unrealistic
milestone, given the myriad of issues that must be solved prior to any
decommissioning and the significant impact that this would have on
households, industry, and the whole Victorian economy.
2.5 Utilising existing assets is a more efficient option
Electrifying Victoria’s gas usage will result in peak electricity demand increasing
substantially and shifting from summer to winter. Not only would electrification of this
shifting load be a very expensive exercise, but it could also take many decades to
undertake the necessary investment. This approach also represents an inefficient
option that is not in customers long term interests:
• The electricity transmission and distribution network investment associated with
electrification will have to be paid for by customers for 365 days of the year, for
many decades to come. This is an inefficient use of resources given that the
heating load is concentrated in a few winter months and much of any new
infrastructure will be idle for most of the year.
• Large quantities of mainly renewable generation would be required to help
meet winter demand. Much of this generation could be excess to requirements
during the summer when peak demand is much lower. Excess renewable
energy entering the system may also lead to other network problems, which
would need to be managed.
Frontier Economics has investigated the potential for gas infrastructure to decarbonise
the economy. In its September 2020 report, Frontier concluded that making continued
use of existing gas assets wherever possible, including for the transport of hydrogen or
23 DORiS Engineering, Net Zero Emission Scenario Analysis Study Report, May 2021, p.110
17Australian Pipeline Limited ACN 091 344 704
Level 25, 580 George Street, Sydney NSW 2000
PO Box R41, Royal Exchange NSW 1225
P: +61 2 9693 0000 | F: +61 2 9693 0093
APA Group | apa.com.au
biomethane, can help avoid the material costs of investing in new assets to deliver
energy.24
The main reason Frontier came to this conclusion was due to the significant cost of the
electrification pathway, particularly for industrial energy load. Frontier also recognised
that gaseous fuels are essential as industrial feedstock, and if gaseous fuels are not
available, the industries that rely on this feedstock will not be viable.
Frontier Economics’ conclusion is not surprising given the cost of delivering energy in
Victoria and the investment made in the electricity and gas networks to date. Using
publicly available AER data, Table 3 outlines the value of the gas and electricity
networks (referred to as the Regulated Asset Base) and the amount customers paid in
network charges in 2019 to transport energy using the respective networks.
The data shows that revenues earned from operating the Victorian gas transmission
and distribution network costs are around a quarter of those to run the electricity
distribution and transmission network. These revenues are paid for by customers
through their electricity and gas bills.
Table 3: Victorian RAB, Revenue and Energy Delivered 2019
Regulated Asset
Actual Revenue ($m)
Base ($m)
Electricity distribution and 17,32925 2,82511
transmission networks
Gas transmission and 5,63126 77414
distribution networks
The efficiency of the interconnected gas system at delivering energy is further
demonstrated by looking at the cost of delivering a unit of energy across the gas and
electricity networks. As Table 4 shows, Victorian gas pipelines deliver:
• a GWh equivalent of energy approximately 6 times cheaper than electricity
networks
• A MW of peak demand load approximately 10 times cheaper than electricity
networks.
24 Frontier Economics, The Benefits of Gas Infrastructure to Decarbonise Australia, September
2020, p.9
25 AER, Electricity DNSP and TNSP network performance report 2020
26 AER, APA VTS, Multinet, AusNet Services, Australian Gas Networks 2019 RIN data
18Australian Pipeline Limited ACN 091 344 704
Level 25, 580 George Street, Sydney NSW 2000
PO Box R41, Royal Exchange NSW 1225
P: +61 2 9693 0000 | F: +61 2 9693 0093
APA Group | apa.com.au
Table 4: Energy delivered and maximum demand
Actual Average Average cost to
Maximum
Energy annual cost to deliver a MW of
demand
Delivered deliver a GWh maximum
(MW)
(GWh) ($) demand ($)
Electricity distribution 41,48011 68,115 8,68427 325,362
and transmission
networks
Gas transmission and 64,72228 11,965 20,83429 37,171
distribution networks
As the numbers in Table 3 and Table 4 show, delivering energy through electricity
networks is significantly more expensive than doing so through gas networks.
Increasing the proportion of energy delivered to customers through the electricity
network risks is likely to increase overall energy costs for customers.
In its annual GenCost report, the CSIRO investigates the cost of various generation
technologies. In its 2021 report, the CSIRO acknowledged that significant investment
is required to incorporate VRE in the energy system, including new transmission to
Renewable Energy Zones, additional transmission to strengthen the grid, and
synchronous condensers to support system reliability.30
Recognising the significant additional costs associated with reaching 100% VRE, the
2021 GenCost report found that in 2030 the cost of gas electricity generation can
match the cost of VRE up to a 70% or greater share of generation (shown in Figure 9
below).31
Continuing to use existing gas infrastructure to support VRE is a more efficient outcome
than full electrification, which is likely to be an expensive proposition and have
unforeseen impacts on customers and businesses.
27 AER, Network performance report 2020, TNSP operational performance data 2006-2019
28 AEMO, VGPR 2020 update, Table 1, 2019 Victorian Consumption of 233PJ converted into GWh
29 AEMO, VGPR 2021, p.80, Peak hourly demand of 75 TJ/hour converted into MW
30 CSIRO, Annual GenCost Report, June 2021, pviii
31 CSIRO, Annual GenCost Report, June 2021, p.ix
19Australian Pipeline Limited ACN 091 344 704
Level 25, 580 George Street, Sydney NSW 2000
PO Box R41, Royal Exchange NSW 1225
P: +61 2 9693 0000 | F: +61 2 9693 0093
APA Group | apa.com.au
Figure 9: CSIRO Levelised Cost of Energy 2030
Source: CSIRO
2.6 Repurposing existing gas infrastructure
Australia has some of the world’s best natural resources, such as wind and sunshine,
for producing renewable energy. This is one of the key reasons why hydrogen has
been identified as one of Australia’s key comparative advantages and one of the
logical options to help decarbonise the Australian economy.32 The May 2021 Victorian
Climate Change Strategy includes a five-point plan to cut emissions and developing
a local renewable hydrogen industry is part of the innovation pathway.33
Complementing our natural advantage in renewable energy is the fact that Australia
has one of the most extensive interconnected gas infrastructure networks in the world,
with an expert workforce supporting it. It therefore makes strong sense for Australia to
explore the opportunities to repurpose this existing infrastructure to support the
transition to a low carbon economy.
In the Interim Report, Infrastructure Victoria considered that the opportunity to
repurpose existing gas infrastructure over the long term (beyond 2040) is limited.34
While it is not clear how Infrastructure Victoria reached this conclusion, it did imply that
part of the rationale is that over half of all Victoria’s onshore pipeline infrastructure is
over 40 years old., It is important to remember that gas pipelines are generally
designed with 50 to 80 year asset lives and many of Victoria’s pipelines have many
32 Australian Government, First Low Emissions Technology Statement – 2020, p17.
33 Victorian Climate Change Strategy, May 2021, p26.
34 Infrastructure Victoria, Interim Report, July 2021, p5
20Australian Pipeline Limited ACN 091 344 704
Level 25, 580 George Street, Sydney NSW 2000
PO Box R41, Royal Exchange NSW 1225
P: +61 2 9693 0000 | F: +61 2 9693 0093
APA Group | apa.com.au
decades left of service. Pipelines can also have their design life extended with modern
integrity measures such as pigging and recoating.
While Australia has only recently begun the journey of decarbonising its gas
infrastructure, other countries around the world, particularly in Europe, are further
ahead. An increasing number of projects around the world are demonstrating the
potential for re-use of gas infrastructure to transport renewable gases.
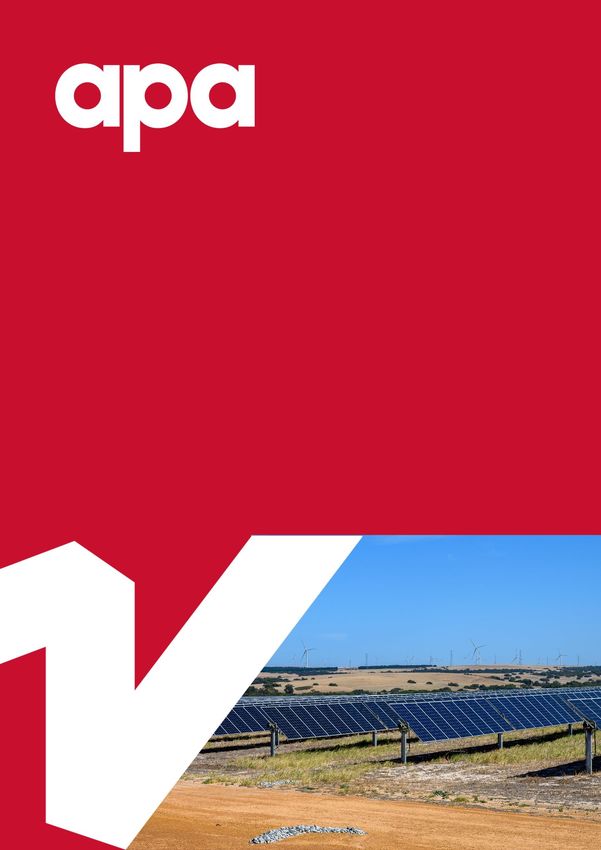
For example, the Gasunie hydrogen pipeline in the Netherlands has been transporting
hydrogen along a modified natural gas pipeline since 2018. In June 2021 Gasunie
announced a significant expansion of the Dutch hydrogen transmission network, with
85% of the new network reusing existing natural gas pipelines (see case study below).
Case study: Gasunie repurposing transmission pipelines in the Netherlands
In November 2018, Gasunie, the Figure 8: Gasunie's hydrogen transmission
Netherlands’ gas transmission pipeline
operator, started transporting
hydrogen along a 12km long
stretch of repurposed natural gas
pipeline. The pipeline will transport
more than 4,000 tons of hydrogen
per year for industrial purposes,
saving over 10,000 tons of carbon
emissions each year.35
On 30 June 2021 the Netherlands
Ministry of Economic Affairs and
Climate Policy announced that it
will commission Gasunie to
develop the national infrastructure
for the transport of hydrogen.36 The
project, with an estimated investment of €1.5 billion, is scheduled for completion in
2027. Most importantly, the new national hydrogen network will consist of 85% reused
natural gas pipelines, resulting in costs four times lower than if entirely new pipelines
were laid.
2.7 APA’s gas substitution pathway
As the International Energy Agency acknowledged in its recent report Net Zero by
2050, the gas sector is very well placed to accelerate the deployment of low emissions
35 https://www.gasunie.nl/en/news/gasunie-hydrogen-pipeline-from-dow-to-yara-brought-into-
operation, accessed 11 August 2021
36 https://www.gasunie.nl/en/news/dutch-german-cooperation-secures-european-future-of-
hydrogen, accessed 11 August 2021
21Australian Pipeline Limited ACN 091 344 704
Level 25, 580 George Street, Sydney NSW 2000
PO Box R41, Royal Exchange NSW 1225
P: +61 2 9693 0000 | F: +61 2 9693 0093
APA Group | apa.com.au
technologies, helping to steer the country’s energy transition towards a net zero
pathway.37
Much of APA’s pipelines gas infrastructure is adjacent to some of the best
geographical areas for hydrogen production in Australia. We are actively leading
efforts to unlock the innovation and new technologies that will lead to the
development of a new hydrogen industry in Australia.
As we look ahead to 2050 and beyond, consistent with the International Energy
Agency’s observations, the gas industry is well placed to diversify and deploy
decades of knowledge, capability and critical infrastructure to play a leading role in
developing the low emissions technologies of tomorrow, at scale, and to support our
own ambitions for a net zero future.
We welcome commitments by Australian Governments to set hydrogen blending
mandates, such as the Western Australian and NSW Government goals to blend 10
per cent hydrogen in gas pipelines by 2030, subject to ongoing assessment of
technical feasibility. These are important steps to enable the commercialisation of
hydrogen technologies and bring forward the work required to solve some of the
regulatory challenges associated with the conversation of gas infrastructure.
2.7.1 Pathfinder Program
Our Pathfinder Program will be a key enabler in our pathway to our new ambition for
net zero operations emissions by 2050. Through Pathfinder, we will help unlock energy
solutions of the future and develop opportunities to extend our core business.
Pathfinder’s initial focus will be on clean molecules, off-grid renewables and storage.
Our first Pathfinder project is seeking to enable the conversion of around 43-kilometres
of the Parmelia Gas Pipeline in Western Australian into Australia's first 100 per cent
hydrogen-ready transmission pipeline and one of only a few existing gas transmission
pipelines in the world, 100 per cent hydrogen-ready.
This project, which is being delivered in partnership with Future Fuels Cooperative
Research Centre and Wollongong University, carries enormous significance for APA
and the entire industry. It will create a significant opportunity for the development of
a hydrogen hub in Western Australia, while the more broadly the results will support
decision-making as to the potential for APA’s other gas infrastructure assets to be
hydrogen-ready.
2.7.2 Renewable methane pilot
APA and ARENA have jointly funded a project by Southern Green Gas to develop a
renewable methane demonstration plant at APA’s Wallumbilla gas plant in
Queensland. This carbon neutral project is investigating whether it is possible to create
37 International Energy Agency, Net Zero by 2050, May 2021
22Australian Pipeline Limited ACN 091 344 704
Level 25, 580 George Street, Sydney NSW 2000
PO Box R41, Royal Exchange NSW 1225
P: +61 2 9693 0000 | F: +61 2 9693 0093
APA Group | apa.com.au
renewable methane from hydrogen that is produced using solar energy and water,
converted to methane using CO2 extracted from the atmosphere.
Renewable methane is indistinguishable from the methane that currently fills our
natural gas pipelines and therefore offers a potential low carbon alternative with the
ability to use the existing gas infrastructure system.
The renewable methane created at Wallumbilla can be injected into the gas
transmission network. The project will also generate cost and technical data to be
used to assess the feasibility of a larger, commercial scale renewable methane
concept.
2.8 Intergenerational and social equity issues
Gas infrastructure owners have invested billions of dollars in long-lived assets to bring
gas into Victoria and deliver it to over two million customers across the state. These
assets are paid for by customers over many decades through network charges in their
gas bills.
The Victorian Government’s Roadmap raises the prospect that some gas use will be
electrified, thereby reducing the amount of gas used by customers. This raises both
intergenerational and social equity issues:
• Intergenerational equity – existing gas networks have been built with a forecast
number of customers in mind. Together, the customer base will pay for the cost
of that investment, with today’s customer base paying for their use of the
network and future customers also paying a share. Any moves to limit the
number of future gas customers will raise intergenerational equity issues as a
smaller number of future customers will continue to pay for a disproportionate
share of the network costs. This may impact low income and vulnerable
households the hardest, particularly if they do not have the financial means to
switch fuels.
• Social equity issues – the energy transition currently underway is allowing
customers to take greater control of their energy use, as long as they can afford
the solar PV, batteries, and home energy management systems that enable
them to do that. If customers are required to electrify their gas use, energy
inequality risks be exacerbated. This is because many customers will not have
the opportunity, whether it be for financial or other reasons, to take control of
their electricity use.
Furthermore, any moves to remove a customer’s choice to connect to the gas
network is essentially mandating electrification and will close off the opportunity to
repurpose the gas network in the years ahead for hydrogen or other renewable gases.
History has shown that once the opportunity to lay gas mains is foregone at the time
23Australian Pipeline Limited ACN 091 344 704
Level 25, 580 George Street, Sydney NSW 2000
PO Box R41, Royal Exchange NSW 1225
P: +61 2 9693 0000 | F: +61 2 9693 0093
APA Group | apa.com.au
of initial development it is highly unlikely to be economically nor socially viable to retro-
fit later.
2.9 Fugitive emissions
The Interim Report claims that fugitive emissions from natural gas may be
underestimated. This claim is based on research into fugitive emissions undertaken in
the US. Methods used to estimate and industry practices to manage fugitive emissions
in the US and Australia are different. APA reports fugitive emissions in accordance with
Australia’s NGER system. This is a robust system for estimating and reporting
greenhouse gas emissions including emissions of methane.
There have been queries by some sources as to the accuracy of emissions methods
in NGER reporting but this has been an area of continual investigation and
improvement by the industry and Australian Government for over 10 years. For
example, in 2017 the Department of Environment and Energy published a reported
titled Update on Recent Empirical Evidence on Fugitive Emissions From the Gas
Industry. Estimation methods used in Australia were updated in light of new evidence
about fugitive emissions..
243 PART B –Responses to questions for consideration
The table below contains guidance on our responses to Infrastructure Victoria’s questions for consideration
Question APA response for each pathway
Do you have any further information, evidence or concerns
• See section 2.2 for risks associated with the scenario
that you wish to raise in relation to the scenario design and
options and methodology.
analysis?
• See section 2.2 for analysis which shows that Victoria can
reduce emissions from electricity generation by 80%
Do you have any further information or evidence that can help
through the early retirement of coal. This would be a
identify an optimum scenario for a net zero emissions gas
logical first step in reducing emissions and has been the
sector in 2050?
approach adopted in other jurisdictions with similar
energy profiles, such as the UK and the Netherlands.
• The first steps in creating a hydrogen industry are to
establish, test and prove clean hydrogen supply chains,
encourage global markets and develop cost-
competitive production capability. Targeted support for
What policies and/or regulations, if any, are needed to support pilot demonstration projects and develop industry
the development of low carbon pathways such as biogas, expertise will help achieve these goals.
green hydrogen, and carbon capture and storage?
• Following that, scaling up the industry will require policies
to build widespread domestic hydrogen demand. The
National Hydrogen Strategy outlines some of these
initiatives, which include:Australian Pipeline Limited ACN 091 344 704
Level 25, 580 George Street, Sydney NSW 2000
PO Box R41, Royal Exchange NSW 1225
P: +61 2 9693 0000 | F: +61 2 9693 0093
APA Group | apa.com.au
o Using clean hydrogen for industrial feedstocks and
heating
o Blending of hydrogen in gas pipelines
o Using hydrogen for long distance transport and
development of refuelling infrastructure.
APA supports continued policy development, that will
help establish domestic and global hydrogen demand.
What is your view on the best ways to maintain the reliability • Repurposing natural gas pipelines will help maintain
and affordability of Victoria's gas supply if natural gas use energy reliability and affordability for customers (see
declines? sections 2.1.4 and 2.6.
• See section 2.3 for information about the costs
What else can you tell us about the implications of associated with electrification.
decarbonisation pathways for the electricity generation,
transmission and distribution networks? • See section 2.4 about the challenging timeframes
associated with electrification.
How can the use of Victoria's existing gas infrastructure be
optimised during the transition to net zero emissions, over the • See section 2.6 for an example of how Governments can
short (10 years), medium (20 years) and long-term (30+ years)? support the repurposing of natural gas pipelines.
How can the Victorian Government assist in this?
What principles should apply or what measures will be needed
to manage the impacts of gas decarbonisation on households • No response
and businesses?
26Australian Pipeline Limited ACN 091 344 704
Level 25, 580 George Street, Sydney NSW 2000
PO Box R41, Royal Exchange NSW 1225
P: +61 2 9693 0000 | F: +61 2 9693 0093
APA Group | apa.com.au
What policies, programs and/or regulations should the
Victorian Government consider or expand to encourage
• No response
households, commercial buildings and small businesses to
reduce their gas use?
• The National Hydrogen Strategy identifies 57 joint
strategic actions to establish a hydrogen industry. Many
What policies, regulations or other support, if any, do you think of these actions will be applicable to other renewable
are needed to support industrial users to switch from natural gases.
gas to lower emissions energy sources or chemical feedstocks? • APA supports the development of a guarantee of origin
for hydrogen, which was one of the actions identified in
the Hydrogen Strategy.
27You can also read