Appendix A.3: Modeling Fine Particulate Matter Emissions from the PBF Martinez Refinery: An Air Quality Health Impact Analysis (Version 2)
←
→
Page content transcription
If your browser does not render page correctly, please read the page content below
Appendix A.3:

Modeling Fine Particulate Matter Emissions from the
PBF Martinez Refinery: An Air Quality Health Impact Analysis
(Version 2)

Version 2 promoted to final from interim draft.
Updates since version 1: Appendix A.3 reordered within Appendix A. Minor changes and corrections
to footnotes in Tables ES1 and 4.1
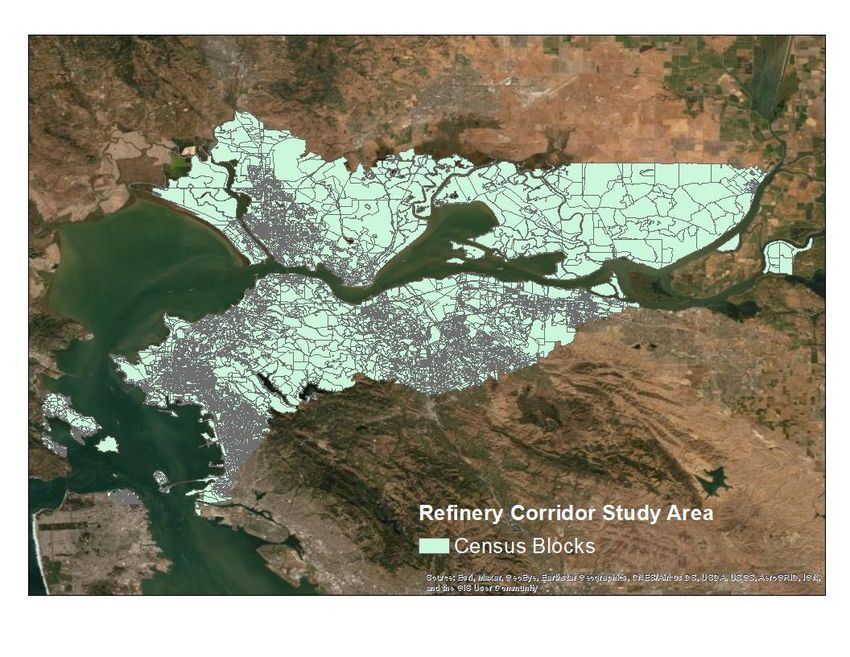
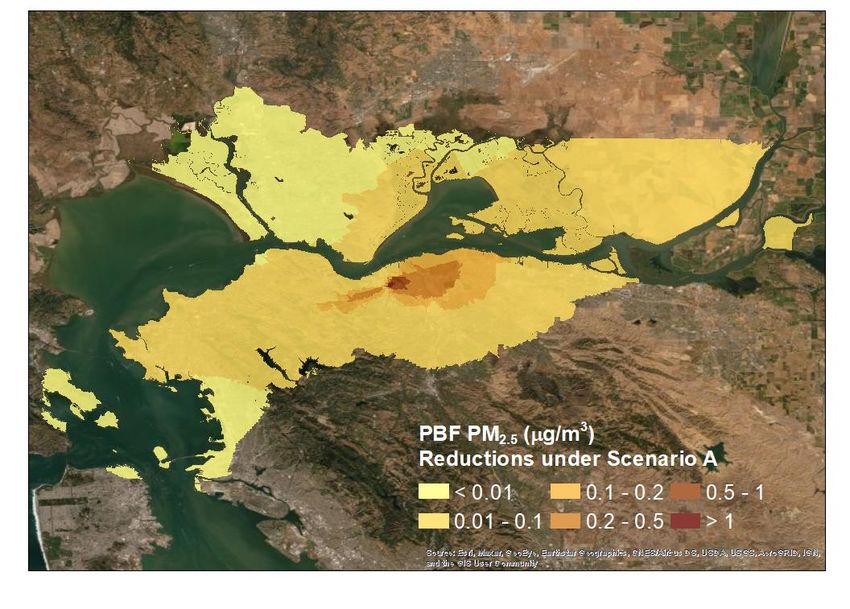
Table of Contents
Executive Summary ...................................................................................................................................... 2
Introduction .................................................................................................................................................. 5
Materials and methods ................................................................................................................................ 6
   2.1         US EPA’s BenMAP–CE computer program .................................................................................. 6
   2.2         Preparation of PM2.5 concentrations ........................................................................................... 7
   2.3         Preparation of population data ................................................................................................. 11
Application of BenMAP–CE ........................................................................................................................ 12
Results......................................................................................................................................................... 14
References .................................................................................................................................................. 17

Executive Summary

The Bay Area Air Quality Management District (District) has conducted modeling analyses to
assess the air quality and health impacts of fine particulate matter (PM2.5) emissions from the
PBF Refinery in Martinez, California. These analyses are part of a larger effort to estimate the
impacts of PM2.5 emissions from major industrial facilities in the Bay Area. This work will
support the District’s rule development efforts and community-scale assessments conducted
under Assembly Bill 617 (AB 617), which established collaborative programs to reduce
disparities in air pollution exposure across California.

The California Puff (CALPUFF) model was used for estimating ambient PM2.5 concentrations
from PBF refinery emissions. CALPUFF was applied at two spatial scales: a 1-km grid covering
the entire Bay Area and a 100-m grid covering a smaller study area. The model was run using a
single set of base-year (2018) emissions estimates. Year-specific meteorological inputs for three
years (2016–2018) were utilized to minimize the impact of year-to-year variations in
meteorology on estimated PM2.5 levels. Average results from the three annual simulations were
used as inputs to the US Environmental Protection Agency’s Benefits Mapping and Analysis
Program – Community Edition (BenMAP–CE), which estimates health impacts associated with
changes in ambient pollutant levels, as well as conventional valuations of those impacts
(expressed in US dollars).

BenMAP–CE was applied for three scenarios at the Census block level across the 100-m grid
that defined the study area. The baseline scenario assessed the impacts of PM2.5 emitted from
all modeled sources at the PBF refinery. Scenarios A and B respectively assessed reductions in
these impacts due to the achievement of PM10 limits under Control Scenario A (0.020 gr/dscf)
and Control Scenario B (0.010 gr/dscf) at the refinery’s fluidized catalytic cracking unit (FCCU).

As modeled, 2.8 to 6.3 premature deaths per year were attributed to baseline PM2.5 emissions
from the PBF refinery. The conventional valuation of all the health impacts included in our
assessment (including, but not limited to, those deaths) was 28.8 to 64.9 million US dollars per
year. The implementation of controls to achieve Control Scenario A and Control Scenario B at
the refinery’s FCCU were estimated to reduce annual excess deaths by 35% and 50%,
respectively, and resulted in benefits valued at 10.1 to 22.7 and 14.4 to 32.4 million dollars per
year, respectively.

The valued benefits represent US EPA’s national average valuation, and were not modified
specifically for the Bay Area. Table ES.1 summarizes the health and monetary impacts of PM2.5
from PBF Martinez refinery emissions along with percent changes due to emissions controls.

                                                                                       Version 2: 2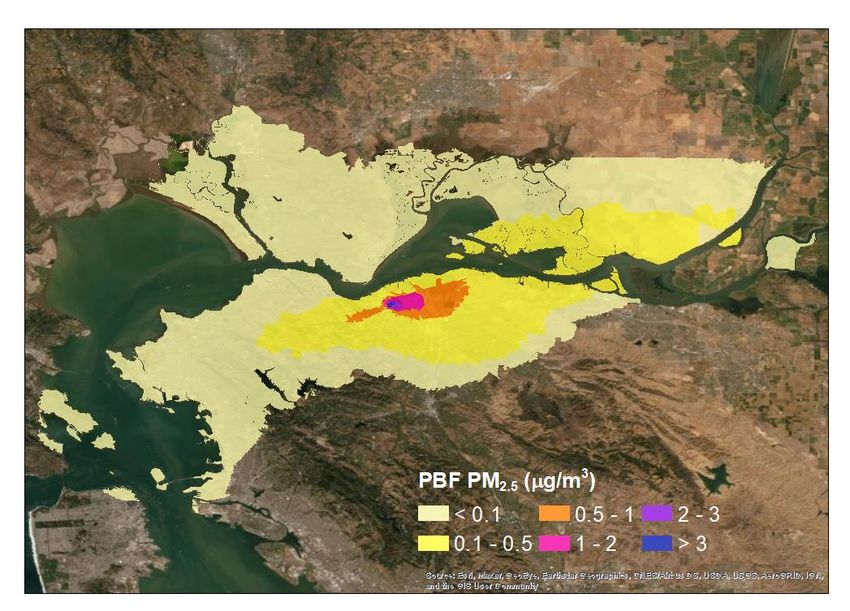
Table ES.1: Summary of health and monetary impacts of PM 2.5 from PBF Martinez refinery
emissions and percent change of valuation for FCCU emissions under Control Scenario A and
Control Scenario B.

                                                                    Reduction       Reduction
            Baseline Health Impact1                 Valuation2
                                                                   under Control   under Control
       of PBF Martinez Refinery (Annual)             (Annual)
                                                                    Scenario A      Scenario B

Cardiovascular          0.3–2.4 heart attacks      $37 k–350 k         -35%            -50%
                       0.6 hospital admissions        $26 k            -35%            -50%

Restricted Activity          2,700 days               $200 k           -35%            -50%

Lost Work                     460 days                $100 k           -35%            -50%

Asthma                   110 exacerbations3            $7 k            -35%            -50%
                                                       $1 k            -35%            -50%
                       2 emergency room visits
                                                       $1 k            -35%            -50%
List of Acronyms
AB 617 Assembly Bill 617
BAAQMD Bay Area Air Quality Management District
BenMAP–CE Benefits Mapping and Analysis Program – Community Edition
CALPUFF California Puff (model)
CDC Center for Disease Control
ESP Electrostatic Precipitator
EPA Environmental Protection Agency
FCCU Fluidized Catalytic Cracking Unit
PM2.5 Particulate Matter 2.5 micrometers or less in diameter
WGS Wet Gas Scrubber
Version 2: 4Modeling Fine Particulate Matter Emissions
From the PBF Martinez Refinery:
An Air Quality Health Impact Analysis
(Version 2)
Introduction
The adoption of Assembly Bill 617 (AB 617) established collaborative programs to reduce
community exposure to air pollutants in neighborhoods most impacted by air pollution. Air
District staff have been working closely with the California Air Resources Board (CARB), other
state agencies, local air districts, community groups, community members, environmental
organizations, regulated industries, and other key stakeholders to reduce harmful air pollutants
in Bay Area communities.
As part of these programs, Air Quality Modeling and Analysis Section staff have been estimating
concentrations of directly emitted fine particulate matter (PM2.5) from major industrial facilities
in the Bay Area. This information is being used to estimate the contributions of emitted PM2.5 to
ambient levels, assess the adverse impacts of those contributions on human health and
welfare, and quantify the benefits of reducing those impacts through emission controls.
Atmospheric PM2.5 is a complex mixture of suspended particles and liquid droplets having
aerodynamic diameters of 2.5 µm or less. These particles are small enough to be inhaled into
the lungs and thereby enter the bloodstream. Numerous studies have reported that PM2.5 is
deleterious to the respiratory and cardiovascular systems. In the lungs, PM2.5 aggravates
asthma, bronchitis, and other respiratory problems, leading to increased hospital admissions. In
the heart and vascular system, PM2.5 is associated with chronic hardening of the arteries
(atherosclerosis) and triggering of heart attacks (acute myocardial infarctions). Decreased life
expectancy, potentially on the order of years, has been documented.
The United States Environmental Protection Agency (US EPA) has developed the Environmental
Benefits Mapping and Analysis Program – Community Edition (BenMAP–CE) to estimate and
quantify conventional valuations of health impacts associated with changes in ambient
pollutant levels (US EPA, 2018). Staff of the Air Quality Modeling and Analysis Section have
been applying this program to estimate adverse impacts of PM2.5 on Bay Area residents
(Tanrikulu, et al., 2011). This program is also being used to assess the impacts of PM2.5 emitted
from major industrial facilities in the Bay Area.
The impacts of PM2.5 from PBF Martinez refinery emissions were analyzed for this report. The
impacts of emissions from Chevron Richmond refinery are documented in Fang et al. (2021).
The impacts of emissions from other major facilities will be reported separately.
Version 2: 5Materials and methods
2.1 US EPA’s BenMAP–CE computer program
In this study, BenMAP–Community Edition (BenMAP–CE), version 1.5, was used
(https://www.epa.gov/benmap). This program was designed to estimate changes in human
health due to changes in ambient air quality for specific populations and to estimate
conventional valuations of these impacts (in US dollars).
The valuation process takes into account both the direct costs of illnesses such as actual
medical costs and lost worker hours and indirect costs reflecting willingness to pay to avoid
pain and suffering as well as premature death. The direct costs alone may substantially
underestimate the total valuation assigned to reductions in these outcomes. For pollutants
capable of causing death, such as PM2.5, the mortality-based component tends to far outweigh
the morbidity-based component. The calculations implemented by BenMAP–CE include
assessing the change in population exposure, using health impact functions to estimate the
incremental change in selected human health outcomes based on the exposure difference, and
evaluating the range of monetary valuations associated with these outcomes.
Epidemiological data are used to develop concentration–response functions, which BenMAP–
CE uses to quantify the linkages between pollutant exposures and adverse health outcomes.
These functions are typically stratified by population subgroups (e.g., age groups) and account
for the effects associated with a specific duration and degree of pollutant exposure. Population
data and pollutant concentration data input to BenMAP–CE must be prepared in a manner
consistent with these concentration–response functions. Epidemiological data linking PM2.5
exposure and mortality are typically stratified by age group (e.g., infants, 18 years of age and
older, etc.) and reflect an annual averaging period.
The BenMAP–CE program overlays population data onto changes in ambient pollutant
concentrations to calculate spatially resolved impacts associated with pollutant exposure.
Pollutant concentration data are taken from air quality model simulations or observations.
The study described in this report was the first of its kind to use high-resolution simulated
pollutant fields to evaluate PM2.5 health impacts over the Bay Area. High-resolution simulations
reproduced the sharp spatial gradients in pollutant concentrations that result in significant
neighborhood-to-neighborhood differences in human exposures.
An alternative approach would be to use air monitoring data. This approach would require
interpolating pollutant levels from a network of monitors to construct levels over unmonitored
neighborhoods. Since air monitoring data include concentrations from emissions of all sources,
this approach is not applicable to our project that assesses health impacts of emissions from a
specific source or proposed or adopted emissions control.
Version 2: 6Applications of BenMAP–CE require the development of two sets of inputs: ambient PM2.5
concentrations and population data. The preparation of these datasets for this study is
discussed below.
2.2 Preparation of PM2.5 concentrations
The California Puff (CALPUFF) model was used for estimating ambient PM2.5 concentrations
from Chevron Richmond refinery emissions (Koo et al., 2021a) and from PBF Martinez refinery
emissions (Koo et al., 2021b). CALPUFF estimates pollutant concentrations at predefined
receptor locations. Two receptor domains were established for the simulations. One covered
the entire Bay Area at 1-km grid resolution, and the other covered a smaller area at 100-m grid
resolution.
Results from the larger domain encompassing emissions from both Chevron Richmond and the
PBF Martinez refineries were used to establish a “study area” approximating a “refinery
corridor.” This study area, consisting of the union of Census blocks for which an average
modeled contribution (from both facilities combined) was determined to meet or exceed 0.1
µg/m3 PM2.5, was used to scope the residential population for which impacts were assessed.
CALPUFF was applied for three years (2016, 2017, and 2018) using year-specific meteorology
and the same base-year (2018) emission estimates that included all inventoried PM2.5 emissions
from the refineries. The average results from the three annual simulations were used for health
impacts analyses to minimize the effects of year-to-year variability in meteorology on ambient
PM2.5 levels. The average concentrations from the baseline simulation of the PBF Martinez
refinery are shown in Figure 2.1.
CALPUFF was also applied for two additional simulations for the same years and the resulting
concentrations were averaged in the same manner as described above: (1) a simulation with
emissions only from the refinery’s fluidized catalytic cracking unit (FCCU) and (2) a simulation
with emissions only from the refinery’s FCCU controlled with an assumed wet gas scrubber
(WGS). Air District staff believes that the more stringent 0.010 gr/dscf standard under Control
Scenario B could only be met with a wet gas scrubber.
Analyses were also conducted for an assumed emissions rate corresponding to the 0.020
gr/dscf standard under Control Scenario A. Air District staff assumes stack release parameters
would remain consistent with the current refinery configuration. For this scenario,
concentrations estimated with the FCCU emissions only was uniformly reduced 55%, and the
resulting concentrations were subtracted from the base simulation. This percent reduction is
consistent with the 0.020 gr/dscf standard. Figure 2.2a shows reductions in PM2.5
concentrations due to the 0.020 gr/dscf standard (scenario A). Figure 2.2b shows reductions in
PM2.5 concentrations due to the 0.010 gr/dscf standard (assuming WGS control) from the PBF
Martinez refinery (scenario B).
Version 2: 7Figure 2.1: Average PM2.5 concentrations from the baseline scenario for the PBF Martinez
refinery.
Version 2: 8Figure 2.2: (a) Reductions in average PM2.5 concentrations due to 0.020 gr/dscf standard (upper
panel, Control Scenario A); (b) reductions in average PM2.5 concentrations due to 0.010 gr/dscf
standard (lower panel, Control Scenario B).
BenMAP–CE requires two sets of ambient concentrations to estimate health impacts. These are
called base and control cases. CALPUFF simulations were designed to estimate: (1) the overall
Version 2: 9health impacts of PM2.5 emitted from the PBF Martinez refinery, and (2) the benefits of
reducing FCCU emissions under Control Scenario A and Control Scenario B. For estimating
overall health impacts, the base case was the three-year average simulated PM2.5
concentrations from all PBF emissions, while the control case was simply an assumed
concentration field with zero PM2.5 (i.e., no emissions from PBF) for comparison; the difference
between these two cases provided a representation of the PM2.5 contribution associated with
total PBF emissions.
For estimating the benefits of reducing FCCU emissions, the base case was the three-year
average simulated PM2.5 concentrations from uncontrolled FCCU emissions, while the control
cases were the PM2.5 concentration field resulting from the Control Scenario A and Control
Scenario B emissions.
BenMAP–CE provides population data from the 2010 Census at both the Census block and
Census tract levels. Block-average PM2.5 contributions were assigned to each Census block in
the study area. Figure 2.3 illustrates the set of such blocks. For details of the calculation of block
averages, see Holstius and Martien, 2021.
Figure 2.3: Map of the study area and all Census blocks included in the BenMAP–CE analysis.
Version 2: 102.3 Preparation of population data
BenMAP–CE requires population data to be grouped in a specific way to apply the available
health impact functions. The developers of BenMAP–CE had already grouped the US Census
Bureau’s population data for this purpose for 2010, a year the most comprehensive census was
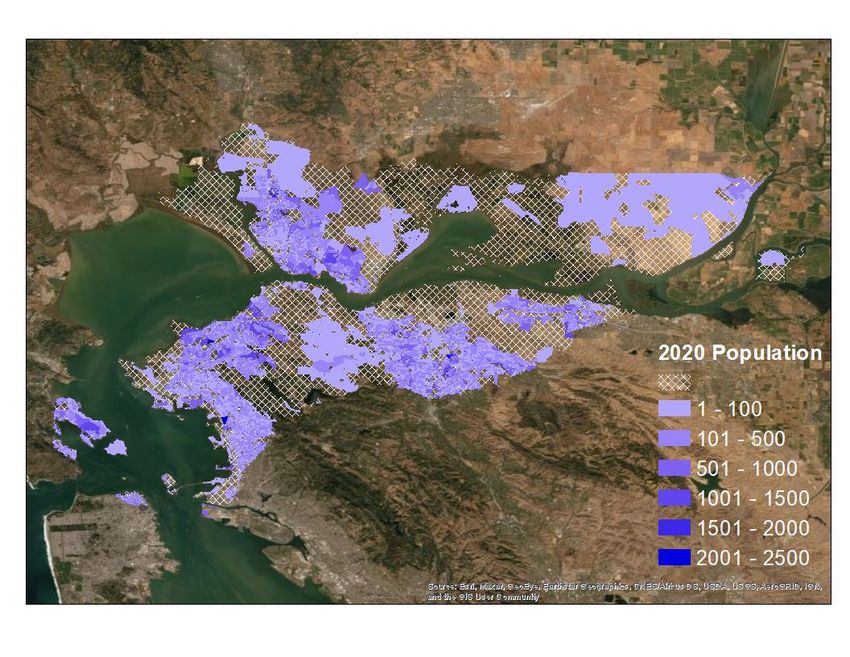
conducted (Table 2.1). We projected the 2010 data to 2020 using an available module in
BenMAP-CE, Figure 2.4.
Figure 2.4: Projected 2020 population obtained by applying PopGrid to 2010 Census data.
As can be seen from Table 2.1, there were a total of 304 population groups for which PM2.5
health impacts could be estimated. They comprised nineteen age, four race, two ethnic, and
male and female groups (details of how these groups were established are provided in
Appendix J of EPA 2018). BenMAP’s racial classification schema is identical to that of the Center
for Disease Control (CDC), from which BenMAP obtains baseline health data. CDC’s schema is
aligned with the US Census 2010 schema, except that multi-racial (“2 or more races,” etc.) as
well as “other race” responses are reclassified into one of these four “single-race” bins based
Version 2: 11on auxiliary data.1 Thus, multiracial and other classifications have not been dropped; they have
been reclassified into one of these four categories.
Table 2.1: BenMAP–CE population groupings.
Age Race Ethnicity Sexitself is a meta-analysis summarizing 53 single studies (including the three other studies that we
included), 17 of which have been published since 2015.
Table 3.2 summarizes the health impact functions used in BenMAP–CE and also provides
information on the health endpoints associated with each study, age range, and baseline health
data used.
Table 3.2: Health endpoint, studies developed health impacts functions and epidemiological
data used.
Health Endpoint Studies Developed Health Study Baseline Health Data
Impacts Functions Population as Named in BenMAP–
CE
Cardiovascular
Peters et al. (2001) 18+ years Other incidence (2014)
Pooled estimate: 18+ years Other incidence (2014)
-Pope et al. (2006)
Nonfatal heart attacks -Sullivan et al. (2005)
-Zanobetti et al. (2009)
-Zanobetti and Schwartz
(2006)
Pooled estimate: 64+ years Other incidence (2014)
-Zanobetti et al. (2009)
Hospital admission, -Peng et al. (2009)
cardiovascular -Peng et al. (2008)
-Bell et al. (2008)
Moolgavkar (2000) 18–64 years Other incidence (2014)
Lost Work
Work loss days Ostro (1987) 18–65 years Other incidence (2000)
Restricted Activity
Minor restricted activity Ostro and Rothschild (1989) 18–65 years Literature data
days
Asthma
Pooled estimate: 6–18 years Prevalence (2008)
Asthma exacerbations -Ostro et al. (2001)
-Mar et al. (2004)
Version 2: 13Health Endpoint Studies Developed Health Study Baseline Health Data
Impacts Functions Population as Named in BenMAP–
CE
Pooled estimate: All ages Other incidence (2014)
-Mar et al. (2010)
Asthma-related ER visits
-Slaughter et al. (2005)
-Glad et al. (2012)
Pooled estimate: 0–17 years Other incidence (2014)
Hospital admission,
-Babin et al. (2007)
asthma
-Sheppard (2003)
Respiratory illness
Upper respiratory Pope et al. (1991) Asthmatics, 9– Prevalence (2008)
symptoms 11 years
Lower respiratory Schwartz and Neas (2000) 7–14 years Literature data
symptoms
Acute bronchitis Dockery et al. (1996) 8–12 years Other incidence (2000)
Hospital admission, Moolgavkar (2000) 18–64 years Other incidence (2014)
chronic lung disease
Mortality
Krewski et al. (2009) 30+ years Mortality incidence
(2020)
Mortality, all-cause Lepeule et al. (2012) 25+ years
Woodruff et al. (1997) Infant (range in the valuations shown, for both the baseline and the control benefits, is mostly
attributable to the range in mortality impacts from the different health impact functions
applied.
Table 4.1: Summary of health and monetary impacts of PM2.5 from PBF Martinez refinery
emissions and percent change of valuation for FCCU emissions under Control Scenario A and
Control Scenario B.
Reduction Reduction
Baseline Health Impact1 Valuation2
under Control under Control
of PBF Martinez Refinery (Annual) (Annual)
Scenario A Scenario B
Cardiovascular 0.3–2.4 heart attacks $37 k–350 k -35% -50%
0.6 hospital admissions $26 k -35% -50%
Restricted Activity 2,700 days $200 k -35% -50%
Lost Work 460 days $100 k -35% -50%
Asthma 110 exacerbations3 $7 k -35% -50%
$1 k -35% -50%
2 emergency room visits
$1 k -35% -50%Note that valued benefits shown in Table 4.1 represent US EPA’s national average valuation,
and were not modified specifically for the Bay Area.
Version 2: 16References
Babin, S. M., H. S. Burkom, et al. 2007. Pediatric patient asthma-related emergency department visits
and admissions in Washington, DC, from 2001–2004, and associations with air quality, socio-economic
status and age group. Environ Health 6:9.
Bell, M. L., K. Ebisu, et al. 2008. Seasonal and Regional Short-term Effects of Fine Particles on Hospital
Admissions in 202 US Counties, 1999–2005. American Journal of Epidemiology 168(11): 1301-10.
Dockery, D.W., J. Cunningham, A.I. Damokosh, L.M. Neas, J.D. Spengler, P. Koutrakis, J.H. Ware, M.
Raizenne, and F.E. Speizer. 1996. Health Effects of Acid Aerosols on North American Children:
Respiratory Symptoms. Environmental Health Perspectives 104(5):500-5. EPA-HQ-OAR-2009-0472-0225.
Fang, Y., B. Koo, A. Baird, Y. Jia, J. Cordova, J. Matsuoka, S. Reid. 2021. Modeling Fine Particulate Matter
Emissions from the Chevron Richmond Refinery: An Air Quality Health Impact Analysis (Version 2).
Available from Bay Area Air Quality Management District, San Francisco, CA.
Glad, J.A., L.L. Brink, E.O. Talbott, P.C. Lee, X. Xu, M. Saul, and J. Rager. 2012. The Relationship of
Ambient Ozone and PM2.5) Levels and Asthma Emergency Department Visits: Possible Influence of
Gender and Ethnicity. Archives of Environmental & Occupational Health. Vol 62(2): 103-8.
Holstius, D. and P. Martien. 2021. Exposure and Health Equity Assessment for Rule 6-5. Available from
Bay Area Air Quality Management District, San Francisco, CA.
Jerrett, M., R.T. Burnett, B.S. Beckerman, et al. 2013. Spatial analysis of air pollution and mortality in
California. Am J Respir Crit Care Med 188(5):593-59. doi:10.1164/rccm.201303-0609OC.
Koo, B., Y. Jia, J. Cordova, Y. Fang, S. Reid, J. Matsuoka. 2021a. Modeling Fine Particulate Matter
Emissions from the Chevron Richmond Refinery: An Air Quality Analysis. (Version 2), March 2021,
BAAQMD Air Quality Modeling and Analysis Section Publication No. 202009-020-PM.
Koo, B., Y. Jia, J. Cordova, Y. Fang, S. Reid, J. Matsuoka. 2020b. Modeling Fine Particulate Matter
Emissions from the PBF Martinez Refinery: An Air Quality Analysis. (Version 2), March 2021, BAAQMD
Air Quality Modeling and Analysis Section Publication No. 202009-021-PM.
Krewski, D., M. Jerrett, R.T. Burnett, et al. 2009. Extended follow-up and spatial analysis of the American
Cancer Society study linking particulate air pollution and mortality. Res Rep Health Eff Inst. Research
Report 140:5-114; commentary 115-36. PMID: 19627030.
Lepeule, J., F. Laden, D. Dockery, J. Schwartz. 2012. Chronic exposure to fine particles and mortality: an
extended follow-up of the Harvard Six Cities study from 1974 to 2009. Environ Health Perspect.
120(7):965-70. doi: 10.1289/ehp.1104660.
Mar, T. F., T. V. Larson, et al. 2004. An analysis of the association between respiratory symptoms in
subjects with asthma and daily air pollution in Spokane, Washington. Inhal Toxicol 16(13): 809-15.
Mar, T. F., J. Q. Koenig and J. Primomo. 2010. “Associations between asthma emergency visits and
particulate matter sources, including diesel emissions from stationary generators in Tacoma,
Washington.” Inhal Toxicol 22(6): 445-8.
Moolgavkar, S.H. 2000. “Air Pollution and Hospital Admissions for Diseases of the Circulatory System in
Three U.S. Metropolitan Areas.” Journal of the Air and Waste Management Association 50(7):1199-206.
Version 2: 17Ostro, B.D. 1987. Air Pollution and Morbidity Revisited: A Specification Test. Journal of Environmental
Economics Management 14:87-98. EPA-HQ-OAR-2009-0472-1670.
Ostro, B.D. and S. Rothschild. 1989. Air Pollution and Acute Respiratory Morbidity: An Observational
Study of Multiple Pollutants. Environmental Research 50(2):238-47. EPA-HQ-OAR-2009-0472-0364.
Ostro, B., M. Lipsett, J. Mann, H. Braxton-Owens, and M. White. 2001. Air Pollution and Exacerbation of
Asthma in African-American Children in Los Angeles. Epidemiology 12(2):200-208.
Peng, R. D., M. L. Bell, et al. 2009. Emergency admissions for cardiovascular and respiratory diseases and
the chemical composition of fine particle air pollution. Environ Health Perspect 117(6): 957-63.
Peng, R. D., H. H. Chang, et al. 2008. Coarse particulate matter air pollution and hospital admissions for
cardiovascular and respiratory diseases among Medicare patients. JAMA 299(18): 2172-9.
Peters, A., D.W. Dockery, J.E. Muller, and M.A. Mittleman. 2001. Increased Particulate Air Pollution and
the Triggering of Myocardial Infarction. Circulation. 103(23):2810-5. EPA-HQ-OAR-2009-0472-0239.
Pope, C.A., III, D.W. Dockery, J.D. Spengler, and M.E. Raizenne. 1991. Respiratory Health and PM10
Pollution: A Daily Time Series Analysis. American Review of Respiratory Diseases 144(3 Pt 1):668-74.
EPA-HQ-OAR-2009-0472-1672.
Pope, C. A., III, J. B. Muhlestein, et al. 2006. Ischemic heart disease events triggered by short-term
exposure to fine particulate air pollution. Circulation. 114(23): 2443-8.
Schwartz, J., and L.M. Neas. 2000. Fine Particles are More Strongly Associated than Coarse Particles with
Acute Respiratory Health Effects in Schoolchildren. Epidemiology 11(1):6-10.
Sheppard, L. 2003. Ambient Air Pollution and Nonelderly Asthma Hospital Admissions in Seattle,
Washington, 1987-1994. In Revised Analyses of Time-Series Studies of Air Pollution and Health. Special
Report. Boston, MA: Health Effects Institute. EPA-HQ-OAR-2009-0472-0318.
Slaughter, J.C., et al. 2005. “Association between particulate matter and emergency room visits, hospital
admissions and mortality in Spokane, Washington.” Journal of Exposure Analysis & Environmental
Epidemiology, 15, 153-9. doi: 10.1038/sj.jea.7500382.
Sullivan, J., L. Sheppard, et al. 2005. Relation between short-term fine-particulate matter exposure and
onset of myocardial infarction. Epidemiology. 16(1): 41-8.
Tanrikulu, S., C. Tran, S. Beaver. 2011. Health Impact Analysis of Fine Particulate Matter in the San
Francisco Bay Area, Sept 2011, BAAQMD Research and Modeling Section Publication No. 201109-009-
PM.
US EPA, 2018. Environmental Benefits Mapping and Analysis Program – Community Edition User’s
Manual – updated for BenMAP–CE v1.4.8, https://www.epa.gov/sites/production/files/2015-
04/documents/benmap-ce_user_manual_march_2015.pdf.
Vodonos, A., Y.A. Awad, J. Schwartz. 2018. The concentration-response between long-term PM2.5
exposure and mortality; A meta-regression approach. Environmental Research 166:677-89.
doi:10.1016/j.envres.2018.06.021.
Woodruff, T.J., J. Grillo, and K.C. Schoendorf. 1997. The Relationship Between Selected Causes of
Postneonatal Infant Mortality and Particulate Air Pollution in the United States. Environmental Health
Perspectives 105(6):608-12. EPA-HQ-OAR-2009-0472-0382.
Version 2: 18Zanobetti, A., M. Franklin, et al. 2009. Fine particulate air pollution and its components in association
with cause-specific emergency admissions. Environmental Health. 8: 58-60.
Zanobetti A. and Schwartz, J. 2006. Air pollution and emergency admissions in Boston, MA. J Epidemiol
Community Health 60(10): 890-5.
Version 2: 19You can also read