ArcUser Conserving a Network of Climate-Resilient Lands 26 - A Growing Hunger 22 Helping Safeguard Threatened Raptors Worldwide 66 - Esri
←
→
Page content transcription
If your browser does not render page correctly, please read the page content below
Winter 2021

ArcUser
The Magazine for Esri Software Users

Conserving a Network of
Climate-Resilient Lands 26

A Growing Hunger     22

Helping Safeguard Threatened
Raptors Worldwide 66
E    S
          [Eos    Positi oning             Systems]

For ArcGIS Collector® and ArcGIS Field Maps® on iOS

                  A   R R O W   S E R I E   S

                   Tel: +1 (450) 824-3325
                 e-mail: info@eos-gnss.com
                          Made in Canada
Contents Winter 2021 Vol. 24 No. 1
Focus: Social Equity
18 Online Schooling Prompts Municipalities to Map
Digital Inequities
22 A Growing Hunger
24 Taking a Data-Driven Approach to Affordable Housing
18
Special Section
42 Regional Data Platform Strengthens Collaboration
and Cooperation
42
End Notes
66 Helping Safeguard Threatened Raptors Worldwide
On the Cover
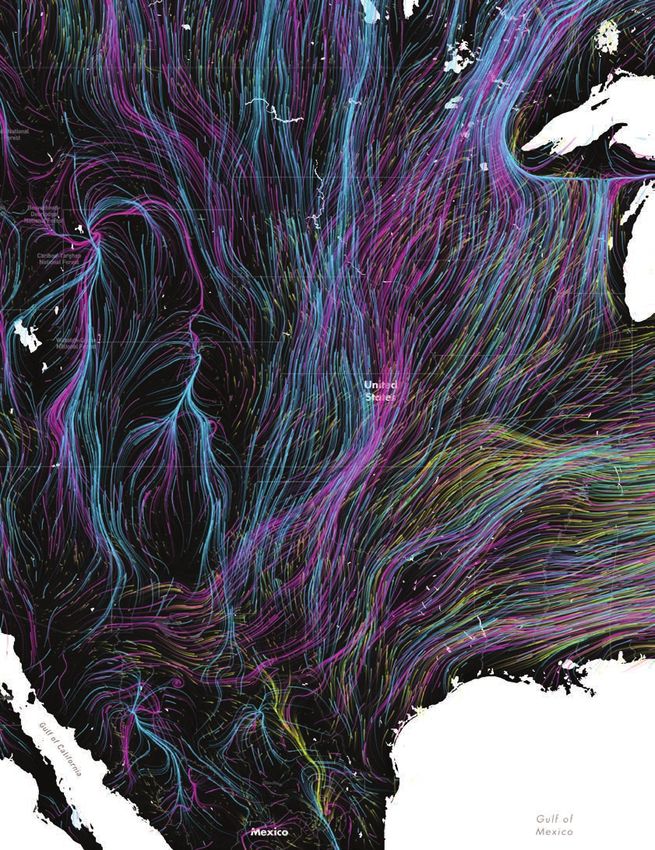
The Resilient and Connected Network, a GIS mapping tool
developed by The Nature Conservancy (TNC), gives conservationists
a way to save biodiversity for the future. As the climate warms,
66 species are moving to find more hospitable places to live. This
map shows the movement of mammals in pink, birds in blue, and
amphibians in yellow. (© Dan Majka and Nicholas Rapp/TNC)
esri.com/arcuser Winter 2021 au 3
Proving Tobler’s Law                                                                        ArcUser
                                                                                            Winter 2021 Vol. 24 No. 1

In the last year, the world has run up against a hard truth that geographers have known
all along—the world is a very interconnected place. As Waldo Tobler’s First Law of
Geography states: “Everything is related to everything else. But near things are more       Editorial
related than distant things.” This has been demonstrated vividly as disruptions, deci-      Editor Monica Pratt
sions, and events in one location have caused repercussions that are perhaps most           Contributors Jim Baumann, Carla Wheeler,
acutely felt locally but are often palpable regionally and sometimes internationally. The   Citabria Stevens
effects of individual decisions can extend far beyond our immediate circle and can          Technical Adviser Paul Dodd
                                                                                            Copyediting Linda Thomas
ripple across our communities and nation.
   GIS is a particularly adept tool for letting us visualize and measure just how much      Design
our fates are tied to each other and the natural world. Researchers for The Nature          Creative Director James Hitchcock
Conservancy developed a GIS tool for examining biodiversity, the movement of spe-           Designers Doug Huibregtse
cies, and the health of landscapes. They found that areas resilient to climate change       Illustrators David Lauruhn
formed an interconnected web. This finding is leading to a shift in the paradigm of         Photographers Eric Laycock, Eric Johnson
large landscape conservation.                                                               Print Coordinator Lilia Arias

   Similarly, mobile GIS apps supported on the cloud are tracking raptor populations.       Advisory Board
These birds are valuable indicators of environmental health that warn when vital earth      Corporate Marianna Kantor
support systems are threatened. The African Raptor Databank (ARDB) was developed            Products Damian Spangrud
to track the well-being of eagles, hawks, vultures, and other birds of prey.                International Dean Angelides
   GIS lets us also see where change is needed by identifying threats to societal well-     Marketing Communications Jeff Brazil
being. The pandemic and accompanying social unrest of the last year has highlighted         Industries Damian Spangrud
threats to basic needs such as food and shelter and obstacles that limit opportunities
for education and employment. Through viewing these challenges in all their com-
plexity using GIS, we can better understand how to work together to improve these
situations, whether it is delivering food to neighbors more efficiently or providing        Read ArcUser Online
more equitable access to broadband internet to make sure students don’t fall behind         Visit the ArcUser website (www.esri.com/
in their schoolwork.                                                                        arcuser) to download tutorials, read current and
                                                                                            past issues, and access additional resources.

                                                                                            Subscribe to ArcUser
                                                                                            Residents of the United States can
                                                                                            subscribe to the print edition of ArcUser at
                                                                                            go.esri.com/subscribe.
Monica Pratt
ArcUser Editor                                                                              Manage Your ArcUser Subscription
                                                                                            Make changes to your subscription information
                                                                                            at go.esri.com/manage-subscriptions.

                                                                                            Advertise in ArcUser
                                                                                            For information regarding placing an
                                                                                            advertisement in ArcUser magazine, contact
                                                                                            the advertising coordinator at ads@esri.com.

                                                                                            Editorial Inquiries
                                                                                            Monica Pratt, ArcUser Editor
                                                                                            380 New York Street
                                                                                            Redlands, CA 92373-8100 usa
                                                                                            arcuser_editor @esri.com

                                                                                            Read the article submission guidelines at
                                                                                            https://bit.ly/3mwMRxc.

                                                                                            ISSN 1534-5467
                                                                                            ArcUser is published quarterly by Esri at
                                                                                            380 New York Street, Redlands, CA 92373-8100        usa.
                                                                                            ArcUser is written for users of Esri software and
                                                                                            distributed free of charge to registered users.

4    au Winter 2021 esri.com/arcuser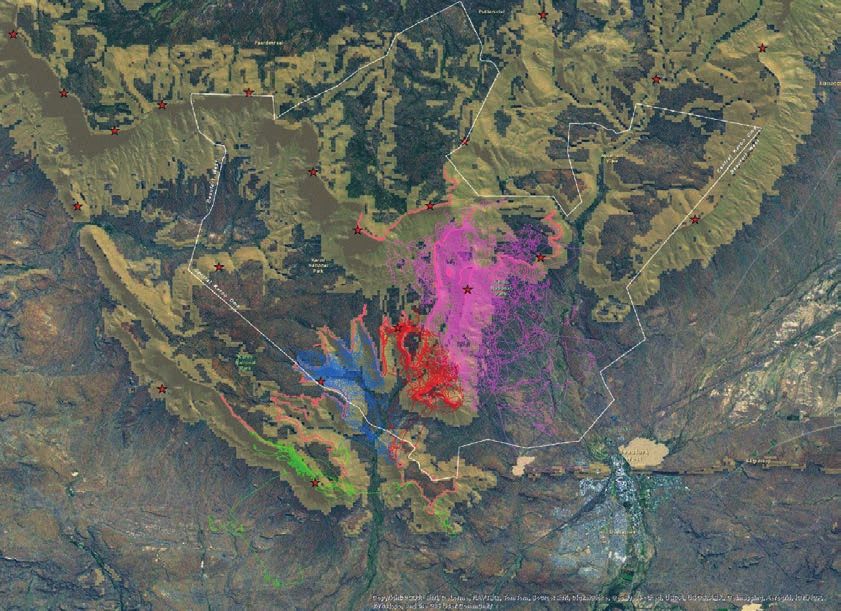
Departments
     Software and Data
     6    Briefly Noted
     8    ArcGIS Pro 2.7 Enhances Data Capture, Use, Analysis,
          and Management
     12   Ready-to-Use Geospatial Deep Learning Models
     14   A Happy Collaboration between ArcGIS Pro and R

     Feature
     26 Conserving a Network of Climate-Resilient Lands

     30 Interactive Map Depicts Global Submarine Networks

     Manager’s Corner
12   32 A Better Way to Quickly Deploy ArcGIS Solutions

     33 Management Improved by Understanding

     Developer’s Section
     34 Bridging the World of 3D GIS and Game Engines
     36 Simplify Integrating Frameworks and Build Tools
          with the ArcGIS API for JavaScript
     38 Features and Capabilities in the New ArcGIS API
          for Python

     Hands On
     46 Explore Your Data First

     52   Mapping with Purpose

33   56 Protect Your Editable Feature Data from the Public

     58 Ready-to-Use US Census Data Layers

     Bookshelf
     61   The Esri Guide to GIS Analysis, Volume 2: Spatial
          Measurements and Statistics, Second Edition
     61   Understanding Crime: Analyzing the Geography
          of Crime

     Faces of GIS
     62 Virtual GIS Day Events Are a Hit

     Education
     64 A Foundation for Problem-Solving

58

                                  esri.com/arcuser Winter 2021 au   5
Briefly Noted
Esri Acquisition Will Enhance 3D Visualization
Capabilities
Esri acquired Zibumi Yazılım Biliim Tasarım Arge Sanayi Ticaret S.A. (Zibumi), a software
development company headquartered in Turkey and known as a developer of innovative
visualization, analysis, and simulation capabilities for leveraging game engines. Zibumi
will help advance 3D visualization and simulation in Esri software and expand the ongoing
integration of game engine technologies into ArcGIS. Esri also announced the creation of
the Ankara R&D Center.
New American Community Survey Data in
ArcGIS Living Atlas of the World
ArcGIS software users have easy access to the newest values for five-year estimates of cur-
rent data on demographic, housing, and workforce characteristics of the US population.
Through ArcGIS Living Atlas of the World, users have access to 1,700 annually updated
attributes of American Community Survey (ACS) tables from the US Census Bureau.
Tool Will Provide Data to Help Improve The Water Health Tool uses real-time
analysis and enables countries to monitor
Ocean Quality coastal water quality.
A team composed of staff from Esri, the United Nations Environment Programme, and
GEO Blue Planet released the Water Health Tool, a new free tool that uses real-time
analysis enabling countries to monitor coastal water quality and gather information to
guide policy and reduce pollution from land sources. This new statistical approach uses
satellite data and geospatial technology supports one of the United Nations Sustainable
Development Goals (SDG) to prevent and significantly reduce marine pollution of all
kinds by 2025. The team was recognized with the SDG Award for the Special Category,
Collaboration for developing this tool.
Esri Recognized for Its Work in Mapping
COVID-19
Inc. magazine’s inaugural Best in Business list has awarded Esri the gold medal in the
Government Services category. These awards were created to honor companies that
have gone above and beyond to make a positive difference, tackling today’s problems
to lead to a better future. “This year, more than ever, our mission of helping our cus-
tomers make an impact through the use of GIS is critical,” said Jack Dangermond, Esri
founder and president.
6 au Winter 2021 esri.com/arcuser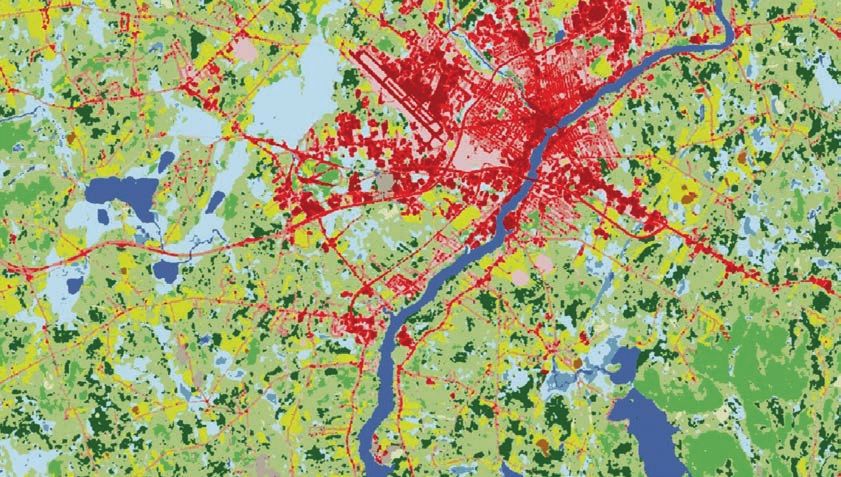
Software and Data
Pan-African Nonprofit and Esri Encourage
Geospatial Technology Use
Esri and AfroChampions, a Pan-African nonprofit that promotes policies that foster
private-public collaboration for Africa’s economic transformation. This new partnership
with AfroChampions will contribute to sustainable economic development in Africa and
promote the benefits of a shared geospatial infrastructure throughout the continent.
GIS technology will be used to create new opportunities for growth, especially in criti-
cal fields such as health and telemedicine, land management, agriculture, and mobility.
Africa GeoPortal, the continent’s existing geospatial community platform built by Esri, will
support the AfroChampions’ virtual festival Boma of Africa as well as other ongoing com-
munity outreach activities. To learn more, visit esri.com/en-us/about/about-esri/mea.
AAG Diversity and Inclusion Awards Announced
The American Association of Geographers honored Raynah Kamau, Whitney Kotlewski,
and Dr. Jovan Lewis with its 2021 AAG Diversity and Inclusion Awards. Kamau and
Kotlewski created Black Girls M.A.P.P. and the People for the People (P4TP) initiative. Both
are employees at Esri and grassroots activists whose collaborative work has increased vis-
ibility for community-engaged geography and promoted greater inclusion within GIS pro-
fessional culture. Lewis is an economic geographer at the University of California, Berkeley.
esri.com/arcuser Winter 2021 au 7
ArcGIS Pro 2.7 Enhances
Data Capture, Use, Analysis,
and Management
ArcGIS Pro 2.7 intro- feature layers. This release also provides data from the device as its position is up-
duces a new data type additional Spatial Statistics tools and an dated. Features can be created based on
and new type of geoda- expanded and enhanced SDK. the current geographic location of a GNSS
tabase as well as more device. Detailed information about a de-
extensive analysis tools GNSS Device Location Support vice’s position can be recorded to a log file.
and capabilities for integrat- ArcGIS Pro supports the collection of
ing workflows across ArcGIS applications high-accuracy data in the field using any Mobile Geodatabases
from field to enterprise to the cloud. New GNSS device. When connected to a GNSS ArcGIS Pro 2.7 introduces a new type of
with ArcGIS Pro 2.7 is support for Global device, ArcGIS Pro will show the location of geodatabase, the mobile geodatabase.
Navigation Satellite System (GNSS) device the device on a map or in a scene. As the As with other geodatabases, a mobile
location, mobile geodatabases, layer and device travels, its location automatically geodatabase can store geographic data-
feature blending, Movement Analysis tools, updates in the view. A point feature class sets, perform data modeling tasks, and be
linear reference editing, and 3D object can be set up that will automatically log used as inputs to geoprocessing tools and
Layer blending can now be used in ArcGIS Pro as an alternative to transparency when combining layers or features.
8 au Winter 2021 esri.com/arcuser
Software and Data
scripts. A mobile geodatabase is stored
in an SQLite database, which is a widely
available, stable, and trusted database.
As a full-featured relational database, it
allows querying and reporting workflows
through SQL. It is open source and in the
public domain, so no licensing is required
and it has cross-platform support. SQLite
databases are stored in a single file on disk,
making them portable. They provide an ef-
ficient data exchange format.
The mobile geodatabase is the founda-
tion for fully interoperable workflows be-
tween ArcGIS Pro and ArcGIS Runtime that
will enhance workflows between ArcGIS
Runtime applications and the Esri suite of
mobile apps.
3D objects can display
Layer and Feature Blending characteristics such as reflection,
Layer blending, which has been available shadowing, and roughness, adding
detail and realism to ArcGIS Pro scenes.
in the ArcGIS API for JavaScript and the
ArcGIS Online Map Viewer beta, can now
be used in ArcGIS Pro as an alternative to
transparency when combining layers or fea- point locations grouped by unique devices, Linear Reference Editing
tures. Use blending to brighten or darken a such as GPS or other mobile devices. The New linear referencing editing capabilities
layer to bring attention to the highs or lows Movement Analysis toolset contains tools are now part of the core ArcGIS Pro ap-
of map color ranges. When a blending that analyze point track data, allowing the plication and are designed for users who
mode is applied to a layer, the layers below comparison of tracks over different areas, have basic linear referencing needs such
it in the map’s drawing order are visually the extraction of unique identifiers from a as maintaining measures on features and
altered. Most blending modes are applied point track dataset, and the identification linear referencing routes. Used by linear ref-
to each color channel independently. For of the locations where tracks meet. The erencing systems (LRS), routes model linear
further control, blending modes can be movement tools are Find Cotravelers; Find distances and related events. Routes are
applied to features within a single feature Meeting Locations; Compare Areas; and created as m-aware polyline centerline fea-
layer. In this case, symbolized features are Classify Movement Events, the newest tool. tures with measure values (m-values) at each
blended with each other within the layer. Classify Movement Events attributes vertex that are stored independently of the
Blending modes enhance the visualization point track data with turn information (in- line geometry. With ArcGIS Pro 2.7, users
of features and can change how maps are cluding U-turns), stops, and information can create a route from selected line fea-
designed for publication. about acceleration and deceleration. This tures; calibrate a selected route using two
simplifies the time-consuming process of or more specified calibration points; and
Movement Analysis Tools reviewing track points to figure out how define a portion of a linear route by tracing
Movement Analysis tools use point track an entity was moving at a location. This is and clicking two points along the route.
data to analyze and visualize the move- useful for analysts working with shipping Note that these new tools are intended
ment of objects in space and time. Point telemetry, monitoring feeds from traffic, or for use only when a single LRS is required.
track data consists of time-sequenced reviewing GPS device metrics. The Roads and Highways and Pipeline
esri.com/arcuser Winter 2021 au 9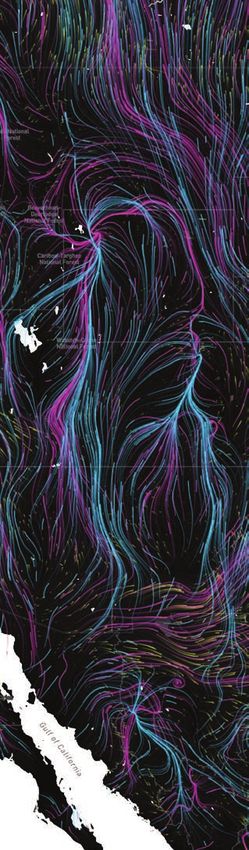
The new linear referencing editing capabilities are part of the core ArcGIS Pro application.
Referencing extensions, available with geodatabase 3D object features can be introduced with the new Space Time
ArcGIS Pro, support a more comprehen- opened and edited in third-party mode- Pattern Mining tools. The Visualize Space
sive solution for linear referencing system ling applications such as Maya and Blender. Time Cube in 3D and Visualize Space Time
workflows and provide an advanced set Cube in 2D tools help explore the time
of linear referencing editing and manage- Spatial Statistics series outliers of a space-time cube.
ment tools in addition to the new capabili- The release of ArcGIS Pro 2.7 includes many
ties available in core ArcGIS Pro. improvements to the Spatial Statistics ArcGIS Pro SDK for the
tools, that range from out-of-the-box data Microsoft .NET Framework
3D Object Feature Class Layers engineering tools to sophisticated statisti- This is an extensive and important re-
The 3D object feature class is a new data cal methods for analysis. Data engineer- lease of the ArcGIS Pro SDK that com-
type that has evolved from the multipatch ing is an integral part of an analysis, and plements new capabilities in the
feature class. Objects in this class are it is often the most time-consuming. The core product. It includes new APIs
stored in file, enterprise, or mobile geo- new Dimension Reduction, Transform for Device Location, Parcel Fabric,
databases. Like multipatches, 3D objects Field, Standardize Field, Encode Field, and and Voxel Layers. Existing APIs
combine geometry and textures for models Reclassify Field tools aid in more quickly for Geodatabase, Layouts, and
of features that occupy 3D space and have preparing data for subsequent analysis. Reports APIs were also improved.
additional properties. 3D object features The new tools in the Spatial Statistics
can display characteristics such as reflec- toolbox, which include the Spatial Outlier New Start Page
tion, shadowing, and roughness, adding Detection, Spatial Association Between The new start page features a Resources
detail and realism to ArcGIS Pro scenes. Zones, and Neighborhood Summary section that provides centralized access
The same editing and analysis tools that Statistics tools, can give you a better to information about ArcGIS Pro and helps
work on multipatches can be used on a 3D understanding of your data. Three new users migrating from ArcMap to ArcGIS
object feature layer in a scene in ArcGIS parameters for detecting and identify- Pro. Links tutorials, web courses, and docu-
Pro. Geoprocessing tools are available ing outliers at each location—Curve mentation about ArcGIS Pro will build es-
to convert multipatch feature classes to Fit Forecast, Exponential Smoothing sential skills and helps users keep up with
and from 3D object feature classes. File Forecast, and Forest-based Forecast—are new developments in the software.
10 au Winter 2021 esri.com/arcuserSoftware and Data
Time Series Outlier Visualization in 3D with above fitted values show in purple and below fitted values shown in green.
Pantone Colors Roads and Highways, and ArcGIS Parcel
ArcGIS Pro includes eight styles of the Fabric. ArcGIS Pro 2.7 can connect to the
Pantone® spot color books that will ensure new service-driven architecture to run
the consistent appearance of output in steps. With traditional geodatabase-driven
printing workflows. These colors are part architecture deployment, ArcGIS Pro has
of a proprietary and widely used system for
standardized color reproduction. They are
achieved feature parity with ArcMap.
Share
Your Story
organized into books categorized by type ArcGIS Data Reviewer
and output medium. The ArcGIS Pro 2.7 release includes new
in ArcUser
In ArcGIS Pro 2.7, each of these books methods for automated validation, and
is presented as a separate system style enhancements to error management tools.
of predefined and named colors. Pantone Automated validation methods evaluate a
colors are denoted by a white corner on the feature’s quality without human interven-
Write an article for ArcUser
color chip. Although these styles are read- tion, saving time and resources while en- magazine. Tell the GIS world
only, they can be copied to a Favorites suring data is accurate and trustworthy. how your organization saved
style and modified to limit the number of ArcGIS Pro 2.7 includes many more im- money and time or acquired new
colors to just the ones needed for specific provements including enhancements and capabilities using GIS. Share your
projects. new capabilities in the areas of application GIS management insights or your
sharing, mapping and visualization, labe- expertise in extending the GIS
ArcGIS Workflow Manager ling and annotation, editing, analysis, data functionality of Esri software.
ArcGIS Pro 2.7 is the first release of ArcGIS management, and the use of multidimen-
Workflow Manager’s new service-driven sional and lidar data. More than 50 chang- esri.com/ausubmission
architecture in ArcGIS Pro. This release pri- es were made in response to user requests.
marily improves the productivity of organi- For a complete description of changes
zations and industries that perform map- in this release, see “What’s New in ArcGIS Copyright © 2020 Esri. All rights reserved.
ping functions using the Utility Network, Pro” at https://bit.ly/3hO8xDC
esri.com/arcuser Winter 2021 au 11Ready-to-Use Geospatial
Deep Learning Models
By Vinay Viswambharan and Rohit Singh
With the fire hose of imagery that’s streaming daily from a Pro, with the imagery models. Just point the tool to the imagery
variety of sensors, the need for using artificial intelligence (AI) to and the downloaded model. That’s it. Deep learning has never
automate feature extraction is only increasing. been this easy. Though it’s not necessary, a graphics processing
The ability to train more than a dozen deep learning models unit (GPU) can help speed things up. With ArcGIS Enterprise, you
on geospatial datasets and derive information products has been can scale up inferencing using ArcGIS Image Server.
available using the ArcGIS API for Python or ArcGIS Pro, and users In the future, you’ll be able to consume the model directly with
can scale up processing using ArcGIS Image Server. ArcGIS Online Imagery and run it against your own uploaded im-
Esri is taking AI to the next level with ready-to-use geospatial agery without an ArcGIS Enterprise deployment. The 3D Basemaps
AI models in the ArcGIS Living Atlas of the World (https://bit. solution is also being enhanced to use the tree point classification
ly/2VGRh9m). Initially, three models have been made available. Two model and create realistic 3D tree models from raw point clouds.
of the models use satellite imagery. One model extracts building
footprints and the other performs land-cover classification. A third How to Benefit from Deep Learning Models
model classifies points representing trees in point cloud datasets. It probably goes without saying that manually extracting features
These newly released models have been pretrained by Esri on from imagery—like digitizing footprints or generating land cover
huge volumes of data and can be readily used—with no training maps—is time-consuming. Deep learning automates this pro-
required—to automate the tedious task of digitizing and extract- cess and significantly minimizes the manual interaction needed.
ing geographic features from satellite imagery and point cloud However, training your own deep learning model can be compli-
datasets. Not only do these models bring the power of AI and deep cated. It requires a lot of data and extensive computing resources
learning to the Esri user community, but they are also accessible to as well as the knowledge of how deep learning works.
anyone with an ArcGIS Online subscription at no additional cost. With ready-to-use models, you no longer have to invest time and
energy either manually extracting features or training your own deep
Using the Models learning models. These ready-to-use models have been trained on
Using these models is simple. You can use geoprocessing tools, data from a variety of geographies and work well. As you receive
such as the Detect Objects Using Deep Learning tool in ArcGIS new imagery, you can extract features at the click of a button and
produce GIS layers for mapping, visualization, and analysis.
Building footprints extracted from imagery of Palm Islands, Dubai. Ready-to-Use Models
The three deep learning models available from ArcGIS Online
as deep learning packages (DLPKs) can be used with ArcGIS Pro,
ArcGIS Image Server, and ArcGIS API for Python.
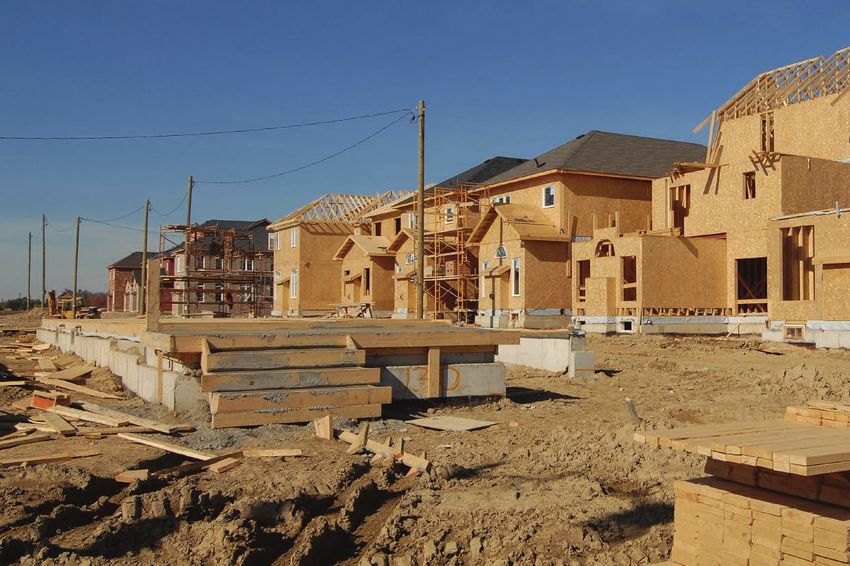
The Building Footprint Extraction—USA model is used to ex-
tract building footprints from high-resolution satellite imagery.
While it is designed for the contiguous United States, it performs
fairly well in other parts of the globe. Building footprint layers are
useful for creating basemaps. They are also used in analysis work-
flows for urban planning and development, insurance, taxation,
change detection, and infrastructure planning. Learn more about
the Building Footprint Extraction—USA model from this story map
at https://arcg.is/1GXrvu.
The Land Cover Classification (Landsat 8) model uses Landsat 8
imagery to create land-cover products that have the same classes
as the National Land Cover Database (NLCD). The resultant land-
cover maps are useful for urban planning, resource management,
change detection, and agriculture.
This generic model has been trained on NLCD 2016 with the
12 au Winter 2021 esri.com/arcuserSoftware and Data
The Landcover Classification (Landsat 8) model has been trained on NLCD 2016 with the same Landsat 8 scenes that were used to
produce the database.
same Landsat 8 scenes that were used to produce the database. and geospatial AI solutions in ArcGIS. He is passionate about deep
Because land-cover classification is complex, it is hard to capture learning, its intersection with geospatial data and satellite imagery,
using traditional means. Deep learning models can learn these and the application of deep learning to the Science of Where.
complex semantics and give superior results.
The Tree Point Classification model can be used to classify
points representing trees in point cloud datasets. Classifying tree 3D scene created by employing Tree Point Classification model.
points is useful for creating high-quality 3D basemaps, urban plans,
and forestry workflows.
Try These Models for Yourself
The deep learning tools in ArcGIS have dependencies that require
downloading and installing Python site packages. Get the installer
to add these packages from the Esri GitHub repo at https://bit.
ly/2LIuzvR. Download the DLPKs from the ArcGIS Living Atlas of
the World. Learn more about using these models from the Imagery
and Remote Sensing community page on GeoNet (https://bit.
ly/3oxnv36).
About the Authors
Vinay Viswambharan is a product manager on the Imagery team at
Esri. He is passionately interested in remote sensing and imagery.
Rohit Singh is the managing director of the Esri R&D Center in New
Delhi and leads the development of data science, deep learning,
esri.com/arcuser Winter 2021 au 13A Happy Collaboration
between ArcGIS Pro and R
By Witold Fraczek, Jian Lange, and Carsten Lange
This map shows the location and relative
size of the study area in North Carolina and
includes one of the explanatory variables:
the driving time between the cities of
Durham and Raleigh. Driving time was
classified into 10-minute intervals beginning
with bright yellow, indicating less than 10
minutes and progressing to 90 minutes.
Thick yellow lines indicate freeways.
looking for opportunities to invest in real
estate and commercial infrastructure can
use the model to locate suitable areas.
The availability of large datasets, ad-
vanced spatial analysis, and machine learn-
ing tools allow data analysts to combine
technologies to take predictive analytics
to the next level. Existing research about
predicting urban development often re-
quires working with more than one type of
software. The exchange of large datasets
between different software applications
complicates the data infrastructure and
data exchange between collaborators.
A good urban growth prediction model Which areas would be most suitable for The project was initiated by Fraczek. He
empowers city planners to make informed urbanization? selected and preprocessed raster data
urban policy decisions and assists investors How probable is urban development in a from the National Land Cover Database
in making profitable choices. Although the specific area? (NLCD) for 2001 and 2016. The data was
resultant monetary and social benefits can Answers to these questions can benefit processed with ArcGIS Pro and stored in a
be large, it is difficult to quantify them. government agencies, such as planning de- geodatabase.
The authors—Witold Fraczek, Jian Lange, partments, that need a deeper understand- ArcGIS Pro and various R packages were
and Carsten Lange—worked together on a ing of urban growth to make better policies. used in creating the predictive analysis
project to develop a workflow and build a Using predictions from the model, areas model, which assessed the effects of fac-
machine learning model for identifying lo- not currently zoned for development but tors such as terrain characteristics; pro-
cations with a higher probability of urban likely to be urbanized might be good can- jected population growth; and proximity
development. didates for development, although other to roads, urban centers, an environmental
Fraczek and Jian Lange are trained GIS factors, such as environmental impacts, areas that are protected.
professionals who work for Esri, use ArcGIS must be considered. Private investors In the early stages of the project, data
products daily, and are proficient with
geospatial technology. Both prefer to work
with ArcGIS Pro. Carsten Lange is a profes- Project workflow
sor of economics who specializes in data
Combine Connect Bring
science and machine learning. He uses the Prepare
Raster ArcGIS Pro
Train and Test
Adjusted Map/
Spatial the Random
Datasets Dataset in Data to Visualize
R programming language for statistical Datasets
into One RStudio via
Forest
ArcGIS Pro Results in
(Raster) in Predictive
computing with RStudio to solve data sci- ArcGIS Pro
Point Feature R-ArcGIS
Model in R
via R-ArcGIS ArcGIS Pro
Layer Bridge Bridge
ence problems.
14 au Winter 2021 esri.com/arcuserSoftware and Data
ModelBuilder model for creating the
point feature class containing response and
explanatory variables
The original NLCD dataset has a resolu-
tion of 30 meters. The subset used for the
study area consists of 10.6 million cells,
which is an area of 4,143 cells by 2,570 cells.
From that study area, 1.7 million cells that
were already urbanized in 2001 were not
considered. The remaining 8.9 million cells
either stayed nonurban or changed to
urban between 2001 and 2016.
was exchanged between ArcGIS Pro and patterns to uncover future patterns. This To prepare the explanatory factors for
R using comma-separated value (CSV) files study obtained land-cover raster data from the predictive model, ArcGIS Pro was used
as an intermediate step. This hindered NLCD and compared land cover for 2001 to to create seven new raster layers for the
project development and collaboration land cover for 2016 with the goal of reveal- study area:
because whenever a change in the under- ing patterns that could be used to forecast • Drive time to the nearest urban center
lying GIS raster data was needed, several urban development. • Proximity to the nearest freeway
intermediate datasets had to be recreated, As population grows, new areas must • Proximity to the nearest secondary road
stored, and exchanged. be converted to urban land use. To iden- • Proximity to the nearest environmentally
Introducing R-ArcGIS Bridge automated tify areas of urban growth, ArcGIS Pro protected area
many processes and changes to the under- was used to recategorize raster datasets • Location in a flood zone
lying GIS infrastructure. This dramatically for 2001 and 2016 into urban and non- • Predicted population growth for the
helped the collaborators develop the pro- urban land-use types. Next a new raster raster cell area as a percentage
ject. R-ArcGIS Bridge is an Esri R package dataset (ChangedToUrban) was added • Terrain slope in degrees
that allows data to seamlessly pass between to the geodatabase. Cells categorized
ArcGIS Pro and R. The powerful spatial data as nonurban in both 2001 and 2016 were Predictive Model
processing and advanced mapping capabil- categorized as ChangedToUrban=NO. Random Forest, a supervised machine learn-
ities in ArcGIS Pro could easily be combined Cells categorized nonurban in 2001 that ing algorithm based on multiple decision
with statistical computing in R. changed to urban in 2016 were categorized trees, was chosen to predict urban develop-
as ChangedToUrban=YES. Cells catego- ment. [For more information about Random
Project Scope rized as already being urban in 2001 were Forest, see the accompanying article
The study area for this prototype project not considered because the project’s focus “Seeing the Random Forest in the Decision
is the Research Triangle (The Triangle) in was on urban growth. Trees.”] The model was trained in R because
North Carolina. This region of approximate-
ly 3,744 square miles encompasses North
Carolina State University, Duke University,
and the University of North Carolina at
Probability for Development 2016
Chapel Hill. This region was chosen based
1
on its relatively limited size, which would
cut down computer processing time for 0
spatial operations. The land-use patterns
in The Triangle are geographically typical
for the United States.
Project Data
Like most statistical procedures, ma-
chine learning is based on analyzing past
A large-scale view of the predicted
probability of urban growth is displayed
over a satellite imagery basemap. Red and
orange denote areas of high suitability and
therefore high probability of urban growth,
whereas green indicates areas that have a
low probability of urban growth.
esri.com/arcuser Winter 2021 au 15 A large-scale view of the predicted
probability of urban growth over the study
Probability for Development 2016
area is displayed over a satellite imagery
1
basemap.
0
was run with the name of the feature class
and its full path to connect the feature class
to an R variable. Then, arc.select() was used
to pass the feature class attributes to the R
data frame DataAllFromPro.
Training and Testing in R
With the established connection between
the ArcGIS feature class and the R data
frame, R can dynamically access the spatial
data and train a Random Forest model to
predict urban development based on the
explanatory variables. Not all data was used
to train the Random Forest model. The
dataset was split into training and test data.
The training data consists of 85 percent
the Random Forest-based Classification for cells that stayed-non-urban cells and randomly chosen records. The remaining
and Regression tool in ArcGIS Pro 2.6 does YES for changed-to-urban cells. The 15 percent of the data is held back as testing
not output probabilities. Random Forest ChangedToUrban attribute was used later data to validate the model’s performance.
model training was based on the explana- in the predictive model as the variable to Before applying the Random Forest
tory factors stored in the seven explanatory be predicted. model, one problem needed to be ad-
raster datasets plus the ChangedToUrban The Extract Multi Values to Points tool in dressed: the dataset was unbalanced. Most
dataset as the response variable. the ArcGIS Spatial Analyst extension was areas (99.9 percent) that were undeveloped
used to add the explanatory variables to in 2001 remained undeveloped in 2016. Only
Workflow the point feature class. It extracted values 0.01 percent of the records changed from
The eight spatial datasets (i.e., the from the seven explanatory raster layers at undeveloped in 2001 to developed in 2016.
ChangedToUrban dataset plus seven ex- the location of each point and stored them Because machine learning models tend
planatory datasets) were prepared and as attributes in the point feature class table. to choose the easiest solution, the model
processed in ArcGIS Pro. The raster data- The resultant point feature class had would predict no change to urban for all
sets were converted into a single point fea- 8.9 million records with attributes that cells, given that this was a highly unbal-
ture layer, which was passed via R-ArcGIS included Point ID, the response variable anced dataset. This would lead to an
Bridge to R as an R data frame. R was used ChangedToUrban, and the seven explana- absurd accuracy rate of 99.9 percent.
to train and test the Random Forest model tory variables. To solve the problem, the Synthetic
and create predictions. Finally, the predic- Minority Oversampling Technique
tions were passed back to ArcGIS Pro via Connect Spatial Data from (SMOTE), from the DMwR-package in R
the R-ArcGIS Bridge to visualize the results. ArcGIS Pro to RStudio was used to generate a more balanced
Passing the point feature class to R using dataset. SMOTE randomly deletes re-
Preparing Spatial Data in R-ArcGIS Bridge required setting up cords from the majority class, which was
ArcGIS Pro R-ArcGIS Bridge on a computer on which ChangedToUrban=NO, and then uses a
To pass the eight spatial datasets into one R, RStudio, and ArcGIS Pro were already k-Nearest-Neighbors algorithm to artifi-
R data frame, all variables needed to be installed. (R-ArcGIS Bridge can be set up cially create new records for the minority
in one attribute table. This was done by using the R-ArcGIS Support option on the class, which was ChangedToUrban=YES.
creating a point feature layer in ArcGIS Geoprocessing tab.) In the original training dataset, the ma-
Pro with ModelBuilder, which automated Once the R-ArcGIS Bridge was set up, jority class consisted of 7,427,248 records,
the process and documented the steps. RStudio was started and the ArcGIS binding while the minority class consisted of only
The Raster to Point conversion tool was package loaded along with other packages. 9,038 records. After SMOTE was applied,
applied to the ChangedToUrban raster The data transfer process started with the the majority class was reduced to 36,152
to save a point feature class in the file function arc.check_product(), which binds records, while the minority class was in-
geodatabase. The output feature class the RStudio session to the ArcGIS instal- creased threefold to 27,114 records. The
contained an attribute—also named lation. To pass the feature class attributes balanced training dataset was then used to
ChangedToUrban—with a value of NO to an R data frame, the function arc.open() train the Random Forest model.
16 au Winter 2021 esri.com/arcuserSoftware and Data
The trained model was used on the test raster layer was created based on the to freeways or airports, may have opposite
dataset to predict if each record changed joined point feature using the Point to effects on residential and commercial de-
from non-urban to urban. Since the true Raster tool in ArcGIS Pro. velopment, it might be better to perform
values were already contained in the test separate predictions for these urban types,
dataset, they could be compared with the Visualizing Prediction Results although this would also reduce the records
predicted values to gauge the accuracy of The advanced cartographic capabilities in for each analysis. A follow-up project might
the model for the complete test dataset. ArcGIS Pro makes it ideal for mapping and shed more light on these issues.
From the 1,310,690 records in the test data- visually evaluating the prediction results.
set that did not change to urban, 1,245,362 The predicted patterns were as expected. About the Authors
records were predicted correctly (95 per- Predicted urbanization areas were located Witold Fraczek is a longtime employee
cent). From the 1,594 records in the test close to existing developed areas and of Esri who currently works in the Geo
dataset that did change to urban, 1,421 re- roads. What was interesting was that some Experience Center. He received his doc-
cords were predicted correctly (89 percent). of the areas that were predicted to have a torate in the application of GIS in forestry
To visualize the predictions in ArcGIS high probability for urban growth—based from Agricultural University; a master’s
Pro for the study area, the trained model on 2016 NLCD data—were confirmed by degree in hydrology from the University
was used to predict the entire study area the 2020 satellite imagery in the basemap of Warsaw, Poland; and a master’s degree
of 8.9 million records. The resulting data used for mapping. in remote sensing from the University of
frame, which includes the predicted values Wisconsin, Madison.
and related probabilities, needed to be Summary
Jian Lange is a principal product manager
transferred back to ArcGIS Pro. This project with ArcGIS Pro and R achieved
at Esri, focusing on spatial analysis. She is
its objective: predicting urban growth in
responsible for business planning, product
Bringing Data Back into the study area. The team integrated knowl-
road maps, overall product direction, and
ArcGIS Pro edge and skills from GIS and data science
the requirements and product manage-
In RStudio, arc.write() was used to write the to make this project successful. R-ArcGIS
ment of ArcGIS spatial analysis products
data frame from R to the original geodata- Bridge was a key component in creating a
including the ArcGIS Spatial Analyst and
base in ArcGIS. The resulting table in ArcGIS smooth workflow. It allowed R to dynami-
ArcGIS Geostatistical Analyst extensions.
included columns containing the prediction cally access ArcGIS Pro data and save R
results from the Random Forest model and results back to an ArcGIS dataset. Carsten Lange is a professor in the
included the predicted probability for each This prototype showed promising predic- Department of Economics at California
record to change from non-urban to urban. tion results. However, there is room for further State Polytechnic University, Pomona. He
The ArcGIS Pro table imported from research. For example, in this project, the specializes in monetary economics, eco-
R was joined to the original point feature predicted urban growth included residential nomic impact analysis, machine learning, ar-
class based on the common Point ID, using and commercial urban developments. Since tificial intelligence, and GIS. He is a featured
the Add Join tool in ArcGIS Pro, then a some explanatory variables, such as distance data science expert at Cal Poly Pomona.
Seeing the Random Forest in Decision Trees
A Random Forest classifier is the mean of the predictions of many Decision
Tree classifiers. To understand Random Forest models, an explanation of a
Decision Tree classifier is a good starting point.
A Decision Tree classifier guides each record through a treelike parameters. This problem can be mitigated by combining many
structure consisting of nodes where decisions are made that deter- different decision trees—ones that are different at each node in
mine if it proceeds toward the left or the right tree branch. Decisions terms of benchmarks and chosen variables.
at each node are based on benchmark values for a specific explana- The idea that a combination of weak predictors can lead to a
tory variable. The respective variables and the benchmarks for the strong prediction can be compared to a competition sometimes
decision criteria are chosen by an optimization procedure. All re- held at county fairs. Visitors to the fair, who likely have limited ag-
cords from the training dataset are guided through the tree and ricultural knowledge, try to estimate the weight of a pig. Although
end up in one of the bins on the bottom of the tree. most predictions will be off, the mean of all predictions (surpris-
Decision trees, although intuitive, are called weak predictors ingly) will be very close to the real weight of the pig. This is the
because they respond sensitively to small changes in the data or basic concept of Random Forest.
esri.com/arcuser Winter 2021 au 17Online Schooling
Prompts Municipalities
to Map Digital Inequities
By Patricia Cummens
The challenges caused by
unequal access to broadband
internet are not new. However, the
COVID-19 pandemic exacerbated Two of the country’s largest school districts Hispanic teens are twice as likely as White
their effects on some populations in Philadelphia, Pennsylvania, and Palm teens to report that they lack access to a
as the internet has become a lifeline Beach, Florida, examined the digital home computer.
divide to provide resources to low-income The pandemic made the problem im-
for students and employees who
students when they were forced to study possible to ignore. “The digital divide
are studying and working remotely. from home. was suddenly starkly apparent,” said Mark
Those without broadband access As the coronavirus pandemic endangers Wheeler, chief information officer for the
have fallen behind academically and upends the lives of millions, it perhaps City of Philadelphia’s Office of Innovation
and economically. The “homework affects no group more universally than and Technology (OIT). “There were families
gap,” which occurs where students children. Adults fortunate enough to retain who couldn’t afford reliable internet. They
jobs they can do from home are at least fa- were using whatever they could to get
lack the connectivity and access to
miliar with the concept of remote work. For by—public computing centers, free Wi-Fi
computers needed to complete kids, live video classwork reflects an alien through businesses, libraries—and with
schoolwork at home, is more pedagogy, and the lack of in-person peer those shuttered, we had a sizable popula-
pronounced for Black, Hispanic, and interaction hinders the development of tion that couldn’t participate in daily life.”
lower-income households. Two large social skills. The school closures that roiled American
school districts are using GIS to Pivoting to computer-based remote life last spring underscored a crisis within a
learning has also deepened existing fault crisis. Almost overnight, school districts—
identify these students and deliver
lines in American education. With broad- especially those with large populations of
solutions to their problems. band integral to schoolwork, researchers students from low-income families—had to
at the Pew Research Center documented a devise ways to keep the gap from swallow-
widening homework gap. ing students whole.
Teens in households with annual incomes
of less than $30,000 are nearly three times A Common Goal
as likely to report having trouble complet- At first glance, the City and County of
ing homework assignments, due to lack of Philadelphia in Pennsylvania would seem
access to a computer or a reliable broad- to have little in common with Palm Beach
band connection, compared to households County, located in southeastern Florida.
with annual incomes above $75,000. Nearly Each has a population of around 1.5 mil-
half of teens in low-income families say lion, but Philadelphia’s is squeezed into an
they sometimes do their homework on a
cell phone.
Pew also found that the homework gap
involves racial disparities. More than one
area one-sixteenth the size of its distant
neighbor on the tropical end of the Eastern
Seaboard. Philadelphia has twice the pov-
erty, two-thirds the median income, and
in five Black teens are forced to search significantly less sunshine.
out public Wi-Fi sources for connectivity. Scratch the surface, however, and
18 au Winter 2021 esri.com/arcuserFocus
Philadelphia and Palm Beach look more out of every 130 public school pupils in the based on location-specific data.
alike. Although Philadelphia is one of country lives in one of these two districts. Goldstein began her analysis by using
America’s poorest large cities, it contains geocoded student data to see where
pockets of high affluence. Although Palm Palm Beach Rises to the students lived. The data contained demo-
Beach County’s considerable wealth Challenge graphic information relating to each stu-
is mostly concentrated on the Atlantic Each district acquired 80,000 Chromebook dent, which could be displayed as layers
coast, in cities like Palm Beach and Boca computers, using a combination of phil- on a map showing where incomes were
Raton, poverty persists in several com- anthropic and public funds. To better lowest. She could also see who had already
munities sandwiched between the ocean understand which students most needed accessed the online student portal.
and the I-95 freeway. The poverty rate in computers and ensure those students Goldstein’s team was especially inter-
the Glades—the inland area near Lake and others had broadband access, the ested in students coded as eligible for
Okeechobee that includes the cities of two districts adopted similar data-driven subsidized school lunches, thinking these
Belle Glade, Pahokee, and South Bay—is approaches. students might be from families with lim-
higher than Philadelphia’s, and the median To assess needs, the Division of ited access to technology. Using GIS, she
income is much lower. Performance Accountability for Palm performed a point density analysis that
Philadelphia and Palm Beach also share Beach County schools sought the advice of displayed geographic clusters of families,
a civic quirk. Each county has consolidated Donna Goldstein, an IT manager with the which Goldstein then color-coded into
its schools into a single school district. Each district. Goldstein’s area of expertise is GIS, three levels of concentration.
district serves about 200,000 students. One software that analyzes people and places These clusters helped the county devise
Students who can no longer attend school in person, may not have access to a computer and the broadband connectivity needed for
remote learning at home.
esri.com/arcuser Winter 2021 au 19where to place Wi-Fi hotspots. These pole- geographically and had to look through problem was finding families in relatively
mounted transmitters broadcast Wi-Fi sig- raw databases, I don’t know how long it stable situations but with very limited in-
nals that nearby students can access with a would’ve taken, but it would’ve been an comes. “We have to make them realize
special receiver. extraordinarily long time.” what we offer them is free and that this isn’t
To refine the analysis, Goldstein added a rug that will be pulled out from under
more data layers, including municipali- Bridging the Digital Divide in them after a few weeks,” Wheeler said.
ties, census tract data, and the location the City of Brotherly Love To help organize efforts, Wheeler’s
of neighborhoods already earmarked for Meanwhile, a similar process was unfold- office tapped CityGeo, a dedicated team
community revitalization funds. She also ing in Philadelphia. A program called within OIT devoted to mapping and spatial
mapped housing subdivisions, since the PHLConnectED, a joint effort launched analysis. CityGeo was already using GIS
county would need to request easements by the OIT and the Mayor’s Office of to maintain a city stress index. This index
to install the receivers on private property. Education, was helping families obtain compiles geographic data on crime, home-
The map also helped the county plan computers and establish home Wi-Fi hot lessness, drug abuse, and other issues that
where to lay fiber to bring the signals to spots, while also making plans to establish would suggest the existence of students in
the Glades. To reach far-flung homes, of- community computing access centers. By need. The data helped PHLConnectED pri-
ficials used the map to pick buildings onto late October 2020, more than 11,000 public oritize the distribution of wireless routers to
which pole-mounted transmitters would school families were receiving free internet create mobile hot spots for students.
be placed. These buildings include schools, access thanks to the collaborative effort of “A lot of our work is focused not only
a church, a library, and an animal care and city government, the school district, and on mapping but on keeping data dynami-
control office. business and philanthropic leaders. cally up to date through the dashboard,”
“We combined all this data to give us a As in Palm Beach, the initial difficulty said Hank Garie, CityGeo’s geographic
really well-rounded view of what’s going PHLConnectED faced was how to identify information officer. “So whether it’s meal
on in the county, and where the greatest
areas of need were,” Goldstein said. “If
the team wasn’t able to work with the data
the families that needed the program the
most. Those experiencing housing insecu-
rity were hard to contact. An even bigger
sites or access centers, it’s all fed into the
GIS, which gives us a great way to visual-
ize and analyze where we might want to
target outreach programs based on need
or affordability.”
Schools, like this one in the Hunting Park neighborhood of Philadephia, have been closed
in response to the COVID-19 pandemic. Credit: Wikimedia Commons
Closing the Larger Gap Post-
COVID-19
The progress made around bridging the
homework gap in Philadelphia and Palm
Beach County has implications for broader
social equity issues. “As spin-offs from this
initiative, we’ve been able to do parallel
work with our Commerce Department,”
Garie said. “A lot of these same data-
sets are applicable, and we can even use
them to view the city’s budget through an
equity lens.”
Wheeler noted frequent references to
the stress index in city meetings “really
brings into stark relief that so much of this
is about where people live.”
“The work the CityGeo team has done
has really laid the groundwork for me, as a
CIO, to have conversations at the mayor’s
level about where populations we’re trying
to reach live, and how they’re aligned with
so many other critical problems we’re
trying to solve in the pandemic,” Wheeler
said.
Goldstein agreed. “For me, it goes
20 au Winter 2021 esri.com/arcuserFocus
beyond kids,” she said. “That’s our primary has focused on for some time. She works
focus, but now you’ve got parents and other with executives including state gover-
adults in the home who have broadband nors’ offices, the White House, and US
access, which opens up whole new worlds Congress. She uses her skills to bridge the
of possibilities for them economically.” gap between policy and technology and
She sees the effort as providing a small helps governments understand the value
silver lining during the crisis. “From my per- of geospatial data and GIS technology in
spective, this is one of the only good things promoting efficient, smart government.
to come out of the pandemic,” she added. In 2018, she was named a Top Woman in
“As educators, we’ve been fighting the digi- Tech by the public sector media company
tal divide for eons. So, this is really exciting.” StateScoop. She serves on the National
Visit Esri’s Racial Equity GIS Hub at Geospatial Advisory Committee, the
https://bit.ly/34YIwwd to view resources National Governors’ Association Smart
that help organizations address racial States Advisory Board and has served as
inequalities. chair of both the National Association of
State Chief Information Officers (NASCIO)
About the Author and the National States Geographic
Patricia Cummens is the director of gov- Information Council (NSGIC) corporate
ernment strategy and policy solutions at advisory councils. Prior to coming to Esri,
Esri. She provides guidance on state and she was the GIS director for the New Jersey
national government initiatives and emerg- Department of Environmental Protection
ing policy issues. The digital divide is an and served in a variety of roles for the State
aspect of social inequity that Cummens of Minnesota.
esri.com/arcuser Winter 2021 au 21A Growing Hunger
By Rebecca Lehman
GIS technology can help Feeding America food banks across the United
States by enabling these organizations to understand their constituents,
manage volunteers, and efficiently deliver services.
Feeding America operates a national Pandemic Brings New Challenges increased from one or two per week to 50
network of food banks that provide meals Since the pandemic, driving to food pan- or 60 per week.
to 46 million people each year. Each local tries has not an option for families without a That’s when Vanesa Mercado, opera-
chapter sources food and then stores and car, some elderly persons, or those who are tions manager for FARSB, mobilized the
distributes food to a network of local part- immunocompromised. FARSB needed to Homebound Emergency Relief Outreach
ner food pantries and soup kitchens. rapidly scale its home delivery program to (HERO) program. The program opera-
The COVID-19 pandemic has added to reach these vulnerable community mem- tionalized the food banks’ large network
the challenges faced by Feeding America bers. The requests for home delivery had of volunteers to find and deliver food to
food banks. The staggering increase in food
insecurity across the United States is being
The HERO program taps into the food banks’ large network of volunteers to deliver food
met by thousands of Feeding America’s to people who couldn’t drive to food pantries during the COVID-19 pandemic.
food banks. While the pandemic remains a
threat to safety and health, hunger is creep-
ing into many homes. For the first time,
many families are facing insecurity not only
in food but also in jobs and housing.
Food insecurity has a slew of deleterious
effects. It means that families can afford
fewer options at the grocery store, and
many of those options are less healthy.
Feeding America estimates that overall
one in nine people may face hunger.
The organization has been dealing with a
shifting landscape: food suppliers in limbo,
volunteer support scaled back, and a massive
increase in food support needs. Workflows
are continually evolving due to COVID-19,
and it is often challenging for food banks to
identify new solutions. Working with limited
in-person staff, as well as a huge increase in
food needs, has shifted organizational pri-
orities and limited resources.
A local organization, Feeding America
Riverside San Bernardino (FARSB), was hit
particularly hard by growing food inse-
curity. FARSB serves people in two large
counties in Southern California, Riverside
and San Bernardino. In 2019, FARSB served
18 million meals. Since the pandemic, it has
seen a 60 percent increase in food needs
across the community.
22 au Winter 2021 esri.com/arcuserYou can also read