ArcNews Briefl y Noted - Esri
←
→
Page content transcription
If your browser does not render page correctly, please read the page content below

ArcNews Esri | Winter 2021 | Vol. 43, No. 1
In an Unprecedented Year,
When it was deemed safe, thousands of masked
enumerators, equipped with iPhones, began knock-
Briefly US Completes Census Count
ing on doors. From a safe distance, they asked resi-
dents census questions and recorded their answers
Noted
digitally on their phones. The bureau continued to
with Help from GIS monitor the impacts of COVID-19 on operations
and adapted assignments as needed to keep every-
one safe.
“The modernizations that we put into place
Esri Acquisition Will Enhance Once per decade, the United States Census Bureau who did not respond to invitations. Initially, the far exceeded our expectations,” explained Deirdre
3D Visualization Capabilities sets out to count every person in the country, just once, Census Bureau scheduled NRFU operations to Dalpiaz Bishop, chief of the Census Bureau’s
Esri acquired Zibumi Yazılım and in the right place. The bureau spent 10 years pre- begin May 13, but the risk of infection delayed the Geography Division. “Geographic information
Bili im Tasarım Arge Sanayi paring for the 2020 Census by modernizing its systems launch. On July 16, the bureau resumed follow-up and associated technologies played a role in the
Ticaret S.A. (Zibumi), a and building apps. It has successfully replaced paper- operations in select areas. continued on page 5
software development based processes with new technologies that have sig-
company headquartered
nificantly improved data collection and workflows.
in Turkey and known as a
Throughout its preparation for the decennial
developer of innovative
event, the Census Bureau collaborated with Esri,
visualization, analysis, and
weaving geospatial capabilities into every opera-
simulation capabilities in
tional component. The bureau was ready to do the
leveraging game engines.
count, but unforeseen challenges lay ahead.
Zibumi will help advance 3D
By Census Day on April 1, 2020, most households
visualization and simulation
in Esri software and expand in the United States had received their invitation to
the ongoing integration of participate in the census. Unfortunately, by this time
game engine technologies the first wave of COVID-19 had swept across the na-
into ArcGIS. Esri also tion. While wreaking havoc on public and personal
announced the creation of health all over the world, COVID-19 also impacted
the Ankara R&D Center. 2020 Census operations.
The pandemic stalled the launch of the bureau’s The Response Outreach Area Mapper
(ROAM) app modeled areas that were
Esri Recognized for Its Work nonresponse follow-up (NRFU) operations, in
likely to have low self-response rates.
in Mapping COVID-19 which enumerators visit the addresses of people
Inc. magazine’s inaugural
Best in Business list has
awarded Esri the gold medal
Rapidly Processed Drone
Over the summer, two devastating wildfires in
in the Government Services
Northern California burned hundreds of thousands
category. These awards were
of acres, destroying thousands of structures and
Imagery Improves California
created to honor companies
endangering countless homes and lives. The North
that have gone above and
Complex Fire that burned in Butte and Plumas
beyond to make a positive
difference, tackling today’s
problems to lead to a better Wildfire Response Counties and the CZU August Lightning Complex
Fires in San Mateo and Santa Cruz Counties were
devastating wildfires that required a prompt and
future. “This year, more
than ever, our mission of organized emergency response from local teams.
helping our customers make To aid in response and damage assessment ef-
an impact through the use forts, law enforcement needed a better way to view
of GIS is critical,” said Jack these areas. That’s where drones came in. These
Dangermond, Esri founder unmanned aerial systems (UASs) are becoming an
and president. increasingly important part of disaster response.
They can help with a range of activities, from pro-
Enforcement of HTTPS Only viding emergency personnel with rapid situational
ArcGIS Online has been awareness to creating maps of impacted areas.
updated to enforce the Law enforcement working on these fires
HTTPS-only standard. tasked Esri partner and geospatial consulting
Customers with subscriptions firm GeoAcuity with obtaining aerial images of
still set to allow both HTTP the impacted areas by using drones. To furnish
and HTTPS must switch to multiple agencies and the public with the imag-
HTTPS only. See the ArcGIS ery they needed to conduct fire assessments and
Online Technical Support site
boost recovery efforts, the company deployed the
for instructions for updating
cloud-based drone mapping software Site Scan for
software for HTTPS only.
ArcGIS, along with ArcGIS Online.
GeoAcuity captured 360-degree panoramic views and aerial videos of the fire-caused devastation. continued on page 6
ArcNews
Esri | Winter 2021 | Vol. 43, No. 1 Share
Your Story
in ArcNews
Miami Beach, Florida, is one of the
most vulnerable areas for sea level
rise in the United States, if not the
world. The city has been working Tell readers around the world
with Esri partner Jacobs, a techni- how your organization saved
cal consulting engineering firm, to money and time or acquired new
find out where the biggest flooding capabilities through using GIS.
concerns are and determine how to
consolidate public works projects to esri.com/ansubmission
better prepare for sea level rise while Copyright © 2020 Esri. All rights reserved.
minimizing disruptions to residents.
Executive Editor
20 Monica Pratt
Managing Editor
Citabria Stevens
Graphic Designer
Table of Contents Takeshi Kanemura
Illustrator
Daniel Gill
NEWS
1 In an Unprecedented Year, US Completes Census Count with Help from GIS
1 Rapidly Processed Drone Imagery Improves California Wildfire Response
1 Briefly Noted Manage Your ArcNews Subscription
4 GIS Day Carries On, and Virtual Events Are a Hit To subscribe, unsubscribe, or make changes to
12 your Esri publications, please go to esri.com/
manage-subscriptions.
ESRI TECHNOLOGY
Outside the United States, please contact your
3 How Indoor GIS Can Help Workplaces Reopen Safely international distributor to subscribe, unsubscribe, or
change your address. For a directory of distributors,
10 Reports Give ArcGIS Online Administrators More Control visit esri.com/distributors.
11 Six Reasons ArcGIS Enterprise Users Should Get Started with
ArcGIS StoryMaps Article Submission Guidelines
Before writing an article, read and follow the
publication guidelines at esri.com/ansubmission.
YOUR WORK
ArcNews
8 Farmers in India Improve Crop Choices, Boost Income Using Esri
Spatial Analytics 380 New York Street
Redlands, CA 92373-8100 USA
12 In Finland, a Geospatial App Gives Transport Drivers the Information arcnews_editor@esri.com
16 They Need Tel.: 909-793-2853, ext. 1-2730
Website: esri.com/arcnews
14 ArcGIS Survey123 Streamlines Assessment of Sydney Light-Rail Service
18 GIS-Based Study of Water Scarcity in Peru Offers Replicable Model ArcNews (ISSN 1064-6108) is published
20 Facing Sea Level Rise, Miami Beach Uses GIS to Prioritize quarterly by Esri at 380 New York Street,
Mitigation Projects Redlands, CA 92373-8100 USA. ArcNews
is written for the Esri user community
27 Hub Site Gives Road Maintenance Projects More Transparency as well as others interested in mapping
32 In Northern Canada, Winter Timber Operations Go Digital and geographic information system (GIS)
technology. It contains material of interest
GIS PEOPLE to planners, foresters, scientists, cartogra-
16 Putting Indigenous Place-Names and Languages Back on Maps phers, geographers, engineers, business
professionals, and others who use spatial
22 Pulling Together When a Pandemic Pulls Our Lives Apart
information.
22 23 A Starting Point for Bridging the Digital Divide
24 How GIS Students at One University Got Much-Needed Equipment
26 Problem Solver Leads Pandemic Response by the State of Maryland
31 Patterns of Resistance to Technological Change and How to
Advertise
Transcend Them
34 Stay the Course, and Seize the Moment
35 A Busy Event Season for the Esri Science Team
in ArcNews
COLLABORATIONS
28 Esri Partners Attend to Immediate Needs and Get Long-Term Results Reach more than 800,000
potential customers.
30 Land Management Gets a New Look with Mobile Map Annotation App
32 36 Esri Press Reserve space in the longest-
37 The Business Case for People-Focused Change Management running GIS magazine.
38 New Training and Certification Offerings
ads@esri.com
Copyright © 2020 Esri. All rights reserved.
2 ArcNews Winter 2021 esri.com/arcnews
How Indoor GIS Can Help
Workplaces Reopen Safely
Around the world, the COVID-19 pandemic Since the initial outbreak, however, cities,
caught most organizations off guard as counties, states, and countries around the
it suddenly—and enduringly—upended world have entered various stages of re-
work culture. For businesses that can sup- covery, compelling organizations to look at
port their employees working from home, a what it would take to bring their workforces
remote workforce has become the new nor- back. The priority is to create a safe commu-
mal. But bringing employees back into the nal working environment that employees Employees can use ArcGIS Indoors to book office hotels, which are individual workstations that
workplace is a big challenge—one that em- feel comfortable returning to, which entails can be used for a certain amount of time.
ployers must prepare for now if they haven’t honoring social distancing requirements by
started doing so already. reducing indoor capacity and regularly sani-
Indoor spaces, as we came to find out, tizing frequently touched areas.
pose a greater risk of spreading COVID-19 With Indoors, it’s possible to use GIS to
than the outdoors. So hospitals, manufactur- do this responsibly and accurately. The soft-
ing facilities, retail businesses, logistics facili- ware allows users to aggregate, visualize,
ties, and other organizations that either could and analyze indoor spatial data on 2D and
not let their employees work from home 3D maps, apps, and dashboards, creating
or brought their employees back early on a new level of transparency when it comes
needed effective ways to implement safety to facility operations. For example, opera-
measures fast. Now, other businesses that tions managers can employ Space Planner,
are planning to reopen require the same a browser-based app, to better understand
measures. Even organizations that are offer- employee seating arrangements. They can
ing an ongoing hybrid model, wherein em- see where there are social distancing con-
ployees work from the office sometimes and flicts, such as desks that are grouped too
home the rest of the time, need to visualize closely together, and reorganize people’s Using Space Planner, operations managers can easily visualize social distancing conflicts (in red).
things like how to more efficiently use their work spaces to ensure compliance with
real estate. safety regulations. Space Planner also al-
Fortunately, ArcGIS Indoors, Esri’s indoor lows analysts to model various social dis- and submit a ticket. Once the ticket is sub- more the norm, ArcGIS Indoors can help
mapping and location tracking software, is tancing parameters so they can visualize mitted, cleaning staff receive a notification businesses gain insight into current space
uniquely suited to help with all this. areas of concern and map out safe seating telling them exactly what and where the usage and evaluate what they’ll need in the
assignments. problem is, and then they can use Indoors to future. Not only does this reduce costs, but
Redesigning Communal Spaces Indoors enables users to publish space navigate directly to the area of concern. it can also increase employee happiness,
When news of the rapid spread of COVID-19 plan changes immediately via its native mo- help organizations differentiate themselves
first started making waves in March 2020, bile app and web-based viewer. Having up- Leveraging Unused Areas for New Uses from the competition, and better prepare
Esri’s facility mapping software, which lever- to-date indoor maps of office buildings and Another key way that organizations can businesses for other potential challenges.
ages Indoors, enabled employers to use other work spaces makes it easier for em- employ Indoors is to build resilience into For instance, after the pandemic, every
indoor spatial data to better understand ployees to interact confidently with their new their operations. As the pandemic has employee may not need a personal work
their facility operations, steer staff mem- workplace arrangements. They can use the revealed, even successful businesses ex- space on every workday. Organizations could
bers toward useful resources, apply contact mobile app and viewer to reserve conference perience severe disruptions if they lack turn unoccupied spaces into office hotels—
tracing, and comply with safety measures to rooms and navigate to meetings, assets, measures to ensure business continuity— individual workstations that employees can
combat contagion. But a large part of the amenities, and other points of interest. especially when physical spaces and orga- book for a certain amount of time. With
workforce went remote anyway, with more Building occupants can also use Indoors to nizational operations have to be adjusted office hotels, users could build a list of work
than 42 percent of employees in the United report facility issues—for example areas that at breakneck speed. space criteria in the Indoors app and viewer.
States alone working from home full-time need cleaning. In the mobile app or viewer, With lots of employees working from Employees could choose from those ame-
as of the end of June, according to a study all they need to do is mark the space on a home now and some organizations consid- nities when booking an office hotel. What’s
out of Stanford University. map, upload a photo (though that’s optional), ering making flexible work arrangements more, Indoors allows facilities managers to
keep track of office hotel reservations so
these spaces can be sanitized after use by
employees.
Digitizing Facilities Management
The COVID-19 pandemic has revealed that
having a sophisticated digital workplace
operations system in place makes it easier
to enhance facility safety and respond
to unexpected events and disasters. By
employing ArcGIS Indoors to reenvision
indoor spaces and make adjustments to
how real estate is managed, organizations
across a range of industries—from govern-
ment agencies and nonprofits to private
businesses large and small—can increase
employees’ awareness of their surround-
ings and provide a much clearer common
operating picture to those who manage fa-
cilities. Isn’t that something we could all use
when things seem so uncertain?
For more information on Indoors or to
get in touch with an Esri representative,
head to go.esri.com/indoors.
Space Planner allows analysts to assign employees to new workplaces.
esri.com/arcnews ArcNews Winter 2021 3
Community Forestry led attendees through a demonstration and
discussion of its critical forest work. And the Udzungwa Ecological
Monitoring Centre in Tanzania taught other GIS Day participants
about tropical biodiversity through its GIS Day event.
“You just can’t stop the enthusiasm and quest to share GIS knowl-
Carries On, edge, even during a pandemic,” said Maria Jordan, Esri’s product mar-
keter for ArcGIS Hub. “Whether celebrating as part of a city, county,
university, or private business, GIS Day hosts stepped their creativity
and Virtual Events Are a Hit up a notch this year to plan virtual events, record YouTube videos,
and broadcast radio show programs to reach their audiences.”
In addition to these events hosted around the world, the GIS
In spite of all the changes the world has experienced over the past year, GIS in community and technical colleges, organized six hours Day website served up some new, on-demand content to help
one thing has remained steady: GIS is making a difference in so many of events—in both English and Spanish—that included talks, everyone celebrate the technology from the comfort of their
of the things we do, from managing resources during the COVID-19 geogames, mapping activities, and a map contest and gallery. own home. Videos, articles, and podcasts posted on the website
pandemic and building smarter, more sustainable cities to conserv- • At the University of Salzburg in Austria, the geoinformatics pro- spotlighted GIS influencers who are using the technology to do
ing wildlife habitats and responding to natural disasters. Some might gram held a GIS Day event to teach people what the technology important work such as building inclusive workforces, designing
even argue that GIS is more important now than ever, given how is and why it matters. Part of the fun for attendees was exploring landscapes with climate change in mind, and responding to devas-
COVID-19 has raised awareness around the globe of how important the nine most beautiful hidden places in Austria, using maps tating wildfires. Esri also released a new GIS Day mobile app, avail-
geospatial technology is for problem solving and decision-making. and map narratives built with ArcGIS StoryMaps. able for download from the Google Play and Apple App Store, that
GIS Day was officially commemorated on November 18, The hosts of each of the events listed above used ArcGIS Hub to was designed to help GIS professionals share the technology with
2020. Celebrations were not only extra cautious, they were also organize and present their GIS Day content, which was a new and colleagues, students, and community members through games
extra special. Most events were held online, allowing people from innovative aspect of the 2020 celebrations. This gave them one, and map exploration activities. The idea was to let people experi-
all over the world to attend presentations, workshops, interactive comprehensive online space in which to engage and collaborate ence GIS using their own personal devices.
meetups, and other virtual functions hosted by government agen- with their communities and serve their unique audiences. Each host that registered an event on the GIS Day website re-
cies, libraries, schools, universities, nonprofit organizations, and GIS enthusiasts registered more than 1,200 additional events ceived five ArcGIS for Personal Use licenses. The hosts had full
private companies. Events included the following: at gisday.com, officially putting their functions on the GIS Day discretion over how to distribute the licenses. Some held con-
• Central Connecticut State University and the Connecticut GIS map. Most of these were open to the public. tests and lotteries, others gave them out at networking activities,
Network hosted a GIS Day event in which GIS practitioners Geospatial Libya Consulting in Misratah, Libya, for example, and still others doled them out as gifts to presenters or as dona-
from a range of professions presented their work to attendees. held a discussion on spatial data infrastructure. The School of tions to nonprofits. The point was to help hosts further the use of
Other participants submitted map posters, ArcGIS StoryMaps Geography at the University of Costa Rica demonstrated what GIS within their communities beyond GIS Day.
apps, and other geospatial apps to a gallery. The university also faculty and students are doing with GIS in their instruction and Around the world, people use GIS Day as a way to help others dis-
held a rousing game of GeoJeopardy. research. Government agency Land Information New Zealand cover GIS, share their accomplishments, and inspire their peers with
• The National Geospatial Technology Center of Excellence sponsored a virtual, three-day field trip that showed students the infinite ways that geospatial technology can be used. The next
(GeoTech Center), which promotes the use and teaching of how to use maps to safely hike the outdoors. The Federation of GIS Day will be November 17, 2021, so don’t forget to join in!
GIS enthusiasts registered more than 1,200 events on the Several organizations used ArcGIS Hub to organize their The GIS Day website served up videos, articles, and podcasts that
GIS Day website. GIS Day events. spotlighted GIS heroes and influencers.
Beyond Location Intelligence
Get GIS News, Plan | Develop | Deploy
Views, and
Insights from
ArcWatch
Current and future mapmakers and
geospatial app makers can have
the latest stories, tech tips, training
information, and product news
delivered straight to their in-boxes.
Unleash the Power of
go.esri.com/subscribe
Esri GIS for Public Safety
www.safecitygis.com
Copyright © 2020 Esri. All rights reserved.
4 ArcNews Winter 2021 esri.com/arcnews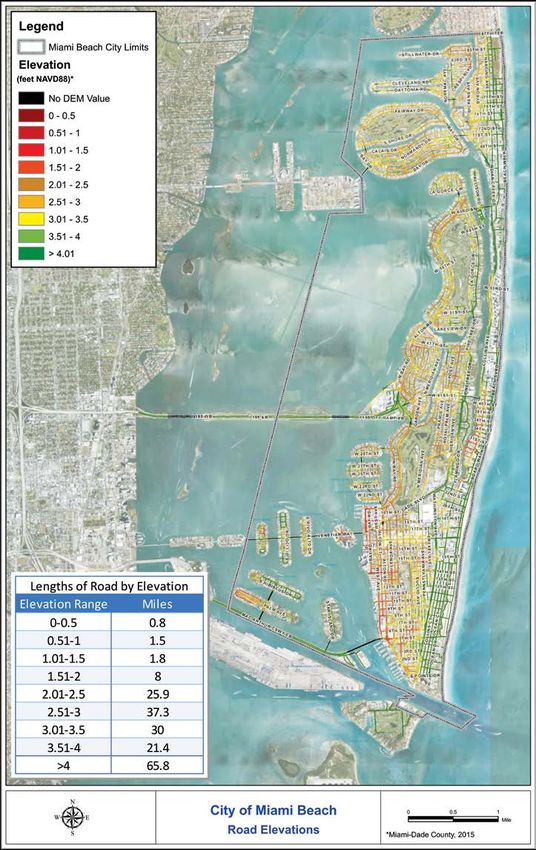
continued from cover
                                  In an Unprecedented Year, US Completes Census Count with Help from GIS
transformation of the four main components of conducting                bureau’s largest geospatial quality control ef-
the census.”                                                            fort. GARP brings together and reconciles data
   Those components for the 2020 Census are                             from many geographic operations, such as a
• Establishing where to count.                                          statistical areas program, voting operations,
• Motivating people to respond.                                         and ZIP code operations. The bureau also de-
• Counting the population.                                              veloped an operational dashboard to manage
• Tabulating and disseminating the results.                             GARP processes to ensure that 14.1 million
   Since each component is geography based, the Census Bureau           unique geographic borders aligned.
deployed GIS apps, which used Esri technology, to streamline               “Without the dashboard, we may not
every aspect of the count. That made a huge difference in this          have successfully completed the process
strange and atypical time.                                              according to schedule,” said Bishop.
                                                                                                                            A map viewer showed, in green, where
                                                                                                                            census block addresses had been
Validating Addresses—Mostly Digitally                                   New Techniques to                                   validated and, in pink, where they had not.
Well before census operations begin, the Census Bureau updates a        Encourage People to Respond
national address list. An accurate address list is fundamental to the   Getting people to self-respond to the census reaps the greatest           In addition, the bureau employed ArcGIS Network Analyst and
operational success of the census count. It is essential for mailing    results. The Response Outreach Area Mapper (ROAM) app, built            ArcGIS StreetMap Premium to help optimize the workload for
invitations and for follow-up efforts. By employing satellite imagery   with Esri software, streamlined this process.                           NRFU operations and send enumerators on the most efficient
and GIS—and having people walk around certain hard-to-identify             Using data from the Census Bureau’s American Community               routes possible.
areas to verify addresses—staff members built a highly accurate list    Survey and the 2010 Census, the bureau modeled areas that were            “We have a very strong working relationship with Esri,” said
for the 2020 Census.                                                    likely to have low self-response rates. The results were displayed on   Bishop. “We’re continuously collaborating as we enhance the
   Using the Block Assessment, Research and Classification              a color-coded range map, so community groups knew where best to         tools we use to get our job done.”
Application (BARCA), which was developed with ArcGIS API                target education resources and outreach. Although COVID-19 made
for JavaScript and leveraged map and imagery services served in         it difficult to do community outreach at the levels that the bureau       Delivering Results
ArcGIS Enterprise, 150 staff members reviewed 11.1 million cen-         had hoped for, ROAM performed well and will be used to help man-        The final task for the Census Bureau is to ensure that all responses
sus blocks. While working in the office, they were able to validate       age outreach during the Census Bureau’s ongoing survey work.            are associated with their correct geographic locations in the
65 percent of the nation’s addresses.                                                                                                           National Address List. The bureau is (as of press time) working to
   The validated areas were displayed on a map viewer, as were          Making a Massive Follow-Up Operation More Efficient                     complete this task and fulfill its mission to count every person,
areas that required in-field validation. The Census Bureau shared       During the peak of its follow-up operations, the Census                 just once, and in the right place.
the map viewer with the public to help people understand which          Bureau had nearly 240,000 enumerators collecting informa-
areas census employees would be visiting.                               tion. To manage this massive undertaking, the bureau used its
                                                                        Field Operational Control System (FOCS), which securely em-                 In addition to completing the 2020 Census, the Census
   “In 2010, address validation operations involved 150,000 par-
                                                                                                                                                    Bureau wanted to help businesses and decision-
ticipants, but 10 years later, modernizations—including geospa-         ployed vector tile and dynamic map services hosted in ArcGIS
                                                                                                                                                    makers understand the social and economic impacts
tial technology—enabled us to reduce our address validation             Enterprise, to plan out the workload. Managers used FOCS to as-
                                                                                                                                                    of COVID-19. Working with Esri, the bureau launched
workforce to 32,000,” noted Bishop.                                     sign enumerators to certain geographic locations.
                                                                                                                                                    the COVID-19 Demographic and Economic Resources
   States use the decennial census to define congressional districts,      FOCS maps also let managers see where operations were on track           page, available at covid19.census.gov. This provides
state legislative districts, and voting districts, so those boundar-    and where they needed to boost the number of resources. They                easy access to census data as it relates to the pandemic,
ies must align with census block boundaries. The Census Bureau’s        could use the system’s proximity function as well to ensure that enu-       and the data ranges from state to local levels.
Geographic Area Reconciliation Program (GARP) manages this—the          merators got assignments that were close to their homes.

     CREATE A GIS STRATEGIC PLAN
      Our expert team will plan, design, and guarantee
      support and funding for your GIS.

      Learn more at GISPlan.com

                                        Beyond Location Intelligence

     Certified GIS Plan ¤ Needs Assessment ¤ System Design ¤ Governance ¤ GIS Software ¤ Data ¤ IT Architecture ¤ Workflow ¤ Interoperability ¤ Training

esri.com/arcnews                                                                                                                                                                    ArcNews Winter 2021           5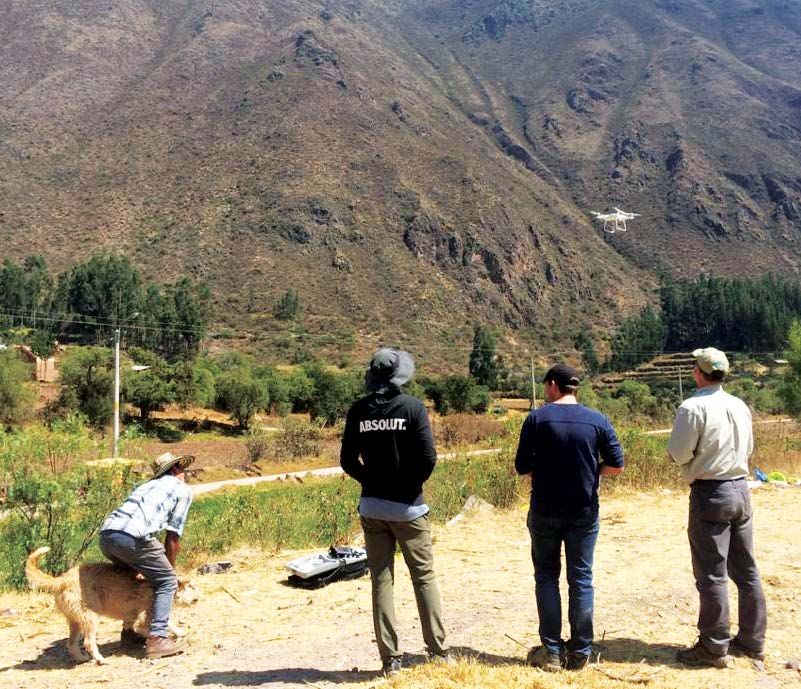
continued from cover
Rapidly Processed Drone Imagery Improves California Wildfire Response
“We can show up on-site; throw geospatial data with various emergency response teams. So it “To be able to pull photos over into ArcGIS Online and just refer-
up a UAS; and within an hour of chose Site Scan to collect, process, and analyze drone imagery, and ence [them] to our maps was huge,” Knowles added. “That connec-
the flight, have images rapidly ArcGIS Online to plan flights and, ultimately, disseminate relevant tivity and interoperability save massive amounts of time.”
processed and into the hands of information to those involved in fighting the fires. GeoAcuity collected imagery of the burn areas and stitched
the people who need [them] most,” “Our goal [was] also to be able to share the data as broadly as that into accurate 2D orthomosaics. It also captured 360-degree
said Jason Knowles, CEO and possible to as many stakeholders as possible…in a way that all panoramic views and aerial videos of the fire areas.
founder of GeoAcuity. “The abil- the agencies [would] understand,” said Crutsinger. For the North Complex Fire, GeoAcuity and the Butte County
ity to have current and accurate Sheriff ’s Office published high-resolution postfire UAS imagery
geospatial information is key to Tried-and-Trusted Technology Speeds Things Up of about 2,500 acres as 312 individual panoramas and shared
assisting first responders.” GeoAcuity staff members have been Esri users for more than them through three public-facing web maps. Deliverables for the
20 years, so they are familiar with and confident in how Esri CZU August Lightning Complex Fires included high-resolution
A New Way to products work. postfire UAS imagery of 6,000 acres as 650 individual panoramas,
Capture, Process, and “We can build up [new maps and information products] quickly. shared using two public-facing web maps.
Share Drone Imagery We’re functional in the [Esri] environment,” said Knowles.
Using Site Scan for Responding to a raging wildfire The first thing the GeoAcuity team did was establish a work- Myriad Stakeholders Benefit from
ArcGIS, along with ArcGIS
requires proper planning and ef- flow for capturing data in the field and efficiently communicat- Rapidly Processed Imagery
Online, GeoAcuity was
able to deliver complete ficient management. To make ing it back to the office. For mission planning, the team gave all Law enforcement agencies, emergency response teams, and
imagery products within drones a useful part of this pro- the drone pilots access to ArcGIS Online to view flight plans and civilians all reaped benefits from GeoAcuity’s efficient collection
24 to 48 hours of beginning
cess, the team at GeoAcuity need- the status of their data capture assignments via their smart- and dissemination of geospatially linked drone imagery.
drone data collection.
ed to first define the areas where phones or tablets. The pilots were also able to use this setup to Crucially, GeoAcuity was able to deliver enhanced situ-
imagery had to be captured and then, once the flights were done, get instructions on exactly where to fly. ational awareness to first responders. More than 30 sheriff ’s
manage the imagery data and metadata that would be uploaded Next, the team used Site Scan to ingest the captured imagery offices across five counties said they were very impressed with
to the cloud for processing. and integrate it into the cloud-based postmission support system. the value that the digital, imagery-based maps brought to their
This was not how things have always been done, though. In Site Scan allowed the group to process the or-
past attempts to use drones to capture wildfire imagery, re- thoimagery faster than ever before and publish
sponse teams defined areas for imagery capture using paper it directly to ArcGIS Online. Team members
maps; masking tape; and, in at least one case, a yellow crayon. then used other Esri products, such as ArcGIS
Unsurprisingly, this wasn’t the most efficient method for gather- Dashboards and ArcGIS Web AppBuilder, to
ing drone imagery or communicating plans with multiple groups create dashboards and apps to monitor the
and agencies during an emergency situation. project’s status and visualize the resultant data.
“There are certainly physical challenges during a wildfire with According to Crutsinger, GeoAcuity was
smoke and visibility, falling trees and power lines, heat, and not “processing hundreds of gigabytes [of data] a
[being able to work] together during a global pandemic,” said Greg day and making it public the following day,”
Crutsinger, director of applied research at GeoAcuity, referring delivering completed imagery products with-
to the COVID-19 pandemic that was also spreading while these in 24 to 48 hours of the drones taking off.
fires burned. “Those are enough to try to tackle without worrying
about what you are going to do with all this imagery.”
GeoAcuity’s new workflow made it easier to
GeoAcuity wanted a new solution that would make it possible plan where to fly, divide up the drone teams,
to easily define, capture, and process imagery and then share the and then send them out to capture data.
6 ArcNews Winter 2021 esri.com/arcnews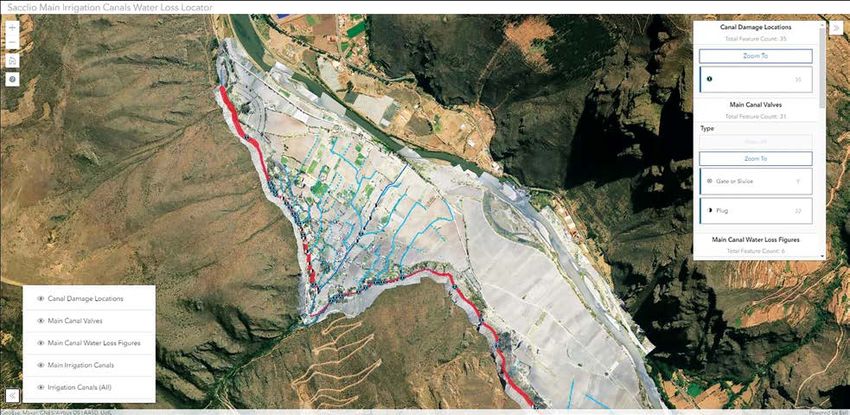
organizations. This helped all the groups involved in fire response time. And various agencies and insurance companies have been Dashboards and Web AppBuilder, has given GeoAcuity a full,
and recovery work together. using the imagery to work together to repopulate areas impacted end-to-end workflow that shapes its strategy, planning, and op-
“The efficacy and timeliness of the imagery…[enhance] situ- by the fires. erational logistics.
ational awareness when [people] physically cannot get to the di- “I’ve had insurance companies tell me they didn’t need to send “We can now preplan an area [to fly], divide up drone teams,
saster area,” said Knowles. “It provides a record of the disaster… a team out [to review a site or claim] because the imagery was send them out to capture the data, track all of the SD cards [with
and helps decision-makers prioritize where to send help and fo- good enough,” said Crutsinger. the raw drone imagery on them] as they come in, process all the
cus rebuilding efforts.” GeoAcuity can also incorporate other GIS data layers, such as imagery, integrate the layers into web maps, and then release
According to GeoAcuity, its web apps have been viewed more property boundaries and topography, to make the imagery more those to the agencies and the public,” said Crutsinger.
than 90,000 times—and not just by emergency responders. Residents powerful and deliver information in a standard format that all Employing this integrated workflow, rather than separate
of the area used the free, public-facing resources—including maps stakeholders can use. Additionally, using Site Scan to process the tools, for everything from mission planning to stitching together
with panoramic views and before-and-after swipe maps—to view imagery enabled the GeoAcuity team to rapidly put the images the imagery, undoubtedly helped streamline response and re-
their homes online and begin to assess possible damages. into an easy-to-consume interactive web map and other apps. covery efforts for the North Complex and CZU August Lightning
“[The number of views] indicates to me a significant value add “It’s our job as the subject matter experts to make the end Complex Fires.
to the community and first responders,” said Knowles. “Residents product as elegant and visually compelling [as possible] to tell the “The less time we spend doing debriefings and planning out
can check on their houses when the fire areas are still closed off story of the disaster. That’s what Esri’s products were built for,” the missions, the more time we have to collect data, and the
to the public. We have citizens use the data to help with insur- said Crutsinger. “Stakeholders are always amazed at what is pro- more impactful the response will be,” said Knowles. “[The] human
ance claims, as well as to support GoFundMe pages using the duced so quickly.” impact and devastation [are tough], but it is rewarding [work] be-
pre- and postsite imagery.” cause we see how the data we collect and deliver can help make
GeoAcuity’s efforts have also given affected counties a historical An Integrated Workflow Streamlines Response and Recovery a big difference.”
record of high-resolution imagery that they can reference over Using Site Scan and other ArcGIS technology, including
For the North Complex Fire,
312 individual panoramic images
of the burn area were published.
GeoAcuity provided law enforcement agencies with the
imagery-derived maps they needed to respond to the fires and
begin recovery efforts.
Master demographic analysis
tools and techniques—online
As a student in our 12-credit Graduate Certificate or 30-credit Master of Professional Studies in
Applied Demography program, you can explore:
› geospatial data and methods in diverse applied settings
› principles of demography and measurement of population dynamics
ss
/s
› the application of demographic tools in marketing, planning, public policy, and research
jh
/b
369
0
› the integration of theory, data, and methods in project development utilizing applied demographics -W
C-
21
A world of possibilities. Online.
worldcampus.psu.edu/adesri
esri.com/arcnews ArcNews Winter 2021 7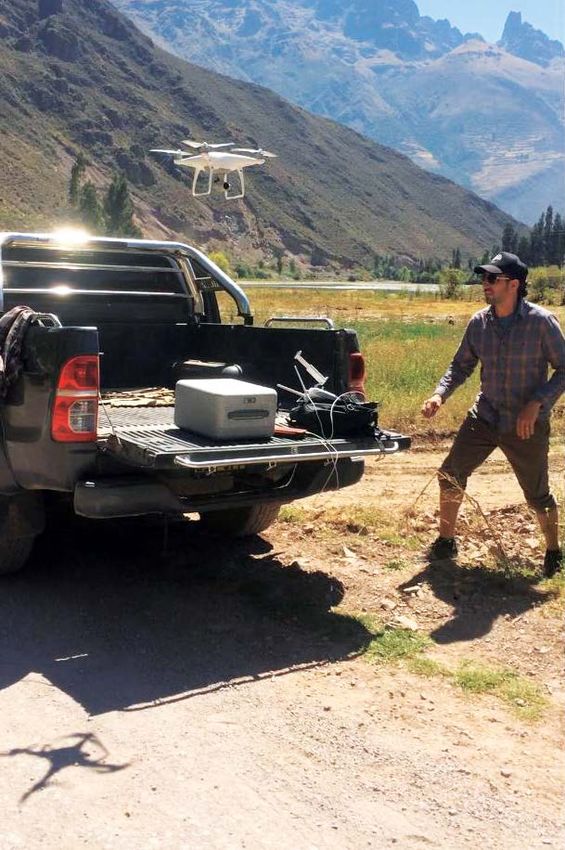
Farmers in India Improve Crop Choices,
Boost Income Using Spatial Analytics
By Mukund Kadursrinivas Rao, Centre for Spatial Analytics and Advanced GIS
Over the past 40 years, GIS and remote sensing spatial and nonspatial datasets, the app does a Remote Sensing (IRS) satellites. Also, daily weath- Additionally, every crop season—which, in
have gained wide popularity in India, mostly in the holistic assessment of individual farms, getting er forecasts are assembled from different weather South Odisha, is split mainly into kharif (June
government sector. What has been lacking, how- at all the direct and indirect variables involved in services, and GIS maps come from various GIS through November or December) and rabi
ever, is the use of spatial analytics at the individual agriculture rather than focusing strictly on land, data services and internal mapping. All this—and (January through April or May)—the data is up-
level. But a new app, called Agri-GIS, is beginning soil, and water information. From there, Agri-GIS more—needs to be brought together and analyzed dated in Agri-GIS in real time. This means that
to bridge that gap in the farming community. generates straightforward, personalized messag- so the app can issue advisories that include 15-day, the app can take all the data it has ever acquired
In South Odisha, India, farmers, who mostly ing that helps farmers get the most out of their village-level forecasts of rainfall, temperature, and and consistently modify it to apply specifically
own small landholdings, are now using Agri-GIS efforts, thereby boosting their quality of life. humidity; crop recommendations; suggestions to each of the 532 villages and 150,000 farmers
to make better decisions about their agricul- for best practices; and income estimates. The app in the region.
tural operations. Starting in June 2018, 150,000 Data Distilled to the Hyperlocal Level relies on cadastral records to divvy up land units Another way Agri-GIS creatively applies
farmers in 532 villages began receiving Agri-GIS A big part of what makes Agri-GIS work is that into individual plots. Data for each plot includes the spatial analytics capabilities in ArcGIS is
advisories that are customized to their plots it is innovatively built on advanced ArcGIS ownership details and household survey data that in reducing complex datasets to simple ad-
of land. The advisories, which are transmit- capabilities. contains information about each family’s demo- visories that are applicable at the hyperlocal
ted as simple text messages or phone calls, or For one, distilling multiple layers of images, graphic makeup, education, social standing, and level. Employing ArcGIS Spatial Analyst,
via a smartphone app, include daily weather maps, and other spatial data at the individual plot work status. Each plot's data also provides GIS ModelBuilder, ArcGIS 3D Analyst, ArcGIS Image
forecasts, satellite imagery-based real-time level requires tremendous skill in spatial data en- maps showing soils, land use, and groundwater Analyst, ArcPy, ArcGIS Geostatistical Analyst,
crop and water assessments, crop suitability gineering and data analytics. The geodatabases in potential and data on agricultural facilities, mar- and machine learning and artificial intelli-
recommendations based on soil types, market ArcGIS Enterprise, plus the software’s advanced kets, and financing opportunities. These datasets gence (AI) tools, such as R, Python, and ten-
and price analytics, details about agricultural analytics tools, give Agri-GIS that power. are coregistered in a geodatabase that consists of sors, Agri-GIS performs a profusion of analyses
facilities and government programs, and alerts For example, the imagery the app uses to gener- 104 parameters, making it possible to disaggregate to generate insights about individual plots of
for episodic events such as cyclones. With this, ate crop status details and land and water informa- everything so it applies to each plot or cadastre land or even a village as a whole. In turn, this
farmers can better figure out which crops work tion comes from different satellite constellations, unit and then spatially analyze that to generate becomes part of the intelligence that Agri-GIS
for their land, how to optimize their crop pro- including Sentinel-2, Landsat, Planet, and Indian advisories for each farmer. employs to do future analysis.
duction, best practices for farming, and how to
maximize their incomes.
But the unique aspect of Agri-GIS is how
it puts the farmer at the center of its analyt-
ics. Agri-GIS considers each farmer a virtual
economic unit that generates a certain level
of sustained economic activity for their family.
The app does a 360-degree evaluation of the
farmer: their land; social and family character-
istics; current and aspirational economic status;
noncropping activities such as poultry farming,
animal husbandry, beekeeping, and farm labor;
and earnings from other endeavors, including
dairy and poultry farming or participation in
labor trades.
All this is made possible by Agri-GIS’s disaggre-
gated approach to spatial analytics. Using various
Dashboards show the impacts
the advisories are having on farmers
throughout South Odisha.
8 ArcNews Winter 2021 esri.com/arcnews
that provides detailed advisory information and
other GIS functions, such as crop suitability anal-
C-SAG developed Agri-GIS with
yses and seasonable crop maps, that they can use
support from Tata Trusts and the Bill
to make high-level decisions.
& Melinda Gates Foundation’s India
Office, as well as in association with
Farmers Feel the Effects
the State of Odisha’s Department
In 2019, C-SAG began to assess whether the ad-
of Agriculture and Farmers’
visories were actually getting farmers to heed
Empowerment. The advisories available
crop recommendations, adopt more scientific
through Agri-GIS were designed with
agricultural practices, increase their yields, earn
guidance from the Odisha University of
larger incomes, and experience any other so-
Agriculture and Technology and various
cial advancements. Using ArcGIS Dashboards,
agricultural experts.
C-SAG developed the Agri-GIS Dashboard to
track, in real time, advisory dissemination along-
side farmer feedback.
For the 2020 kharif season, C-SAG released own plots of land (the rest are government
four formal crop-stage advisories: a pre-sow- owned), the cumulative income for farmers in
ing advisory on June 2, a tillering advisory on South Odisha is likely to increase from 1.38 bil-
August 19, a plant emergence advisory on lion Indian rupees (US$18.6 million) in 2019 to
September 21, and a flowering advisory on 2.31 billion Indian rupees (US$31 million) in 2020.
October 19. Based on a sample of 8,804 farmers, C-SAG plans on continuing the assessment
Agri-GIS advisories are typically transmitted as Farmers can use Crop Mapper to update
as of November 2, C-SAG had recorded the fol- through the next two years to make Agri-GIS
simple text messages or via phone calls, but their crop data and send in feedback from
farmers can also access them in a smartphone app. the field. lowing impacts: a more robust product for farmers and, more
• Forty percent of farmers adopted crop rec- broadly, bring spatial analytics solidly into
ommendations from Agri-GIS. India’s agricultural spheres.
Indexing analytics, for example, determines up-to-date advisories that farmers receive on a • Ninety-eight percent of farmers rated the vil-
a farmer’s social and economic status, which daily basis. lage weather advisory as uniquely relevant, App Charts Two New Courses
helps customize the advisories. High-end im- Finally, the Centre for Spatial Analytics and meaning they adjusted their activities ac- Looking ahead, C-SAG is planning to take
age analytics supplies weekly water and crop Advanced GIS (C-SAG) has developed 16 dif- cording to the advisories. Agri-GIS in two new directions. First, it will work
status reports at the plot and/or village level. ferent apps that farmers, local researchers, and • Eighty-four percent of farmers embraced the with state governments in India to start imple-
Advanced meteorological analytics reduces government officials have access to. Built with agricultural practices recommended by Agri- menting Agri-GIS as a public good for small and
gridded weather forecasts to the village level—a ArcGIS Enterprise, ArcGIS Survey123, ArcGIS GIS and sought additional details about them. marginal farmers in rural areas. Second, it will
first for this area. Suitability analyses determine Collector, and native web app builders, each app • Seventy-eight percent of farmers concurred promote Agri-GIS to farmer cooperatives and
the optimal crops for each plot of land, based on serves different Agri-GIS requirements. For in- that their incomes would likely increase to large agricultural businesses as a pioneering way
its own soil, climate, and social conditions, and stance, farmers can use the Soil Sample Analysis the levels Agri-GIS indicated. to support the agricultural supply chain in India.
comes up with best practices for crops for every app, the Facilities Mapper app, the Crop Mapper In a separate assessment, C-SAG determined To find out more about C-SAG and Agri-GIS,
stage of the farming season. Beneficiary analyt- app, and various dashboards to not only see their that in the 2020 kharif season, the incomes of take a look at the "International Workshop on
ics determines what benefits, such as income customized advisories but also update criti- the 8,804 farmers who participated in this sur- Advanced Spatial Analytics and Deep Learning
or assets, a farmer can expect to receive. And cal crop data and send feedback from the field. vey would increase by up to 60 percent against for Geospatial Applications," presented by C-SAG
market analyses recommend the best pricing at Additionally, government officials and agricul- their 2019 incomes. Projecting that out to the in January 2020. Video recordings from the event
different markets. All this is then integrated into tural experts have access to an Agri-GIS portal remaining 110,000 farmers who have their can be found at ow.ly/emnz50CqNpN.
About the Author
Mukund Kadursrinivas Rao is chief
executive of C-SAG, which is
established under India’s National
Institute of Advanced Studies (NIAS)
Council of Management. Rao has
a PhD in remote sensing and GIS
and was the first president of the
Global Spatial Data Infrastructure
(GSDI) Association. He has more than
40 years of experience that includes
working with India’s national space
agency, leading several GIS-based
businesses, conceptualizing India’s
national spatial data infrastructure
and national GIS programs, and
defining robust remote sensing and
GIS standards and policies. He can be
reached at mukund@csag.res.in.
Government officials and agricultural experts use an Agri-GIS portal to see where plot advisories are being sent, as well as the details of the advisories.
esri.com/arcnews ArcNews Winter 2021 9
Reports Give
Organization Status Reports items and groups, and last login date. With this report, ad-
Administrators can generate four types of asynchronous re- ministrators can query the status of members, monitor them,
ports on their organization’s members, content, credits, and and determine if they should be removed from the organiza-
ArcGIS Online items. The activity, credit, member, and item reports are gen-
erated on the status tab within the organization overview
page. The reports are saved as administrative report items in
tional account.
The item report includes a comprehensive list of items in
the organization and the attributes of each item: type, share
Administrators the ArcGIS Online organization that can be downloaded as
comma-separated values (CSV) files for additional analysis.
The activity report lists all events within a specified day,
level, file size or feature storage size, owner, view count,
and date modified. With this report, administrators can un-
derstand what their members are creating and storing and
More Control week, or month. Events are the changes made to an orga-
nization’s members, groups, credit allocations, and content.
With this report, administrators can see everything that is
quickly identify popular items or items that need to be up-
dated or removed.
going on within their organizations. Organization Overview Page
Among many enhancements in the December
The credit report provides a detailed breakdown of week- The organization overview page provides administrators with
update of ArcGIS Online are a series of ly or monthly credit usage per member. The rows display a quick reference to key information including the subscrip-
reports that give every administrator the records for each member that provide credit-consuming ac- tion ID, system health status, subscription renewal date, and
information needed to more effectively tivities such as geocoding, routing, analysis, and the creation feature data store usage. By viewing the details of the feature
of notebooks. Credits consumed for file and feature storage data store, administrators can see the current usage of their
manage organizational accounts by monitoring
are charged based on the total organization values, not by organization’s allotted feature storage. Organizations that
members, content, and subscriptions. member, and those charges can be found in the organiza- have purchased a Premium Feature Data Store subscription
tion’s status dashboard. will see a chart displaying their database usage over time.
ArcGIS Online is enterprise ready. It meets The member report lists current details about each mem-
the needs of large organizations for managing ber such as role, available and assigned credits, number of Organization Status Dashboard
Although not a recent addition to ArcGIS Online, the
content and members and effectively handling
organization status dashboard, provides a convenient way
security, authentication, and privacy. Although for administrators to interact with their organization’s usage
member management is important for information. The dashboard includes five sections: credits,
organizations of any size, for organizations with content, apps, members, and groups. Most sections include
charts, tables, and lists that provide drill-down and drill-
thousands of members, efficient and detailed
through capabilities that reveal specific information.
reporting becomes paramount. Recent ArcGIS Regardless of organization size, administrators can fully
Online updates have improved and expanded understand the members and activities within their ArcGIS
report capabilities and improved dashboards. Online organization. By creating status reports, administra-
tors can analyze and archive data regarding the activities,
This enables administrators to more easily credits, members, and items in their organization. On the or-
monitor members’ activities and identify the ganization overview page, administrators can quickly refer-
resources available to each of them. ence information regarding their subscriptions and monitor
feature storage. Using the organization status dashboard,
administrators can interact with their organization’s usage
New and enhanced reporting capabilities let information and drill into items of interest. With these three
administrators more effectively monitor members avenues into information, administrators can efficiently and
and manage resources. This item report includes the thoroughly monitor their organizations.
amount of feature data storage used.
E S
[Eos Positi oning Systems]
ARROW SERIES® WWW.EOS-GNSS.COM MADE IN CANADA
10 ArcNews Winter 2021 esri.com/arcnewsSix Reasons ArcGIS Enterprise Users
Should Get Started with ArcGIS StoryMaps
At long last, ArcGIS StoryMaps is available in ArcGIS Enterprise. Users who have upgraded to The block palette lets users
ArcGIS Enterprise 10.8.1 have access to an intuitive builder that makes it easy to incorporate maps add headings, paragraphs,
bulleted lists, and quotations
and other visual elements to create a truly immersive narrative experience. using a simple (+) button.
There are many reasons to adopt Esri’s next generation storytelling tool, but here are six that will
hopefully encourage ArcGIS Enterprise users to make the switch from classic Esri Story Maps
templates to the new builder as soon as possible.
Getting started is easy.
ArcGIS StoryMaps doesn’t have templates. Instead, users build stories intuitively and on
the fly using the block palette. It lets users create compelling narratives by adding head-
ings, paragraphs, bulleted lists, and quotations using a simple plus (+) button.
Rich, immersive content makes for engaging stories.
There are many ways to embed multimedia content in ArcGIS StoryMaps. One of the
most useful tools for creating smooth transitions between maps and photos is the side-
car block. Using a series of slides, users can integrate media with text to create a simple
scrolling experience.
Draw readers into particular places of interest.
Another new immersive block, called guided tour, enables readers to see where an im-
portant place is on a map, and scroll through relevant photos, videos, and text. It’s similar
to the classic Story Maps Tour template, but it goes above and beyond what that tem-
plate could do.
Create maps in minutes.
No GIS training or cartographic experience? No problem! StoryMaps users can make
With express maps, users can add points of interest, arrows, labels, pop-ups, and
quality maps with express maps. This tool allows them to add areas and points of interest,
arrows, labels, pop-ups, and more without leaving the story builder. more without leaving the story builder.
Map narratives look cohesive and can be branded.
ArcGIS StoryMaps has lots of options for making stories look cohesive and professional— There is no way to automatically reformat classic Story Maps apps into ArcGIS
and all this is easy to access via the app’s modern design. There are six built-in design
themes that users can apply to their narratives, or they can create their own themes using StoryMaps, since there is no one-to-one relationship between the elements of classic
their company’s logo, color palette, and other elements that constitute an organization’s stories and the blocks in ArcGIS StoryMaps. The best way to switch to the new system
brand. Mobile-first design makes these map narratives look great on any device, and people can eas- is to just jump in and start getting acquainted with the builder.
ily interact with maps using their phones. What’s more, users can build whole stories using a tablet.
The new dependent user type, Storyteller, is now also available to ArcGIS Enterprise
An elegant way to present work.
Collections allow stories to be grouped by topic, author, or any other criteria—and they’re users. The Storyteller user type provides access to ArcGIS StoryMaps for just $100 per
a game changer. This feature of ArcGIS StoryMaps makes it possible to present a group of year, so anyone who wants to make stories can do so at a more cost-effective price.
map narratives and share them as a cohesive, easy-to-navigate set. A collection starts with Often, those in marketing, communications, and public relations sectors—or those who
an overview page that shows the collection’s title and description, plus a grid of thumbnails
that represents each map narrative in the set of stories. Users can also add other ArcGIS apps, such as have other content creation roles—get the Storyteller user type.
dashboards, configurable app templates, and surveys, to a collection. For more details, visit the new Storyteller product page at go.esri.com/storyteller or
contact your Esri representative.
Experience The Difference TruPulse® Laser Rangefinders for
High-Accuracy GNSS Laser Offset Mapping
COLLECT FEATURES SAFELY
Built-in laser measurement Integrate with Eos Arrow Position yourself to capture Seamlessly integrates with
routines allow you to collect Series™ GNSS reciever remote asset locations Esri ArcGIS Field Maps
more data than ever before. systems and devices. from a single location. for iOS!
Go2.LaserTech.com/GNSSMapping
esri.com/arcnews ArcNews Winter 2021 11IN FINLAND, A GEOSPATIAL APP GIVES
TRANSPORT DRIVERS THE INFORMATION THEY NEED
Transport companies around the world deliver vital goods GATHERING INFORMATION IN ONE PLACE convinced him that AppStudio was the best option for this.
such as food, clothing, and electronics, making road-based In Finland, the information available to commercial truck From there, implementation was pretty simple.
drivers and dispatchers used to be found in several differ- “I have seen a lot of Tina’s videos, and [they] showed how easy it
freight transport an important part of the global economy.
ent places, such as enterprise resource planning and time is to make an app. So I thought, if it’s that easy, I have to do it with
In Finland, 40 percent of transport companies consist of management systems, according to Lausvaara. Several key this [tool],” Lausvaara said. “Everybody needs this solution.”
just one person and one truck, and these individuals work pieces of information were also unavailable, including height Tietorahti Oy launched the new, free mobile app, called
tirelessly to deliver essential goods. and weight limitations on bridges and roadways. This made Tietorahdin kartta (which translates to “the map of Tietorahti”)
it challenging for drivers to get essential information about in April 2020 using existing data from the previous Google so-
To ensure that drivers receive accurate information their trips, either during the planning phase or while en route. lution. Within the app, there are galleries of ready-to-use maps
about their trips, Finnish transport consulting company As Lausvaara described it, information was “all over the inter- that have relevant information for couriers, log transport com-
net and in different kinds of solutions.” He didn’t believe that this panies, and container transport companies. For example, a
Tietorahti Oy collects and updates transport industry data
was serving the local commercial trucking industry very well, so courier can see parking places in city centers, while a container
on everything from gas stations to the maximum weight he set out to create one solution with access to all this data. transport company can view port information.
allowed on various roadways. Although some of this data First, Tietorahti Oy used Google My Maps to introduce a Lausvaara used his own transport industry dataset that comes
was available before, drivers couldn’t access it in one paid solution, released on Google, for accessing transport from 14,000 transport companies and includes over a million data
industry data. This included data from transport companies, points on things like revenue, equipment, type of transport, and GIS
system. What’s more, the data they did have access to
as well as open data on everything from truck stops and re- data. This allows Tietorahti Oy to inform transport companies when
wasn’t always accurate. This made it difficult for drivers to pair shops to truck height limits and gas stations. Within two relevant information is available in the app, such as when loading and
get the trip information they needed while on the road. years, the app had 1,700 users. unloading locations are added.
According to these users, however, the data included a lot Tietorahti Oy advertises its app to drivers with a paper
That’s why Janne Lausvaara, founder of Esri startup partner of errors. The tool also had two specific limitations: a limit of leaflet that says, “[Y]ou have the power to choose what you
Tietorahti Oy, created a mobile app that drivers can use 600 users and a restriction of 10 layers per map. Correcting can see on your map.”
to easily access critical data while on the road. Employing erroneous data was a lot of work for Lausvaara, too.
“If there was wrong data, I had to fix it four times so users DRIVERS GET A TAILORED EXPERIENCE
the ready-to-use configurable templates that come with
could see it,” he said. “And [the data] was difficult to edit, since The new, free mobile app—which also functions as a naviga-
ArcGIS AppStudio, Lausvaara was able to build an app—
it was in multiple places.” tion system and tailors its results to where a driver is travel-
without doing much coding—that makes drivers’ journeys Lausvaara decided to create yet another solution that ing—has more than 5,400 users and has received positive
safer and the transport of vital goods more efficient. would not only make information accessible in one place but feedback from transport companies. Part of the reason for this
also have rich data and easier editing capabilities. is that truck drivers and transport companies can create a cus-
tomized experience for themselves. For example, drivers can
A SOLUTION THAT DOES IT ALL decide to only view gas stations for which they have a card.
Lausvaara wanted to create a map-based mobile app that was “Drivers can choose what map layers they see, and I was
available in public app stores, but he didn’t know where to start. really excited when I found this out,” said Lausvaara. “The
In talking with Ilkka Suojanen, chief technology officer of Esri map and device remember [the options] drivers have chosen,
Finland, Lausvaara found out about AppStudio. Suojanen sug- and there is one map with all the data.”
gested it because, whereas it allows users to build geoenabled, The app collates data from agencies such as Traffic
cross-platform native apps, it requires minimal coding. Management Finland. In addition to displaying information
To begin creating this new solution, Lausvaara applied such as the locations of gas stations, parking places, rest
to join the Esri Startup Program, which helps early-stage stops, and loading areas, the app shows traffic incidents and
startups, like Tietorahti Oy, build mapping and location in- roadwork information (crowdsourced from drivers), where
telligence into their products. After becoming part of the pro- showers and saunas are, and various types of weight and
gram in January 2020, Lausvaara employed AppStudio and height limits for roadways around Finland.
worked with a single developer and a graphic designer to get Tietorahdin kartta is widely available to drivers through-
his app up and running. out the country, which gives Lausvaara an efficient way to
“I was really excited about AppStudio because I only had to collect more data from users and, in turn, improve the app’s
use my code guy,” said Lausvaara. “I [could not pay] anyone to data quality. And, perhaps most significantly, all this more ac-
make me software, so [coding] was really easy with AppStudio.” curate information is available in one place instead of scat-
He watched video tutorials created by Esri’s AppStudio tered around different solutions.
team to learn how to use the product. Lausvaara said that Lausvaara finds it easy to make edits and correct errors in
videos from Esri product engineer Tina Jin, in particular, the data using the app as well. Previously, he said, he would
Tietorahdin kartta is a mobile app that
transport drivers can use to access critical data
while on the road.
12 ArcNews Winter 2021 esri.com/arcnewsYou can also read