Aspen Group Update 1st Quarter FY22 - 15 October 2021 - AFR
←
→
Page content transcription
If your browser does not render page correctly, please read the page content below
Aspen Group
Update 1st Quarter FY22

15 October 2021
                          1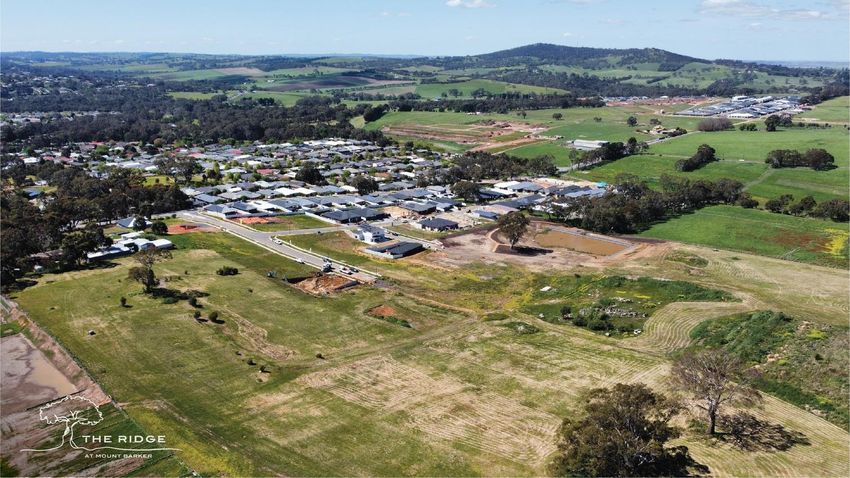
Aspen’s Business Model

                                                             Aspen Provides Quality Accommodation to
                                                            Australian Households on Competitive Terms
       Sustainable Ecological Footprint                 Customer-centric business model typically servicing households that                          Governance
                                                         can afford no more than $400 weekly rent or $400k purchase price
   Aspen’s efficient dwellings use significantly less      We provide a range of products demanded by our customers in
   resources to manufacture and operate than the                   residential, retirement and park communities                    Aspen Group comprises Aspen Group Limited and
         average Australian home – we also
                                                                                                                                       Aspen Property Trust with two separate
             recycle/refurbish dwellings                    We foster a safe, social, diverse, and inclusive culture in our
                                                                                                                                                independent Boards
                                                         communities by providing on-site management, customer services,
   With solar installed, our dwellings can produce
                                                         and community facilities which gives our residents a sense of home         Aspen provides equal employment opportunities
    more renewable energy than they consume
                                                                 and meaningful connections to the community                       regardless of gender, gender-identity, age, culture,
   We install energy and water saving devices and                                                                                          race, religion and lifestyle choices
          metering to reduce resource use               Total value of real estate in Aspen’s addressable market >$1 trillion
                                                                                                                                     We continuously strive for the highest WH&S
Our communities share resources such as common                                                                                         standards at our properties to keep our
 areas, recreation facilities, gardens and transport                                                                                  employees, suppliers and customers safe
                                                           Average                 Average Land                 Average
   Our parks are highly vegetated, and our land                                                                                     Our Joint CEOs own a combined stake of 8.7% in
  management programs reduce degradation and            Dwelling Rent of            Site Rent of            Dwelling Sales            Aspen Group and 50% of their remuneration
               environmental risks                      $248 per Week*            $166 per Week*            Price of $287k*         package is deferred for up to 3 years and subject
                                                                                                                                     to performance hurdles and vesting conditions
  Aspen’s carbon emission reduction target for the
   assets that it controls is in accordance with the
                2015 Paris Agreement                       Some of our properties are located in past and present Indigenous
                                                        communities, and we actively seek to help these communities and conserve
                                                                                      heritage items

* As at 30 June 2021
                                                                                                                                                                                          2
Financial Performance
                                                              1Q FY22         1Q FY21                             FY21
  Key Metrics (management accounts - not audited)                                              Change
                                                                $m              $m                                 $m
                                                                                                                                   1QFY22 performance was reasonable in a challenging operating environment:
  Total Revenue                                                 11.77            9.24             27%            35.95
                                                                                                                                   ▪ Rental and ancillary services revenue up 4.7% - mainly attributable to higher
  Operating & Development Net Income                             4.34            4.20            3.5%            14.84               contributions from Darwin Freespirit Resort (DFR) and new acquisitions including
                                                                                                                                     Uniresort and Lewis Fields, offset by a material decline in Aspen Karratha Village (AKV)
  Margin                                                         37%             45%                              41%
                                                                                                                                     revenue post expiry of the Woodside lease while a new customer base is being built
        - Rental & ancillary services revenue                    8.03            7.67            4.7%            29.07
                                                                                                                                   ▪ Net Operating Income down 5.6% - margin declined from 47% to 43% driven by a
        - Direct property expenses                              (4.59)          (4.03)            14%           (16.39)              change in business mix (eg. greater contribution from relatively low margin DFR and
        Net Operating Income                                     3.44            3.64           (5.6%)           12.68               lower contribution from AKV) and cessation of JobKeeper receipts after 1QFY21

        Operating Margin                                         43%             47%                              44%              ▪ Net Development & Trading Income up 63% - sale of 9 houses mainly from the Perth
                                                                                                                                     House Portfolio
        - Development & trading revenue                          3.74            1.57            139%             6.88
                                                                                                                                   ▪ Net corporate overheads up 5.8% - net of project management fees of $0.27m from
        - Cost of sales                                         (2.84)          (1.01)          180%             (4.72)              the Mill Hill Capital funds
        Net Development & Trading Income                         0.90            0.55             63%             2.16             ▪ Net interest expense up 5.4% - increased debt and increased hedging over the
        Development & Trading Margin                             24%             35%                              31%                quarter with $70m of BBSW exposure (65% of current drawn debt) fixed to April 2024
                                                                                                                                     at 50bps
    Net Corporate overheads                                     (1.07)          (1.01)           5.8%            (4.50)
                                                                                                                                   ▪ Nil tax – Aspen has a material amount of historic tax losses that currently shelters
  Operating EBITDA                                               3.27            3.18            2.7%            10.34               taxable profits
    Net finance expense                                         (0.35)          (0.33)           5.4%            (1.34)            ▪ Operating EPS down 4.8% - impacted by acquisition of Perth Apartment Portfolio
    Tax                                                            -                -               -                -               (PAP) in September that did not contribute to earnings, but were funded with new
                                                                                                                                     equity and debt
  Operating Profit1                                              2.92            2.85            2.4%             9.00
                                                                                                                                   Aspen’s total earnings are not seasonal in our opinion – some of our parks
  Securities (weighted)                                         125.2           116.4            7.6%            116.4
                                                                                                                                   communities are highly seasonal, however our Darwin Freespirit Resort and NSW
  Operating EPS (cents)                                          2.33            2.45           (4.8%)            7.73             coastal parks peak in winter and summer respectively

1. Non-IFRS measure used by management to assess the underlying performance of Aspen - excludes depreciation and amortisation, revaluations, and one-off and non-operating items. Refer to definition in financial statements.
                                                                                                                                                                                                                                 3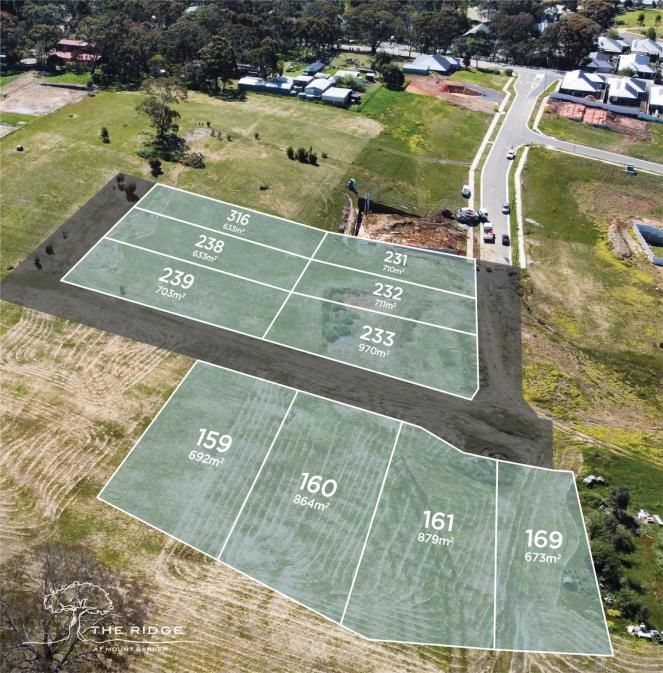
Residential
▪ Upper Mount Gravatt Co-living Community (UMG) has performed above expectations to date and is now the largest contributor to residential portfolio NOI – in 1QFY22:
      - Occupancy rate of only 76% and average rent of only $208 per week per room, constrained by international border closures
      - Material cost reduction helped lift NOI to about $350k in the quarter, equating to an annualised yield of 7.5% on purchase price
▪ Perth House Portfolio – prices and rents continue to increase and we have improved the quality of our tenant base which has significantly reduced rental arrears and R&M
▪ Treatts Road Lindfield – rents have increased as the tenant mix changed over time – only 2 of the retirement village tenants remain with most relocating to Pacific Highway
▪ Burleigh Heads redevelopment is progressing well and we expect to complete and lease the first 4 houses by 31 December 2021 and the remainder by 4QFY22:
      - Expected average weekly rent is now $750 versus $540 at time of purchase
      - Current median sale price of local 3 bedroom house / apartment is now $954k / $1.03m (source: domain) versus expected average cost of $480k per house
▪ Cooks Hill redevelopment has commenced – expect to complete project by 30 June 2022
Burleigh Heads and Cooks Hill projects detracted about $50k from NOI for the quarter as we expense all operating costs (eg. land tax, council rates) – these properties are
expected to generate NOI of about $1m per annum on completion of refurbishment and leasing

                                                                                                                                               Residential

                                                                                                                                 1QFY22          1QFY21            Change

                                                                                                               Revenue           $1,211           $972               25%

                                                                                                               NOI                $517            $309               67%

                                                                                                               Margin             43%             32%                11%

Chart source: Corelogic
                                                                                                                                                                                4
Residential – Perth Apartment Portfolio

  ▪ Perth Apartment Portfolio repositioning and refurbishment program            PAP Refurbishment Targets - # of Apartments
    is progressing well:
      - The portfolio comprises 514 apartments, averaging about 55sqms
        and 1.7 bedrooms                                                     0          100          200               300                400            500
      - For the c.150 apartments that are already in good condition we
        are aiming to retain the good quality tenants on average rents of
        about $255 per week (increase of about $35 per week or +13%)                                                                        132 Guildford Rd
                                                                                                                                                 Refurb
      - We notified termination of about 45 leases to make way for
        refurbishment – we plan to empty 132 Guildford Road (120
        apartments) to provide flexibility for a more substantial
                                                                                                                         Stage 2 Refurb
        repositioning of the property
      - Stage 1 Refurbishment Works have commenced - 113 apartments
        using 3 main contractors - contracted cost for a complete internal
                                                                                                    Stage 1 Refurb -
        gut and refit of a 2 bedroom unit is about $30-35k (excludes                                   Underway
        common area and external works)
      - Stage 1 refurbished apartments will be progressively handed back
        and offered for lease from early next month                               No Refurb
                                                                                  Required
      - We believe the acquisition will become neutral to FY21 pro-forma
        EPS when around 300 apartments are occupied

                                                                                              Currently           Target
                                                                                              Occupied          30 June 22

                                                                                                                                                               5
Retirement Communities
▪ Continued steady growth in land rents of 2-4% per annum                                                                  Retirement Communities

▪ Some of the margin contraction in 1QFY22 is due to expensing the costs of the vacant land                       1QFY22          1QFY21            Change
  at the recently acquired Lewis Fields and Wodonga Gardens
                                                                                                        Revenue   $1,014           $878              16%
▪ Sweetwater Grove repositioning and expansion is progressing well:
                                                                                                        NOI        $597            $575              4%
      - Existing dwellings have been moved around and off the site to make way for new
        houses – this has negatively impacted short term NOI                                            Margin     59%             66%              (7%)
      - Prices for new homes have increased about 15% since commencement – 3 bedroom
        house price is now above $300k
      - Per lot civil costs will be low in the next stage as much of the existing infrastructure will
        be retained
▪ Lewis Fields and Wodonga Gardens have two components:
      - 77 existing Retirement Village (RV) dwellings with traditional loan/lease agreements –
        total purchase price for this operating component was $3.9m and we expect to collect
        $6.4m in deferred fees (assuming total exit fees are reduced from 36% to 25% and static
        house prices) – average revenue of over $500k per annum assuming ALOS* of 12 years
      - 175 approved land lots that we are seeking to develop and operate under a Land Lease
        model – we paid only $26k per approved lot on average (the next c.25 houses will be
        built on lots with civils already in place)
      Lewis Fields residents have approved our restructuring proposal and Council is supportive
      - we expect the land title to be updated shortly and to commence construction of the first
      4 new houses this quarter to be sold under a land lease model
      At Wodonga Gardens the next 12 houses developed will be leased under the traditional
      RV model as these lots are situated amongst the existing RV houses and we already hold 9
      deposits at an average price of $377k (plus future DMF)

* ALOS: Average Length of Stay of existing residents
                                                                                                                                                             6
Park Communities
Park Communities
▪ COVID-related restrictions are impacting short stay business at our parks – we
have been actively pivoting between short stay and longer stay letting depending 1QFY22 1QFY21 Change
on lockdown status and the season: Revenue $5,807 $5,824 0%
- Our NSW coastal parks, especially Tween Waters, and Adelaide Caravan Park
NOI $2,326 $2,757 (16%)
(near the CBD) have been impacted the most
Margin 40% 47% (7%)
- A large proportion of the NOI decline versus pcp can be attributed to the
cessation of JobKeeper post 1QFY21
▪ Darwin Freespirit Resort performed well in its peak trading season and NOI Park Communities NOI – 1Q FY22
doubled versus pcp – current business-on-books for October and November is well $1,500k
ahead of the same time last year $1,300k
▪ Aspen Karratha Village NOI is down materially post the end of Woodside’s lease in $1,100k
January 2021 - occupancy has been building slowly and NOI turned slightly positive
$900k
in 1Q after being negative for the last 5 months of FY21 – we still expect significant
growth in demand for accommodation in the years ahead once Woodside and $700k
others greenlight their Karratha projects, but NOI is likely to remain volatile over $500k
the short term
$300k
▪ Highway 1 and Barlings Beach have a large proportion of long term dwelling leases
$100k
and casual and long term land leases which has helped maintain profitability
despite the disruptive lockdowns -$100k
Darwin AKV Highway 1 Barlings ACP Koala Tween
▪ We are expecting strong trading performance at our NSW coastal parks over their FSR Beach Shores Waters
peak summer trading periods as long as people are free to travel 1QFY21 1QFY22
7Development & Trading Activity
Settled - September Quarter FY22 Contracts/Deposits at 30 September 2021
Solid momentum in development and trading
# Per Per activity has continued in FY22
$m (ex.GST) # Dwellings/Sites $m (ex.GST)
Dwellings/Sites Dwelling/Site Dwelling/Site Combined sales/contracts/deposits for new
retirement community houses is 30 compared
Development & Trading to 23 settled sales in all of FY21
Total Revenue 9 $3.74 $415,727 34 $10.99 $323,120
- Fairly evenly split between Four
Total Cost ($2.84) ($315,434) Lanterns, Sweetwater Grove and
Profit $0.90 $100,293 Wodonga Gardens
Margin 24% - Margins are increasing – price growth
has outpaced higher building costs
Development - Only 1 sale settled in 1QFY22 mainly due
to delays in house construction during
Total Revenue 1 $0.20 $204,545 29 $8.88 $306,089 COVID lockdowns and supply issues
Total Costs ($0.16) ($163,437)
- All general marketing costs for projects
Expected are expensed when incurred which
Profit $0.04 $41,108
Margin c.30% impacted reported margin in 1QFY22
Margin 20% due to only 1 sale
Combined sales/contracts for existing
Trading residential houses is 13 compared to 2 settled
Total Revenue 8 $3.54 $442,125 5 $2.11 $421,900
sales in all of FY21
Total Costs ($2.68) ($334,434) - Prices are increasing: Q1 average settled
sales price (pre transaction costs) was
Expected
Profit $0.86 $107,691
Margin c.20%
8% above the written up book value at
30 June 2021
Margin 24%
8Development & Trading Activity – Trading Profits
Total returns and value-add are reflected through a combination of operating earnings and net asset value (NAV) :
▪ Aspen’s properties are typically classified as Investment Properties under IFRS, therefore must be valued at balance date each half year - combination of external valuer
and Directors’ appraisals
▪ This includes the Perth House Portfolio - the average trading profit from the sale of individual houses in 1QFY22 was $111k per house, of which only $94k was reflected on
the balance sheet at 30 June 2021
▪ Aspen’s carrying values of retained houses will be reviewed at 31 December 2021 reflecting the c.8% premium achieved on these sales over 30 June 2021 book values,
and other market evidence
$425,515
9Development & Trading Activity – The Ridge, Mount Barker
▪ Mount Barker englobo land was acquired in December 2020 with approvals in place for 97 residential land lots - our current plan is to:
- Develop and sell the premium parts of the site, along the ridge and slopes with northerly aspect and views to Mount Barker Summit, for general residential use
- Develop the flatter, lower lying section of the site into a retirement community to be operated under a land lease model
The proposed proportions of each are still being determined based on our opinion of highest and best use of the land and potential investment returns for our business
▪ Stage 1 of the residential land development comprises 36 lots:
- Civil works are expected to commence in November and complete in 4QFY22
- Presales campaign started last weekend on standard lots – offers already received on 7 of the 10 lots offered - average sales price of $253k (inc. GST)
- Expected profit margin of roughly $100k per lot (based on expected average cost and assuming 97 lots only)
Under offer
Under offer Under offer
Under offer
Under offer
Under offer
Under offer
10Disclaimer This presentation has been prepared by Aspen Group Limited on behalf of Aspen Group Limited and Aspen Property Trust (“Aspen”) and should not be considered in any way to be an offer, invitation, solicitation or recommendation with respect to the subscription for, purchase or sale of any security, and neither this document nor anything in it shall form the basis of any contract or commitment. Prospective investors should make their own independent evaluation of an investment in Aspen. Nothing in this presentation constitutes investment, legal, tax or other advice. The information in this presentation does not take into account your investment objectives, financial situation or particular needs. The information does not purport to constitute all of the information that a potential investor may require in making an investment decision. Aspen has prepared this presentation based on information available to it. No representation or warranty, express or implied, is made as to the fairness, accuracy, completeness or correctness of the information, opinions and conclusions contained in this presentation. To the maximum extent permitted by law, none of Aspen, its directors, employees or agents, nor any other person accepts any liability, including, without limitation, any liability arising from fault or negligence on the part of any of them or any other person, for any loss arising from the use of this presentation or its contents or otherwise arising in connection with it. This presentation contains forward looking information. Indications of, and guidance on, future earnings, distributions and financial position and performance are forward looking statements. Forward looking statements are based on Aspen’s current intentions, plans, expectations, assumptions, and beliefs about future events and are subject to risks, uncertainties and other factors which could cause actual results to differ materially. Aspen and its related bodies corporate and their respective directors, officers, employees, agents, and advisers do not give any assurance or guarantee that the occurrence of any forward-looking information, view or intention referred to in this presentation will actually occur as contemplated. All references to dollar amounts are in Australian currency.
You can also read