GENERAL SURVEY OF LARGE-SCALE LAND SUBSIDENCE BY GACOS-CORRECTED INSAR STACKING: CASE STUDY IN NORTH CHINA PLAIN - PIAHS
←
→
Page content transcription
If your browser does not render page correctly, please read the page content below
Tenth International Symposium on Land Subsidence (TISOLS)
Proc. IAHS, 382, 213–218, 2020
https://doi.org/10.5194/piahs-382-213-2020                                                                           Open Access
© Author(s) 2020. This work is distributed under
the Creative Commons Attribution 4.0 License.

             General Survey of Large-scale Land Subsidence by
             GACOS-Corrected InSAR Stacking: Case Study in
                             North China Plain
                        Ruya Xiao1,2 , Chen Yu2 , Zhenhong Li2,3 , Chuang Song2 , and Xiufeng He1
                    1 School of Earth Science and Engineering, Hohai University, Nanjing, 211100, China
                     2 Schoolof Engineering, Newcastle University, Newcastle upon Tyne, NE1 7RU, UK
               3 College of Geological Engineering and Geomatics, Chang’an University, Xi’an, 710054, China

                                    Correspondence: Ruya Xiao (ruya.xiao@hhu.edu.cn)

                                                     Published: 22 April 2020

       Abstract. Satellite-based InSAR (Interferometric Synthetic Aperture Radar) provides an effective way to mea-
       sure large-scale land surface motions. Currently, the atmospheric phase delay is one of the most critical issues
       in InSAR deformation monitoring. Generic Atmospheric Correction Online Service (GACOS) is a free, glob-
       ally available and easy-to-implement tool to generate high-resolution zenith total delay maps, which could be
       used for InSAR atmospheric delay correction. The mean velocity could then be estimated by stacking multiple
       GACOS-corrected interferograms. We applied the proposed GACOS-corrected InSAR stacking method in the
       North China Plain and analysed its performance. Within the 549 interferograms, more than 85 % gained posi-
       tive correction performances. The correlation between the phase-dZTD indicator and the performance reached
       0.89, demonstrating a significant relationship. Deformation maps revealed by InSAR stacking with and with-
       out GACOS corrections showed that GACOS could mainly remove the topography-related and long wavelength
       signals.

1   Introduction                                                   fected by the differences in propagation paths through the
                                                                   troposphere, is one of the most critical issues in large-scale
The successful operation of the European Space Agency’s            InSAR deformation monitoring.
(ESA) Sentinel-1 satellites provide unprecedented possibil-           The second part of this paper briefly introduces InSAR
ities and convenience for large-scale land surface deforma-        atmospheric effects and the existing methods for mitiga-
tion measurements. Ground motion monitoring using InSAR            tion. Section 3 describes the data processing strategy of the
are extended from local, regional practices to full, nation-       proposed GACOS-corrected InSAR stacking method. Study
wide scale applications. In recent years, the implementa-          area, satellite data used, and results are presented in Sect. 4,
tions of researches or projects covering a whole country,          followed by the conclusions in Sect. 5.
such as Italy (Costantini et al., 2017), Germany (Haghighi
and Motagh, 2017), Norway (https://insar.ngu.no, last ac-          2   InSAR atmospheric corrections
cess: 2 March 2020) and Japan (Ferretti et al., 2019), indicate
that dynamic monitoring of land surface deformation with a         The propagation paths of the microwave signals of the SAR
certain level of automation will be expected to become a rou-      sensors on the satellite are affected during the 2-pass through
tine operation. The achievements of general surveys will be        the Earth’s atmosphere, expressed as the changes in the tran-
the foundation and guide for detailed investigation.               sit time, which is always known as the atmospheric effects of
   Although InSAR has been proven successful in many ex-           InSAR (Li et al., 2005). The tropospheric effects are mainly
isting cases, there are still inherent limitations in the tech-    related to the variations of the water vapour in the tropo-
nique. At this stage, the atmospheric phase delay, mainly af-      sphere, as well as the temperature and pressure changes at

Published by Copernicus Publications on behalf of the International Association of Hydrological Sciences.
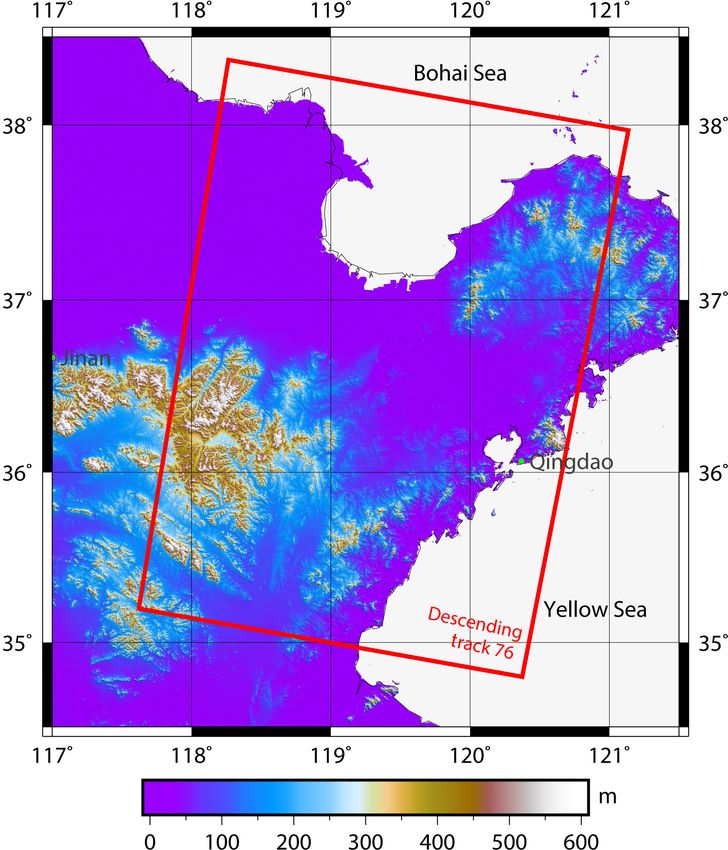
214                                      R. Xiao et al.: Large-scale Land Subsidence by GACOS-Corrected InSAR Stacking

Figure 1. Data processing flowchart of GACOS-corrected InSAR
stacking.

different SAR image acquisition time. Generally, the atmo-
spheric effect could result in up to 15–20 cm errors in the
interferograms, which may interfere with or even make the           Figure 2. Overview of the study area with topography as the back-
signals of interest indistinguishable. Researchers have devel-      ground map.
oped numerous means to mitigate atmospheric effects. Ac-
cording to the data used, there are mainly two types of meth-
ods: atmospheric corrections with or without external data.         used ERA-Interim (ERA-I) released by the European Cen-
   No external data employed means there are no other atmo-         ter for Medium-Range Weather Forecasts (ECMWF) (Jolivet
spheric parameter measurements, such as water vapour and            et al., 2011), have the properties of high availability, relative
temperature, involved in the processing. This kind of phase-        “continuity”, and insensitivity to the clouds, making them
based corrections, such as phase-elevation estimate (Bekaert        popular atmospheric delay correction data sources.
et al., 2015) or PSI (Ferretti et al., 2001), are always based on      Although there are successful cases, every type of correc-
certain assumptions. As its name suggests, the major benefit        tion methods has limitations and cannot always promise suc-
of this type of methods is that external data are not needed,       cess (Murray et al., 2019). Moreover, the processing of these
and it is straightforward and easy-to-implement. However,           external data further increases the complexity of InSAR data
the disadvantages are obvious: (i) this method may have the         processing procedure. The development of Generic Atmo-
risk that the signal of interest is removed, (ii) in some scenar-   spheric Correction Online Service for InSAR (GACOS), to
ios, it is difficult or impossible to evaluate the performance      some extent, has solved the above problems.
of atmospheric signal removal quantitatively.
   The external data used in InSAR atmospheric correction           3   GACOS-Corrected InSAR Stacking
mainly includes three types of data, i.e., satellite-based spec-
trometer observations, ground observations and numerical            Launched in June 2017, GACOS has distributed more than
meteorological models. MEdium Resolution Imaging Spec-              60 000 tasks all over the world. Together with DEM data,
trometer (MERIS) (Li et al., 2012) and Moderate Resolu-             it utilises atmospheric model High RESolution 10-day fore-
tion Imaging Spectroradiometer (MODIS) offer near-IR wa-            cast (HRES) datasets, which is ECMWF’s highest-resolution
ter vapour products at a fine resolution (∼ 1 km) and high ac-      model of up to 0.1◦ × 0.1◦ lat/long grid, 137 levels at ev-
curacy (∼ 1 mm), but it is sensitive to the presence of clouds      ery 6 h. The innovative Iterative Tropospheric Decomposi-
and daytime available only. Ground-based atmospheric pa-            tion (ITD) model is implemented to separate stratified and
rameters used in InSAR atmospheric corrections refer to             turbulent components from tropospheric delays (Yu et al.,
observations from meteorological stations and GNSS ZTD.             2017), and then high spatial resolution (default 90 m) ZTD
However, even the densest GPS networks are overshadowed             maps are generated. GACOS is not only globally available
compared to the spatial resolution of SAR remote sensing            and near real-time but also free and easy-to-implement, that
images. These numerical weather models, such as widely              is, the users only need to submit a request with the location

Proc. IAHS, 382, 213–218, 2020                                                                       proc-iahs.net/382/213/2020/
R. Xiao et al.: Large-scale Land Subsidence by GACOS-Corrected InSAR Stacking                                                     215

Figure 3. Spatial and temporal baselines of the interferograms.

of their study area and the acquisition time of SAR data,
and then get the ZTD products. More information can be
found on http://ceg-research.ncl.ac.uk/v2/gacos/ (last access:
2 March 2020).
   The averaging of multiple interferograms (stacking) is the
simplest attempt to remove the influences of errors such as
the atmosphere in time-series InSAR analysis. In this model,
the signal of interest, i.e., deformation in the interferograms,
is assumed to have a systematic pattern, and the atmospheric
noise is random. The method of least squares could signifi-
cantly increase the signal-to-noise ratio by reducing the ran-
dom noises (Wright et al., 2001). Mean velocity map is the
most intuitive way to show the characteristics of deforma-
tion. A constant rate of each pixel is estimated by N individ-          Figure 4. GACOS performance statistics from 549 interferograms.
ual interferograms following Eq. (1):
          N
          P                                                             4     Results and Discussion
              ϕi 1Ti
          i=1
Vmean =                                                           (1)   4.1    Study area and data used
            N
                1Ti2
           P
          i=1                                                           As China’s largest alluvial plain, the North China Plain cov-
                                                                        ers the area of 32–40◦ N, 114–121◦ E, and is inhabited by
where Vmean is the mean velocity, ϕi demonstrates the un-               more than 20 % population of China. The region is flat, most
wrapped phase, and 1Ti is the temporal baseline of the                  of which are less than 50 m, and the eastern part is less than
ith interferogram. In Eq. (1), the interferometric phases are           10 m above sea level.
weighted by the time interval.                                             We explore the study area with SAR images acquired on
   As shown in Fig. 1, we proposed a new method estimat-                66 days between October 2016 and March 2019, by Sentinel-
ing the deformation rate by InSAR stacking with GACOS-                  1b. SAR imaging time is 22:04 UTC. Figure 2 demonstrates
corrected interferometric phases. The interferograms genera-            the location and topography of the study area. The red rect-
tion process is similar to the traditional small baseline subset        angle region involves 55 bursts in 3 sub-swaths. We multi-
method. After phase unwrapping, the phases are corrected                look the interferograms by the factor of 40 (range) and 8
pair by pair using GACOS differential ZTDs (dZTDs). We                  (azimuth), which refers to the resolution of ∼ 120 m. Totally
can employ performance indicators to evaluate the effective-            549 interferograms are formulated with the restriction that
ness of the corrections and decide whether to apply the cor-            temporal baselines are less than 300 days and at most nine
rection to one specific interferogram or not. Finally, the mean         interferometric pairs are generated for each date. The spatial
velocities are estimated using the updated phases.                      and temporal baselines are shown in Fig. 3. All the interfero-
                                                                        metric phases are unwrapped using minimum cost flow with
                                                                        the coherence threshold of 0.4.

proc-iahs.net/382/213/2020/                                                                        Proc. IAHS, 382, 213–218, 2020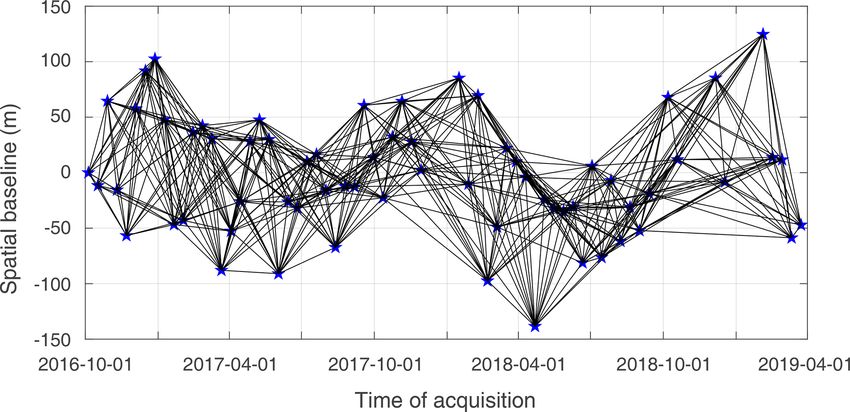
216 R. Xiao et al.: Large-scale Land Subsidence by GACOS-Corrected InSAR Stacking
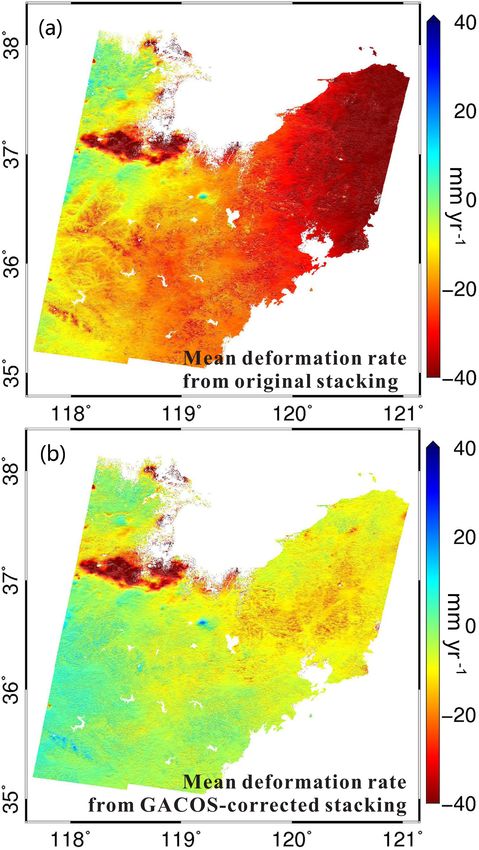
Figure 5. GACOS ZTD difference (b, e) and interferograms before (a, d) and after (c, f) corrections for two pairs with different baselines.
4.2 Results more than 85 % interferograms in this case. Moreover, in the
78 negative performance pairs, there are 36 interferograms
4.2.1 Phase standard deviations of interferograms (6.6 % of the total population) whose standard deviations are
less than 10 mm (2.28 rad) or the performance is larger than
The phase standard deviations of interferograms before and −10 %, which means there is, in fact, no significant differ-
after correction are always used for assessment of the perfor- ence between the corrected and original results.
mance of atmospheric signal removal. Considering the ex- Two InSAR atmospheric correction examples are shown
isting deformation signals in the interferograms, we mask in Fig. 5. The first column (Fig. 5a–c) shows the interfer-
out the fast deforming areas with a mean velocity larger ogram generated by SAR images dated on 5 and 17 Octo-
than 30 mm yr−1 (using a preliminary deformation result) for ber 2016 with a spatial baseline of −11.6 m. After correc-
the interferograms with a temporal baseline of more than tion (Fig. 5c), the standard deviation of the interferogram de-
24 days (431 interferograms), before calculating the standard creased by 52.24 % to 2.91 rad. In the second case (Fig. 5d–
deviations. The results are binned to 7 levels, as shown in f), the standard deviation of GACOS-corrected interferogram
Fig. 4. The positive values of the performance indicate im- is only about 1/4 of that of the original interferogram. For
provements, and GACOS corrections played a positive role the full population of the 549 interferograms, the median and
(the phase standard deviations decreases after correction) for
Proc. IAHS, 382, 213–218, 2020 proc-iahs.net/382/213/2020/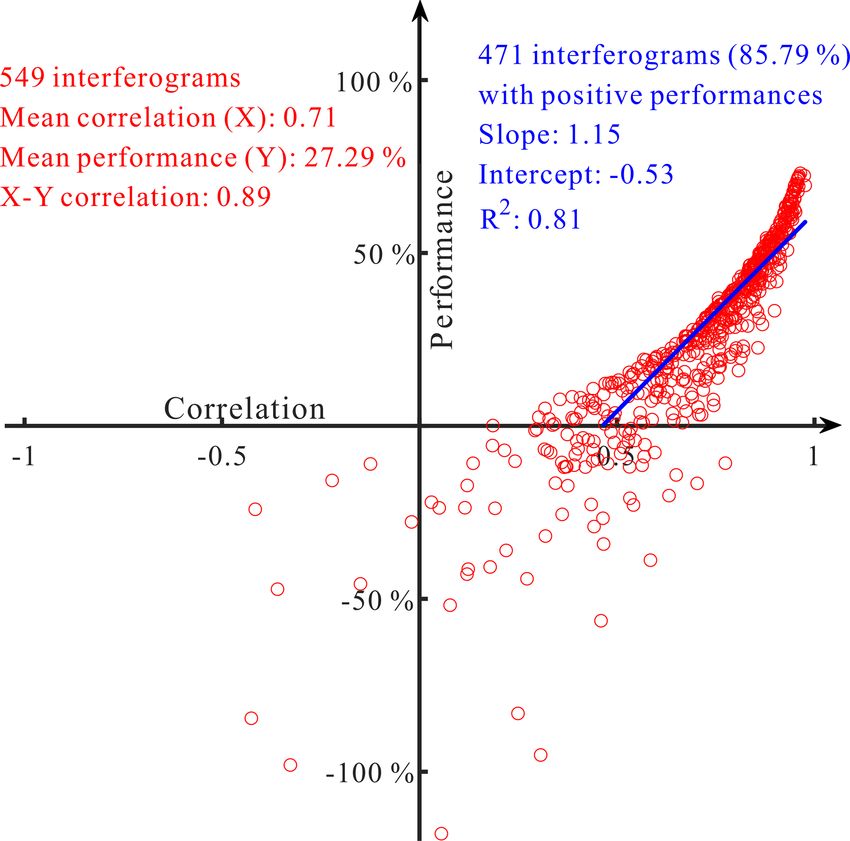
R. Xiao et al.: Large-scale Land Subsidence by GACOS-Corrected InSAR Stacking                                               217

Figure 6. Correlation analysis of the phase-dZTD indicator and
GACOS performance.

mean of the performance are 31.15 % and 27.29 %, respec-
tively.

4.2.2   Correlation analysis of the phase-dZTD indicator
        and performance
                                                                 Figure 7. Deformation revealed by InSAR stacking without (a) and
The correlation between the interferometric phases and           with (b) GACOS corrections.
dZTDs could be used as an indicator for the applicability of
GACOS (Yu et al., 2018). Here we investigate the correla-
tion between the indicator and GACOS performance. Fig-           attention on algorithm efficiency and estimation efficiency
ure 6 shows that the mean correlation (indicator) of the 549     in the data processing practice of large-scale ground defor-
interferograms is 0.71, and the mean GACOS performance is        mation general surveys. GACOS-corrected InSAR stacking,
27.29 %. The correlation between them is 0.89, determining       as a robust method which is straightforward and easy-to-
that the performance has a significant relationship with the     implement, provide an effective way for general surveys of
indicator. Statistics from the 471 interferograms with posi-     land surface deformation.
tive performances demonstrate that there is a nearly linear
relationship between the indicator and the performance: the      5    Conclusions
higher the phase-dZTD correlations, the more positive effect
of the GACOS corrections.                                        As an InSAR atmospheric correction method with external
                                                                 data, GACOS has the advantages of globally available, near
4.2.3   Deformation revealed by GACOS-Corrected                  real-time and easy to implement. In this paper, we proposed
        InSAR Stacking                                           the GACOS-corrected InSAR stacking method for general
                                                                 surveys of the land surface deformation. The main conclu-
The LOS deformation maps are revealed by stacking from           sions are as follows:
the original and corrected interferograms, as shown in Fig. 7.
We can see topography-related and long wavelength signals            1. The standard deviations of 471 interferograms de-
exist in the original deformation map (Fig. 7a), while they             creased after GACOS corrections, i.e., more than 85 %
are largely removed by GACOS (Fig. 7b).                                 interferograms, in this case, got positive performances.
   In Fig. 7a, the deformation pattern is obscured by the at-        2. The correlation between the phase-dZTD indicator and
mospheric effects, which leads to a misunderstanding of the             the performance was analysed, and the correlation of
land surface motions in the study area. GACOS solved the                0.89 demonstrated a significant relationship.
issue in a simple and effective way. The development of
the new generation satellites as Sentinel-1 with rapid revis-        3. Deformation was revealed by InSAR stacking method
iting period (12 to 6 days) in the big data era, increases the          from the original and corrected interferograms, showing

proc-iahs.net/382/213/2020/                                                                  Proc. IAHS, 382, 213–218, 2020
218 R. Xiao et al.: Large-scale Land Subsidence by GACOS-Corrected InSAR Stacking
that GACOS largely removed the topography-related Ferretti, A., Novali, F., Giannico, C., Uttini, A., Iannicella, I., and
and long wavelength signals. Mizuno, T.: A SqueeSAR database over the entire Japanese terri-
tory, 2019 IEEE International Geoscience and Remote Sensing
Symposium – IGARSS, Yokohama, Japan, 28 July–2 August,
Data availability. Sentinel-1 SAR data used in this study are from 2019.
European Space Agency (ESA), downloaded through Copernicus Haghighi, M. H. and Motagh, M.: Sentinel-1 InSAR over Germany:
Open Access Hub at https://scihub.copernicus.eu/dhus/#/home (last Large-scale interferometry, atmospheric effects, and ground de-
access: 2 March 2020). GACOS products are provided by Newcas- formation mapping, zfv – Zeitschrift für Geodäsie, Geoinforma-
tle University at http://ceg-research.ncl.ac.uk/v2/gacos (last access: tion und Landmanagement, 142, 245–256, 2017.
2 March 2020). Jolivet, R., Grandin, R., Lasserre, C., Doin, M.-P., and Peltzer, G.:
Systematic InSAR tropospheric phase delay corrections from
global meteorological reanalysis data, Geophys. Res. Lett., 38,
L17311, https://doi.org/10.1029/2011gl048757, 2011.
Author contributions. RX conceived and designed the experi-
Li, Z., Muller, J.-P., Cross, P., and Fielding, E. J.: Interferometric
ments. RX and CY performed the experiments and analyzed the
synthetic aperture radar (InSAR) atmospheric correction: GPS,
results. RX wrote the manuscript and the whole team provided sug-
Moderate Resolution Imaging Spectroradiometer (MODIS), and
gestions and reviewed the manuscript.
InSAR integration, J. Geophys. Res.-Sol. Ea., 110, B03410,
https://doi.org/10.1029/2004jb003446, 2005.
Li, Z. W., Xu, W. B., Feng, G. C., Hu, J., Wang, C. C., Ding, X.
Competing interests. The authors declare that they have no con- L., and Zhu, J. J.: Correcting atmospheric effects on InSAR with
flict of interest. MERIS water vapour data and elevation-dependent interpolation
model, Geophys. J. Int., 189, 898–910, 2012.
Murray, K. D., Bekaert, D. P. S., and Lohman, R. B.: Tropospheric
Special issue statement. This article is part of the special issue corrections for InSAR: Statistical assessments and applications
“TISOLS: the Tenth International Symposium On Land Subsidence to the Central United States and Mexico, Remote Sens. Environ.,
– living with subsidence”. It is a result of the Tenth International 232, 111326, https://doi.org/10.1016/j.rse.2019.111326, 2019.
Symposium on Land Subsidence, Delft, the Netherlands, 17–21 Wright, T., Parsons, B., and Fielding, E.: Measurement of inter-
May 2021. seismic strain accumulation across the North Anatolian Fault
by satellite radar interferometry, Geophys. Res. Lett., 28, 2117–
2120, 2001.
Acknowledgements. The authors thank the reviewers and editors Yu, C., Penna, N. T., and Li, Z.: Generation of real-
for their helpful comments. time mode high-resolution water vapor fields from GPS
observations, J. Geophys. Res.-Atmos., 122, 2008–2025,
https://doi.org/10.1002/2016jd025753, 2017.
Financial support. This research has been supported by the Na- Yu, C., Li, Z. H., Penna, N. T., and Crippa, P.: Generic Atmo-
tional Natural Science Foundation of China (grant no. 41804005), spheric Correction Model for Interferometric Synthetic Aperture
the Fundamental Research Funds for the Central Universities (grant Radar Observations, J. Geophys. Res.-Sol. Ea., 123, 9202–9222,
no. 2019B17414), and the Natural Science Foundation of Jiangsu https://doi.org/10.1029/2017jb015305, 2018.
Province (grant no. BK20170869). Ruya Xiao received support
from the Chinese Scholarship Council (ref. 201806715019).
References
Bekaert, D. P. S., Hooper, A., and Wright, T. J.: A spa-
tially variable power law tropospheric correction technique
for InSAR data, J. Geophys. Res.-Sol. Ea., 120, 1345–1356,
https://doi.org/10.1002/2014jb011558, 2015.
Costantini, M., Ferretti, A., Minati, F., Falco, S., Trillo, F.,
Colombo, D., Novali, F., Malvarosa, F., Mammone, C., Vecchi-
oli, F., Rucci, A., Fumagalli, A., Allievi, J., Ciminelli, M. G., and
Costabile, S.: Analysis of surface deformations over the whole
Italian territory by interferometric processing of ERS, Envisat
and COSMO-SkyMed radar data, Remote Sens. Environ., 202,
250–275, 2017.
Ferretti, A., Prati, C., and Rocca, F.: Permanent scatterers in
SAR interferometry, IEEE T. Geosci. Remote, 39, 8–20,
https://doi.org/10.1109/36.898661, 2001.
Proc. IAHS, 382, 213–218, 2020 proc-iahs.net/382/213/2020/You can also read