Assessment of investment in electric buses: A case study of a public transport company - De Gruyter
←
→
Page content transcription
If your browser does not render page correctly, please read the page content below
Open Engineering 2021; 11: 907–914
Research Article
Jana Fabianova* and Jaroslava Janekova
Assessment of investment in electric buses:
A case study of a public transport company
https://doi.org/10.1515/eng-2021-0089 investments in environmentally friendly technologies and
received June 18, 2021; accepted July 24, 2021 the introduction of greener, cheaper and healthier forms of
Abstract: This case study presents an assessment of the private and public transport [1–4]. Strategies of local autho-
efficiency and risk of the vehicle fleet renewal in the public rities and urban transport companies, as well as the urban
transport company. The investment project is solved in transport organization itself, play an important role in intro-
two alternatives. The first alternative consists of vehicle ducing low-emission vehicles into public transport [5].
replacement by only electric buses. In the second alterna- In the professional literature, several authors [6,7]
tive, a combination of electric buses and CNG buses is address the issue of introducing low-emission vehicles
considered. Assessment of the economic efficiency of the into public transport for reasons of improving air quality
investment project is based on the net present value in the city, reducing noise pollution, and subsequent
(NPV). Due to lower initial and ongoing capital expendi- passenger satisfaction. The authors [8] present the com-
tures, the second alternative is more cost-effective than the pilation of a fleet electrification plan in a cost-effective
first one although the profitability of the investment pro- way, taking into account investment costs (IC), operat-
ject is low. Within risk assessment, sensitivity analysis ing costs, and investments in charging infrastructure.
points out the subsidy and personal costs as the risk fac- This problem is modelled as an integer linear problem.
tors influencing variance of NPV the most. Finally, the Krawiec [9] emphasizes the need for correct formulation
effectiveness of the investment project is assessed at dif- and description of the process of conversion of the public
ferent levels of the use of financial support from EU funds transport fleet and recommends the use of methods such
and the state budget. In that case, even a low level of as identification model based on statistical methods,
financial support significantly increased the profitability optimization model based on multi-criteria optimiza-
of the project. tion methodology, interaction model based on discrete
Markov chain methods and economic models, allowing
Keywords: green investing, electric buses, transport, a realistic consideration of the proposed solution based
simulation on simulation methods.
Several authors focus on technical and economic
evaluation and mutual comparison of variants of bus fleet
renewal in public transport in order to increase its envir-
1 Introduction onmental friendliness. This problem is solved in different
ways. Pietrzak and Pietrzak [10] identify and analyse the
The EU aims to achieve climate neutrality by 2050. The economic impacts of the implementation of zero-emis-
European Green Deal supports, among other measures, sion buses in the city. Meishner and Sauer [11] examine
four technological concepts for the introduction of electric
buses. From a technical point of view, they are considering
charging batteries in a very fast and medium-demanding
* Corresponding author: Jana Fabianova, Technical University of
Kosice, Faculty of Mining, Ecology, Process Control and way, charging overnight and powered via an overhead con-
Geotechnology, Institute of Logistics and Transport, tact line/battery (trolleybus hybrid buses). The economic
Park Komenskeho 14, 042 00 Kosice, Slovak Republic, evaluation is based on the total cost of ownership (TCO)
e-mail: jana.fabianova@tuke.sk and risk consideration is through sensitivity analysis. Topić
Jaroslava Janekova: Technical University of Kosice, Faculty of
et al. [12] have developed a simulation tool for bus electri-
Mechanical Engineering, Institute of Industrial Engineering,
Management and Environmental Engineering, Department of
fication planning, which allows one to calculate the optimal
Industrial and Digital Engineering, Park Komenskeho 9, 042 00 type and number of electric buses, charging stations and to
Kosice, Slovak Republic, e-mail: jaroslava.janekova@tuke.sk predict TCO, including ICs and operating costs.
Open Access. © 2021 Jana Fabianova and Jaroslava Janekova, published by De Gruyter. This work is licensed under the Creative Commons
Attribution 4.0 International License.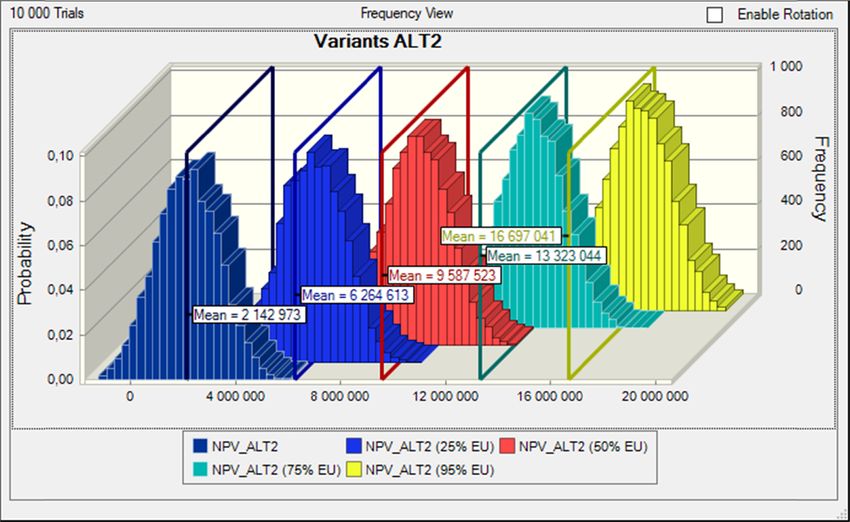
908 Jana Fabianova and Jaroslava Janekova
Topal and Nakir [13] proposed a dynamic model Košice public transport company (DPMK) operates public
based on TCO for diesel, CNG and electric buses. They transport in the form of bus and tram transport. The
assessed the economic efficiency of the investment options transport company has a total of 216 buses. There are
using the financial criteria net present value (NPV), 23 electric buses and the others are for compressed gas
internal rate of return and payback period. The authors or diesel. For accounting, the service life of buses is cal-
have shown that price differences in the purchase prices of culated at 10 years but many are used longer. The opera-
buses can be offset by savings in operating costs for electric tion of old vehicles is unsatisfactory in terms of quality,
buses. Thus, the trend of sustainable public transport is safety, reliability and, last but not least, in terms of
moving towards the concept of electric buses. The economic ecology. DPMK currently operates 32 buses older than
efficiency of the replacement of electric bus batteries, 10 years for regular passengers transport. We consider
including the sensitivity analysis, is addressed by Zhang their replacement with new vehicles to be the necessary
and Chen [14] and the analysis of scenarios in ref. [15]. minimum regarding the renewal of the vehicle fleet. The
Dahlgren and Ammenberg [16,17] used the multi- structure of the vehicle fleet is shown in Figure 1.
criteria assessment (MCA) method to assess the sustain- Due to the preference of the ecological aspect when
ability of bus transport technologies, which includes choosing vehicles, the purchase of electric buses or buses
technical, economic, environmental and social perfor- on compressed natural gas is being considered. The fol-
mance. MCA is implemented for various bus technolo- lowing alternatives are considered for the purchase of
gies, i.e. powered by diesel, hydrogenated vegetable oil, new vehicles:
fatty acid methyl ester, ethanol, and natural gas (bio- • ALT1: Replacement of end-of-life buses with SOR NS 12
methane and electricity). Ankenman et al. [18] and Zitricky electric buses.
et al. [19] propose an integrated resource planning frame- • ALT2: Replacement of buses after a lifetime with a com-
work, taking into account investment and operating costs bination of SOR NS 12 electric buses and SOR NBG 18
and an aggregation strategy for optimizing the charging of CNG buses, which are a more environmentally friendly
electric buses on different routes. alternative to diesel buses and at the same time cheaper
The aim of the paper is to assess an investment in the than electric buses.
vehicle fleet renewal in a public transport company. The
economic efficiency of the investment project is assessed
via the NPV indicator and using Monte Carlo simulations.
3 Materials and methods
When evaluating the investment in the renewal of the
2 Case study description vehicle fleet, we use the published annual reports of
DPMK [20], which provide basic information on the com-
This case study examines the effectiveness and risk of pany’s management, the amount and structure of costs
investing in fleet renewal in a transport company. The and revenues. The most important income and expense
70
60
50
40
30
20
10
0
SOR SOR NB SOR SOR BN SOR NB IVECO IRISBUS Tedom Solaris Solaris Karosa
EBN 11 18 City EBN 9.5 12 City First CITELIS C12 Urbino Urbino B732
10.5 FCLLI 18m 12 15
CNG
Number of Buses Average Age (Years)
Figure 1: The fleet structure [20].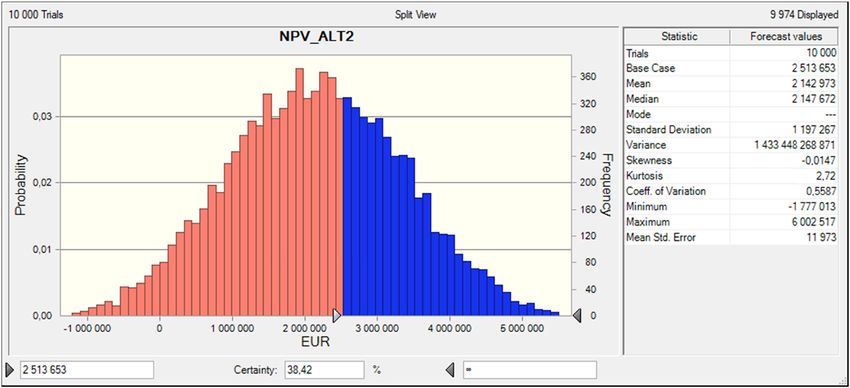
Assessment of investment in electric buses 909
Table 1: Selected revenue and expense items for the period 2016–2019 [20]
Indicator in EUR 2016 2017 2018 2019
Revenues Revenues from one-off travel tickets 3,561,117 3,291,580 3,293,922 3,558,402
Revenues from time travel tickets 5,397,057 5,355,451 5,302,868 5,738,533
Revenues from invoiced transport 1,025,727 927,017 881,024 1,110,869
Revenues from travel tickets via SMS 937,215 958,771 973,617 1,128,382
Revenues from electronic valet 1,627,677 1,564154 1,544,120 1,665,749
Other revenues 6,708 2,920 1,122 1,243
Subsidy from the city budget 16,020,000 17,263,860 19,176,076 20,700,000
Costs Consumed purchases (material, fuel, energy, etc.) 8,201,876 9,957,963 11,046,737 11,295,190
Services 2,193,201 1,932,475 2,602,575 2,131,209
Personal costs 15,820,283 16,365,672 18,391,858 19,894,813
Depreciations 7,177,784 7,586,674 7,771,557 7,604,470
Other costs 3,336,092 2,602,684 2,540,309 1,553,412
items, which represent the most important component of BetaPERT, which has been defined by likeliest, minimum
cash flows (CFs), are presented in Table 1. and maximum values. Using Monte Carlo simulations,
The investment in fleet renewal will be assessed on the uncertainty of these risk factors is transferred to the
the basis of the financial indicator NPV (1), which will be uncertainty of the NPV calculation, thus integrating the
forecasted using the Monte Carlo simulations technique: investment risk into the overall investment assessment.
N As mentioned above, in alternative 1, all decommis-
CFn
NPV = ∑ − IC (1) sioned buses will be replaced by electric buses. Electric
n=1
(1 + dr )n
buses are about 2.5 times more expensive compared to
CFn = EBIDTAn × (1 − tn) + Dn × dr (2) diesel buses. In addition, when operating transport, it is
where CF is the annual cash flow; dr the discount rate; IC necessary to take into account the time for charging vehi-
the amount of one-off investment costs; EBITDA the cles, which shortens the time available for their opera-
earning before interest, tax, depreciation and amortiza- tion. For this reason, it is not possible to replace diesel
tion; D the yearly depreciation; t the coefficient of income buses with 1:1 electric buses but it is necessary to increase
tax rate; N the economic lifetime of the investment; and n the number of vehicles; in our case, we are considering
the number of years of the economic lifetime of the an increase of 15%, i.e. the number of purchased buses is
investment. increased to 37.
In determining the statistical characteristics of prob- In alternative 2, the renewal of vehicles is considered
abilistic functions of risk variables, we use the develop- by purchasing partly electric buses and partly CNG buses.
ment of economic variables for previous periods. The risk Buses with a capacity of up to 100 people will be replaced
factors for which the parameters of the distribution func- by nine electric buses (15% higher than the number of
tion were set are in Table 2. The distribution used is decommissioned buses) and buses with a capacity of 150
Table 2: Probability distributions and statistical parameters in EUR
Variables Probability distribution Parameters
Min. Likeliest Max.
One-off travel tickets BetaPERT 3,500,000 3,700,000 3,800,000
Time travel tickets BetaPERT 5,300,000 5,700,000 6,000,000
SMS tickets BetaPERT 1,200,000 1,300,000 1,400,000
Electronic valet BetaPERT 1,550,000 1,600,000 1,700,000
Subsidy BetaPERT 19,000,000 20,700,000 22,000,000
Consumed purchases BetaPERT 10,000,000 11,200,000 12,000,000
Personal costs BetaPERT 17,900,000 19,800,000 21,500,000
Services BetaPERT 1,900,000 2,131,000 2,200,000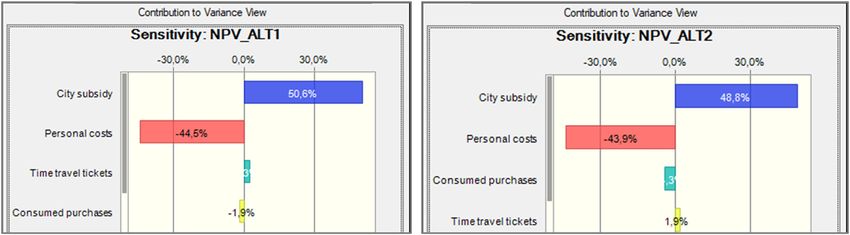
910 Jana Fabianova and Jaroslava Janekova
Table 3: Number of buses after lifetime and alternatives for their renewal
ALT 1 ALT 2
Current types of buses Electric buses Electric buses + CNG buses
Type Number Drive Capacity Type Number Capacity Type Drive Number Capacity
(pcs) (persons) (pcs) (persons) (pcs) (persons)
Solaris 24 diesel 150 SOR 37 105 SOR CNG 24 150
Urbino 15 NS 12 NBG 18
Solaris 2 diesel 100 SOR EL 9 105
Urbino 12 NS 12
Tedom C12 5 CNG 88
Karosa 1 diesel 90
B732
people will be replaced by CNG buses in the same number 160,000. One-off ICs for the procurement of buses and
as decommissioned buses (24 vehicles in total). The the replacement of batteries are in Table 4.
method of fleet renewal for individual alternatives is in
Table 3.
The mathematical model for the calculation of NPV is
developed for 10 years, which is the expected service life
of vehicles. For electric buses, it is necessary to consider
4 Results
that the battery has a shorter lifespan and needs to be
replaced after approximately 6 years. Due to this, the 4.1 Forecast NPV: ALT1 and ALT2
additional one-off investment in new batteries must be
expected after the 6th year, which is estimated at EUR By using Monte Carlo simulation, we obtained a forecast
80,000. The estimated price of the electric bus is EUR of NPV for a period of 10 years (Figure 2). According to
589,000 and that of the CNG bus is EUR 400,000. In the results, it is clear that even after 10 years of using
the mathematical model for the calculation of NPV, an electric buses, the CF from the investment will not have a
appropriate amount of costs and revenues belonging to positive value. The mean value of the NPV indicator is
the renewed part of the vehicle fleet is considered, which EUR (−3,841,346). The indicator of investment risk is the
represents 15% of the total costs and revenues. Only the standard deviation (σ), which amounts to EUR 1,184,999.
costs of consumed purchases, in which the fuel has the In practice, this represents a 68% reliability of reach-
largest share, have changed. As the electricity costs for ing the NPV level in the range of EUR (−2,656,347)
electric buses represent approximately 30% of the fuel to (−5,026,345). Exceeding the calculated value of NPV
costs for diesel buses, these costs have therefore been (−3,414,357) is, according to the simulation, probably
reduced by a coefficient of 0.4 for diesel buses and by a only 37%.
coefficient of 0.6 for CNG buses. The calculation of the NPV forecast for alternative 2 is
When evaluating the investment, the cash income also for 10 years. With this method of vehicle replace-
from the sale of decommissioned buses is further consid- ment, the NPV will reach a positive value after 10 years
ered. At an average price of EUR 5,000 per used vehicle, of life, the mean value of the NPV is EUR 2,142,973. The
the cash income from the sale of vehicles will be EUR standard deviation is EUR 1,197,267. The range of NPV
Table 4: One-off ICs for individual alternatives
Vehicle type Price (EUR/pc) Number ICs: 0th year (EUR) Number of Price ICs: 6th year (EUR)
(pcs) batteries (pcs) (EUR/pc)
ALT 1 SOR NS 12 589,000 37 21,793,000 37 80,000 2,960,000
ALT 2 SOR NS 12 589,000 9 5,301,000 9 80,000 720,000
SOR NBG 18 400,000 24 9,600,000 0 0 0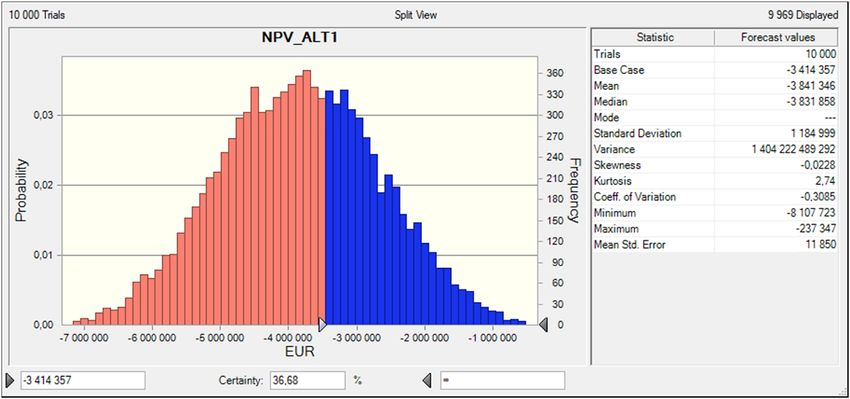
Assessment of investment in electric buses 911
Figure 2: Histogram NPV pre-ALT1 NPV histogram for ALT1.
values for the mean ± σ interval is EUR 945.706 to of their total value. Subsidies contribute both in ALT1 and
3,340,240. The histogram of the NPV prognosis is in ALT2 to the NPV variance in about 50% and personnel
Figure 3. costs in 44%. The third factor contributing to the total
CF at ALT1 is negative throughout the lifetime of the NPV variance is different. In ALT1, they are returns from
investment whereas at ALT2 it is positive since the 9th time tickets, and in ALT2 it is consumed purchase.
year. An overview of the accumulated discounted CF
for the entire lifetime period for both alternatives is in
Table 5.
The sensitivity analysis (Figure 4) points to those risk 4.2 Evaluation of NPV: financing with the EU
factors whose uncertainty most influences the uncer- and the state financial support
tainty of NPV. The figure presents risk factors that con-
tribute to the NPV variance of more than 1%. According to High ICs and probable loss, or at the best low return on
simulations, they are revenues from the city subsidy and investment, motivate companies to look for other sources
personnel costs. These items are also the highest in terms of financing for investments in vehicles. EU pressure to
Figure 3: NPV histogram for ALT2.912 Jana Fabianova and Jaroslava Janekova
Table 5: Accumulated discounted CF over the lifetime of the investment
Year CF in ‘000 EUR
1 2 3 4 5 6 7 8 9 10
ALT1 −20,055 −18,318 −16,427 −14,383 −12,190 −12,269 −10,234 −8,091 −5,841 −3,414
ALT2 −13,403 −11,898 −10,231 −8,403 −6,420 −5,464 −3,645 −1,711 336 2,513
introduce clean public transport vehicles and to replace Transport Company used funds from the EU and the state
existing diesel buses with alternative propulsion vehi- budget to purchase electric buses, which covered up to
cles, namely low- or zero-emission vehicles, is accompa- 95% of investment expenditures.
nied by opportunities for financial support from EU funds, Such support will significantly change the com-
which transport companies also use. For example, the pany’s financial situation and the return on investment.
Transport enterprise of the city of Zilina or Bratislava Figures 5 and 6 show NPV forecasts for both alternatives
Figure 4: Sensitivity analysis.
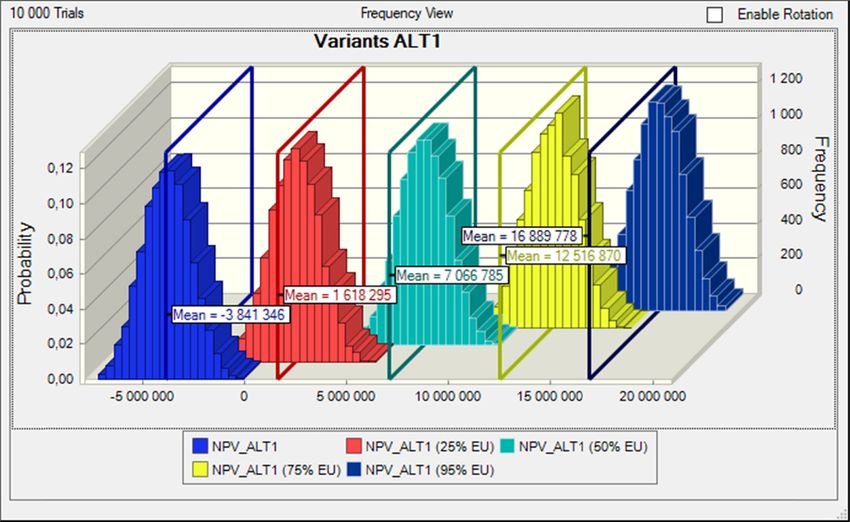
Figure 5: NPV_ALT1 at different levels of investment financing support.Assessment of investment in electric buses 913
Figure 6: NPV_ALT2 at different levels of investment financing support.
if 25, 50, 75, and 95% finance support of investment has based on the NPV indicator. Assuming that the company’s
been used. From the overlay charts in Figures 5 and 6, we activities will be financed only by current resources (own
can see that the support of 25% leads to a positive NPV resources and city subsidies), the NPV did not reach a
value for ALT1 after the 10th year. With the funding sup- positive value even after the 10th year of life. In the second
port of 95%, NPV will increase up to EUR 16,889,778. With alternative, the renewal was made by the combination of
ALT2, the NPV is growing slower than in ALT1, and with electric and CNG buses.
95% funding support, NPV reaches almost the same level. Due to lower initial and ongoing capital expenditures,
the second alternative was more cost-effective than the first
one. NPV was positive at the end of life, but it was not until
the 9th year of life that the discounted accumulated CF
5 Conclusion turned positive. Different levels of financial support from
other sources (EU funds and the state budget) were also
The EU’s requirements under the European Green Deal examined. With the financing support of 95%, which is
also apply to intra-city road public transport. Reducing funding that other transport companies used for the pur-
emissions from public transport is only possible by repla- chase of electric buses, NPV reached a value of more than
cing the currently most widely used diesel buses with 16 mils EUR for both alternatives. But even a lower level of
vehicles powered by alternative propulsion, electricity, support has significantly improved the efficiency of the
or compressed natural gas. However, the renewal of the investment. That should motivate transport companies to
vehicle fleet by electric buses is too expensive. For this apply for these resources and contribute to sustainable
reason, it is difficult to manage this investment without low-emission public transport with clean vehicles.
the state support or support of European institutions.
The case study presents a proposal and assessment of
an investment in the vehicle fleet renewal in the Košice Acknowledgements: This work was supported by grant
public transport company. The investment project has projects VEGA 1/0600/20, VEGA 1/0638/19, KEGA 012TUKE-
been solved in two alternatives. The first alternative con- 4/2019, VEGA 1/0340/21 and KEGA 009TUKE-4/2020.
sisted of end-of-life vehicles replacement by electric buses.
The economic evaluation of the investment was assessed Conflict of interest: Authors state no conflict of interest.914 Jana Fabianova and Jaroslava Janekova
References [11] Meishner F, Sauer DU. Technical and economic comparison of
different electric bus concepts based on actual demonstra-
[1] Dočkalíková I, Cempírek V, Indruchová I. Multimodal transport tions in European cities. IET Electr Syst Transp.
as a substitution for standard wagons. LOGI 2019-horizons of 2020;10:144–53.
autonomous mobility in Europe. Transp Res Procedia. [12] Topić JT, Soldo J, Maletić FM, Škugor B, Deur J. Virtual simu-
2020;44:30–4. lation of electric bus fleets for city bus transport electrification
[2] Strohmandl J, Čujan Z. Risk minimisation in integrated supply planning. Energies. 2020;13:3410.
chains. Open Eng. Jan. 2019;9(1):593–9. [13] Topal O, Nakir I. Total cost of ownership based economic
[3] Nikolicic S, Maslaric M, Strohmandl J, Mircetic D. Logistics analysis of diesel, CNG and electric bus concepts for the public
performance and transport infrastructure. Proceedings of the transport in Istanbul city. Energies. 2018;11:2369.
3rd Logistics International Conference. Belgrade: Univ Belgrade, [14] Zhang C, Chen P. Economic benefit analysis of battery char-
Fac Transport And Traffic Engineering; 2017. p. 142–7. ging and swapping station for pure electric bus based on dif-
[4] Kalupová B, Hlavoň I. Intelligent transport systems in the ferential power purchase policy: a new power trading model.
management of road transportation. OEng. 2016;6(1):62. Sustain Cities Soc. 2021;12:1–13.
[5] Taczanowski J, Kołoś A, Gwosdz K, Domański B, Guzik R. The [15] Velickovic M, Stojanovic D, Nikolicic S, Maslaric M. Different
development of low-emission public urban transport in urban consolidation centre scenarios: Impact on external
Poland. Bull Geogr Socio-econ Ser. 2018;41:79–92. costs of last-mile deliveries. Transport. 2018;33:948–58.
[6] Fedorko G, Molnar V, Honus S, Neradilova H, Kampf R. The [16] Ammenberg J, Dahlgren S. Sustainability assessment of public
application of simulation model of a milk run to identify transport, part I-A multi-criteria assessment method to com-
the occurrence of failures. Int J Simul Model. Sep. pare different bus technologies. Sustainability.
2018;17(3):444–57. 2021;13(2):825.
[7] Kodym O, Kavka L, Sedláček M. Logistic chain data processing. [17] Dahlgren S, Ammenberg J. Sustainability assessment of public
Int Multidiscip Sci GeoConference Surv Geol Min Ecol Manag transport, part II-applying a multi-criteria assessment method
SGEM. 2015;1(2):183–90. to compare different bus technologies. Sustainability.
[8] Pelletier S, Jabali O, Mendoza JE, Laporte G. The electric bus 2021;13(3):1273.
fleet transition problem. Transp Res part C-emerging Technol. [18] Ankenman BE, Bekki JM, Fowler J, Mackulak GT, Nelson BL,
2019;109:174–93. Yang F. Simulation in production planning: an overview with
[9] Krawiec K. Basic methods to support city bus fleet conversion emphasis on recent developments in cycle time estimation.
towards a 100% electric bus fleet. TRANSBALTICA XI: Int Ser Oper Res Manag Sci. 2011;151:565–91.
Transportation Science and Technology. Cham: Springer; [19] Zitricky V, Gasparik J, Peceny L. The methodology of rating
2019. p. 89–98. quality standards in the regional passenger transport.
[10] Pietrzak O, Pietrzak K. The economic effects of electromobility Transp Probl. 2015;10:59–72.
in sustainable urban public transport. Energies. 2021;14:878. [20] https://www.dpmk.sk/dpmk/vyrocne-spravyYou can also read