ASSET MANAGEMENT PLAN 2020-29 - BUILDINGS - Mosman Council
←
→
Page content transcription
If your browser does not render page correctly, please read the page content below
MOSMAN
      ASSET
MANAGEMENT
PLAN 2020-29
      BUILDINGS

    Adopted by Council 6 October 2020
Asset Management Plan - Buildings 2020–2029   3

CONTENTS

INTRODUCTION                                                                              04

LEVELS OF SERVICE                                                                         08

FUTURE DEMAND                                                                             16

CURRENT STATE OF ASSETS                                                                   18

LIFECYCLE MANAGEMENT PLAN                                                                 27

FINANCIAL SUMMARY                                                                         42

RISK MANAGEMENT PLAN                                                                      48

ASSET MANAGEMENT PRACTICES                                                                50

PLAN IMPROVEMENT AND MONITORING                                                           52

REFERENCES                                                                                54

APPENDICES                                                                                55
APPENDIX A – LIST OF BUILDINGS & MAP                                                      56
APPENDIX B – BUILDINGS ASSETS 10 YEAR LIFECYCLE FINANCIAL FORECASTS                       61
APPENDIX C – BUILDINGS DRAFT CAPITAL WORKS PROGRAM 2019/20–2028/29                        62
4
INTRODUCTION
Background Goals and Objectives of Asset
The Mosman local government area is located in Sydney’s Management
northern suburbs, around 6 kilometres from central Council’s goal in managing infrastructure assets is to
Sydney. The Council area is predominately residential with provide equitable and appropriate services and facilities
commercial areas along Military Road. The Council area for the community and ensure they are managed
includes significant areas of Sydney Harbour foreshore. efficiently and effectively and are of a quality consistent
Early settlement in Mosman dates from the 1800s, but with requirements of the Mosman community.
the development of the area was slow until the 1880s
when road access was improved. Significant growth in The key elements of infrastructure asset management are:
Mosman occurred in the interwar period as well as the
Consider a life cycle approach
1950s and 1960s when many residential flat buildings
were constructed. Since this period, growth has slowed as Develop cost-effective management strategies for the
development opportunities have become fewer. long term
Assets not included in this Plan are those within State Provide a defined level of service and monitoring
and Federal government lands including HMAS Penguin, performance
National Parks, Sydney Harbour Federation Trust and Understanding and meeting the demands of growth
Taronga Zoo. through demand management and infrastructure
investment
The purpose of this Asset Management Plan (AMP) is
to have a guide to managing building structures safely, Sustainable use of physical resources
efficiently and effectively for the people of Mosman. This
Continuous improvement in asset management
AMP outlines the broad approach that will be adopted to
practices
manage the condition of and use of building assets over
the next 10 years, including the capital works program. This asset management plan sets out goals and objectives
over a 10 year period:
Aim to have Council’s unrestricted current ratio at 2:1
COVID-19
Seek to meet benchmarks, e.g. sustainability financial
The assets values, data and modelling that informed
indicator of greater than 1.0, backlog ratio less than 2.0%
the Asset Management Plans was done prior to the full
and maintenance ratio greater than 100%
ramifications of the COVID-19 pandemic being known.
Due to the variability in market conditions during this time, To have business systems which will meet the increasing
it is recommended that the Buildings AMP be reviewed demands for management information and that add
and updated in 18 months’ time to account for any value to the Council and community by providing
changes. This has also been included in the Policy as a key integrated, accurate, timely, cost-effective and
performance measure. responsive service
To have risk management strategies in place to ensure
Mosman is a safe place to live, work and play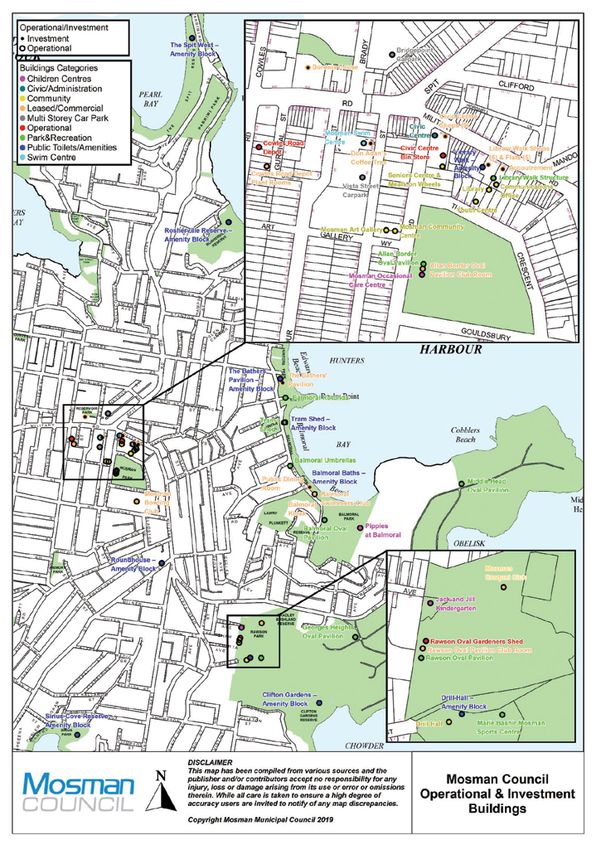
Asset Management Plan - Buildings 2020–2029 5
Asset Management Plan Framework The key points from the Asset Management Policy are:
In accordance with the NSW government’s Integrated Assets are to be managed (from creation, through
Planning and Reporting framework, Mosman Council’s operation to disposal) in accordance with the Council’s
Community Strategic Plan (2018-2028), named objectives and priorities for service delivery
MOSPLAN, presents a broad outline of Mosman Council’s
aspirations for serving its residents, based on community Each infrastructure asset class (buildings, roads,
engagement. stormwater drainage, parks and open space, marine
structures) has an asset management plan
MOSPLAN’s Resourcing Strategy ensures there are
Outlines human resource needs and staff roles and
adequate financial, human resources and assets to
responsibilities
deliver the Council’s services over 10 years. The Asset
Management Framework (see Figure 1) outlines the asset The asset management strategy is to be implemented to
component of the Resourcing Strategy. apply asset management best practice
The Asset Management Framework is guided by the Asset Council will promote continuous improvement in asset
Management Policy and Asset Management Strategy. management
Figure 1 – Asset Management Framework
6
The Asset Management Strategy is a guide to the content Summary of Buildings Assets
of the asset management plans, relevant legislation,
Council’s buildings provide a range of important benefits
risk management and asset information systems within
to the community, which include:
Council and a broad overview of each plans financial
forecasts. This Asset Management Plan is in accordance Operational facilities for the administration of local
with the Asset Management Strategy. government and delivery of related services
The Asset Management Plans guide the yearly capital Facilities for recreation and maintaining a healthy lifestyle
works and maintenance budgets and provides important
An important focal point for social interaction helping to
input into Council’s Long Term Financial Plan.
develop and strengthen the local community
Mosman Council manages 51 buildings and facilities.
Some buildings have multiple facilities within which serve
different needs. Where multiple facilities exist within one
building, each facility has been assessed separately.
The Buildings asset data including values and condition
ratings were initially captured in 2013 and then verified and
updated in 2017 by a qualified valuer.
The Current State of Assets section and Appendix A
provides further details of the Council buildings covered
by this Plan.
Current Replacement Cost
Number of Buildings (CRC) ‘000s ($)
51 97,026
Table 1 – Summary of Buildings Assets (as at June 2019)
Asset Management Plan - Buildings 2020–2029 7
8
LEVELS OF SERVICE
Description The objectives of the levels of service in this Buildings
Asset Management Plan are intended to:
Levels of service provide the basis for life cycle
management strategies and works programs. They intend Inform the community of the proposed type and level of
to align measurable attributes to the corporate objectives service to be offered
of the organisation.
Assist with the identification of the costs and benefits of
They must be readily measurable, and easily understood the services being offered
by members of the community. There is ongoing
Enable the community to assess suitability, affordability
development of levels of service to address the reasonable
and equity of the services offered
needs and expectations of the community.
Provide a measure of the effectiveness of the asset
The key performance measures in this Buildings AMP management plan
are quality, availability, health & safety, appearance/
presentation, responsiveness, condition and cost/ Provide focus for the development of the asset
affordability. They also take into account the relevant management strategies
legislative framework and standards and codes. Provide guidance for current and future services to be
offered, the manner of the service delivery and definition
of the specific levels of service which the organisation
wishes to achieve
The levels of service outlined in this section are based on:
Information gathered and interpreted from customers
on the importance of and satisfaction with services and
in some cases expected quality and cost of services
Information obtained from expert advice on asset
condition and performance capacity
Strategic and corporate goals
Legislative requirements
Regulations, environmental standards and industry
and Australian Standards that specify minimum design
parameters for infrastructure delivery
Availability of resources and the financial environment
Asset Management Plan - Buildings 2020–2029           9

Feedback from the Community                                      Legislative Requirements
Council regularly conducts community surveys to                  Council has to meet many requirements including National
determine the importance and satisfaction with                   and State legislation and regulations. These are listed in
infrastructure and services. The latest Mosman Community         Council’s Asset Management Strategy document.
Survey was conducted in June 2018.

Residents were asked a series of questions to inform the
review of service delivery standards to be implemented
in the Strategic Management Plans including MOSPLAN,
Delivery Program, Operational Plan and Asset
Management Plans. Community feedback provides
guidance in developing priorities and allocation of
resources in the budget.

Satisfaction for building-related services and facilities is
good. In regards to the cleanliness of the buildings, on
average, Council receives a small number of complaints
per year, which is relatively low compared to the large
number of Council buildings accessible to the public.
The community, however, has expressed some level of
dissatisfaction with the condition of the public toilets. This
dissatisfaction is rectified by the conducting of capital
works for these buildings in the 2019/20 financial year.

See the Levels of Service Matrix (Table 4) for the full
comparison between our performance targets and current
performance.

10
Asset Management Plan - Buildings 2020–2029 11
Asset Rating Systems Appearance - Is appearance acceptable?
Condition Ratings Structural Integrity - Does the structure appear sound
The condition rating scale used for buildings assets is and acceptable?
the 1-5 rating approach as defined by the IPWEA and is In assessing condition limited high-level consideration has
detailed below in Table 2. also been given to:
Buildings asset condition assessment considers: Fitness For Purpose - an assessment of an asset match
to its current or intended use, and
Fitness For Use - an assessment of the physical condition
of the facility assets relative to their condition when first Environmental Fitness - an assessment of the condition
constructed or refurbished. of an asset relative to sustainability principles and goals.
In assessing the “Fitness For Use” condition of the various Assets in condition 1 to 3 are considered to be in a
facility assets the following criteria were considered: “satisfactory” condition while those in condition 4 and 5
are considered to be in an “unsatisfactory” condition. The
Health and Safety - Is there potentially health and/or condition ratings were determined by the community
safety risk? via the Mosman Asset Management Reference Group in
Security - Is there a security risk? 2011/12. The descriptions determined by the group have
been reviewed regularly and remain consistent to how the
Operation or Functionality - Does it operate or function
condition rating would be described today. The service
satisfactorily?
levels determine what the condition the asset should be in
Amenity - Is the level of amenity acceptable? before it is renewed.
Condition Rating Description of Asset Condition
“Satisfactory” Condition
Newly constructed/refurbished/ asset very good in overall condition. Only planned
1 Excellent
maintenance required.
Asset in good overall condition. Minor maintenance works plus planned maintenance re-
2 Good
quired.
3 Average Asset in average overall condition. Moderate to significant maintenance required.
“Unsatisfactory” Condition
Asset in fair to poor overall condition. Failure likely in short to medium term. Significant
4 Poor
renewal/upgrade required.
5 Very Poor/ Failed Asset failed or failure imminent. Unserviceable.
Table 2 – Condition Rating Scale12
Intervention Program Key building’s service goals include:
Council adheres to a Condition 4 ‘Intervention’
Management and development of facilities to reasonably
program where assets that decline into a Condition 4
address the emerging needs and demands of the
(unsatisfactory) rating are scheduled to be renewed within
community
the next two financial years.
Provision and management of facilities to meet
The renewal intervention level was selected to optimise community accepted levels of service
the desired level of service, mitigate risk and optimise
Provision of community facilities which are accessible
maintenance and renewal expenditure. The aim is to
both physically and geographically by the whole
minimise assets in an ‘unsatisfactory’ condition.
community
Condition 4 assets will be added to the capital works
Provision of facilities which afford a high level of safety
program to be replaced within 2 years unless their
and security
failure does not pose a risk. Alternate funding or shifting
lower priority work to later years are two ways to ensure Management of facilities in a cost-effective and
condition 4 assets are replaced. sustainable manner
Maintenance of facilities to appropriate standards fit for
Condition 5 assets are to be replaced as soon as practically
their contemporary purpose through an appropriate mix
possible, especially if the asset poses a high risk.
of scheduled and responsive maintenance
To assess the Community & Technical Levels of Service,
Building Importance/Criticality a number of datasets are used to assess performance
against a set target:
In order to manage the Council’s buildings more
effectively, buildings have been categorised based on level Community satisfaction survey – Residents are asked
of importance and criticality. Table 3 provides an outline of how satisfied they are with Council’s facilities on a 0 to
the building categorisation. 10 scale (0 – lowest satisfaction, 10 - highest satisfaction).
Scores of 5 or higher indicate satisfaction.
Customer service complaints – Complaints and requests
Community and Technical are recorded for each asset category and tallied by
Levels of Service financial year.
Levels of Service are measured by criteria including Insurance claims and injuries/incidents – Incidents
feedback from the community, performance specified involving injury or damage to property are tallied by
in the lease of the building or by a standard industry financial year for each asset category. A record of
technical assessment. insurance claims resulted from these incidents are also
kept.
For each Key Performance Measure, the Council
determines the attributes to be measured (Measured Condition rating values from the asset register are
Attribute) and how it will be measured (Measurement used, as well. The percentage of assets in a satisfactory
Criteria). A target is set to meet the minimum required condition (i.e. 3 or better) are recorded.
levels of service (Performance Target). Current
Other measures are also compared based on various
Performance indicates whether the building is meeting
data.
that target.Asset Management Plan - Buildings 2020–2029 13
Category Description Standard Facility
A (Superior) High profile facility with “critical” results; facilities Newly constructed/ Art Gallery
with major local or regional significance; key refurbished/ asset in very Civic Centre public areas
heritage facilities; facilities with major public good in overall condition. Only
Library
interface; “marquee” buildings; facilities that planned maintenance required.
must meet very rigorous special requirements;
assets of high capability and construction/
finish; Criticality Rating Very High.
B (Above Facilities very important to government Asset in good overall condition. Community Centres
Average) operations including significant facilities and Minor maintenance works plus Senior citizen centres/
heritage facilities; facilities with significant planned maintenance required. Facilities
public interface; facilities needing to meet
Early childhood centres
special requirements; facilities needing good
public presentation and high quality working Civic Centre
environment; Criticality Rating High. Swimming centre
High profile investment
buildings
High use prominent public
toilets
Drill Hall
Marie Bashir Mosman
Sports Centre
C (Average) Non-critical facilities including most buildings Asset in average overall Public toilets
supporting typical/standard government condition. Moderate to Mens Shed
service delivery functions; functionally focused significant maintenance
Works/operations depots,
buildings; the lowest possible category for required.
workshops and offices
community facilities and heritage facilities;
Criticality Rating Medium. Public halls
Park amenity buildings
and clubrooms
Investment residential
dwellings and commercial
buildings
Grandstands
Rotunda
Esplanade Umbrellas
D (Basic) Non-critical facilities where very basic functional Asset in fair to poor overall Sheds/ bin stores
performance is acceptable; facilities that can condition. Failure likely in short Storage buildings
reasonably operate in very basic condition; to medium term. Significant
Kiosks
Criticality Rating Low. renewal/upgrade required.
Scoreboards
Shelters/pergolas
Pump houses
Plant rooms
E (Mothball) Building is no longer operational; it is dormant, Asset failed or failure imminent.
pending disposal, demolition etc. Criticality Unserviceable.
Rating Minimum.
Table 3 - Building Categories14
Key Performance Measured Measurement Performance Current
Measure Level of Service Attribute Criteria Target Performance
Community Levels of Service
Quality (Public Fit for purpose Condition of Customer >80% satisfactory 2018 Community
Toilets) facilities satisfaction surveys Survey – 88%
satisfied with
condition of public
toilets
Availability and Facilities are readily Degree of Unplanned Nil unplanned Achieved
Accessibility available and availability and closures closures
accessible accessibility
Health and Safety Facilities are safe No of injuries Reported injuries Nil Injuries due to 2018-19: 1
and free from hazards 2017-18: 1
hazards 2016-17: 2
2015-16: 1
Service failures Response for >90% failures Achieved
repairs attended within
specified period
Risk assessment Management of Undertake Risk treatments
risk treatments risk planning undertaken as
& treatments required
within designated
time frame as
described in risk
management plan
Affordability Rental charges of Requests for Percentage >90% lease Achieved
(Investment leased facilities are renewals of lease requests for lease renewal requests
Buildings) com-petitive and renewals
market relevant
Legislative Legal and statutory Compliance with Audit on legal 90% satisfactory Achieved
Compliance Compliance relevant legislation, and statutory
of facility regulations and compliance
management codes
Non-compliance Nil non-compliance Achieved
warnings per year warnings
Appearance and Facilities are Cleanliness CustomerAsset Management Plan - Buildings 2020–2029 15
Key Performance Measured Measurement Performance Current
Measure Level of Service Attribute Criteria Target Performance
Technical Levels of Service
Quality Facilities are Defects Number of 95% of 99.7% of all
buildings assets operational operational
in condition 3 or building assets buildings in
better in condition 3 or satisfactory
better condition
Quality Leased facilities Condition of Percentage of >95% finishes and 100% of all
(Investment are maintained finishes and finishes and fittings fittings condition 3 investment
Buildings) in condition fittings of various in condition 2 or better buildings in
relative to building categories of and 3 or better satisfactory
category buildings respectively condition
Health and Safety Facilities are free Compliance with Failure to Nil non compliance Achieved
from hazards essential services comply with
standards essential service
requirements
Table 4 - Levels of Service Matrix16
FUTURE DEMAND
Demographics and Growth Demand Management
The community of Mosman generates the demand for the Demand will be managed through a combination of
services provided by the building assets considered in this managing and improving existing assets. Some buildings
plan. will be renewed with improved accessibility, improved
fixtures and fittings and better internal services such as
The estimated population of Mosman as of 30 June 2018 lighting. These are covered in the renewal plan and the
was 30,877 people (http://profile.id.com.au/mosman). financial forecasts.
There is expected to be minimal population growth
over the next few years with a growth rate estimated Where necessary, management practices will also be put
at 82 people per year until 2036. There will be some in place to address demand issues and pressures. Demand
demographic shifts as the Mosman population ages, with management practices include non-asset solutions such
an overall increase in the proportion of residents aged as risk management, controlling or softening demand,
60 and over. Therefore, it is important that buildings insuring against risks and managing failures.
meet accessibility standards, especially for aged care and
seniors facilities. There is minimal demand for new buildings in Mosman
due to the modest population increases and limited
Given the high degree of urbanisation within Mosman it availability of land.
is likely that the demand will not exist for the expansion
of the existing infrastructure but for improved levels of When there are new or upgraded assets they are required
service (e.g. accessibility improvements) provided by these to be fully accounted for in the asset management plans
buildings. and financial forecasts. This includes ongoing operations
and maintenance costs throughout the assets life.
Heritage preservation is also a factor in the upgrading
of building assets. There are controls to how an existing
heritage building can be modified. These restrictions along
with the small number of available sites for building works
in the LGA means there is limited growth.
It is also expected due to demographic and lifestyle
changes that there will be an increased focus on
recreational facilities.Asset Management Plan - Buildings 2020–2029 17
Changes in Technology Impact of Climate Change & Other
Technology changes are forecast to affect the delivery of Environmental Factors
services during the next 5 years: There is continuing discussion about changing climate
conditions including increased rainfall, sea-level rise, and
Various product and equipment improvements may
magnitude and frequency of major weather events. It is
improve work efficiencies and provide cost savings
unlikely that climate change will affect building assets
Consideration will be given to installing energy and significantly during the period covered in this plan.
water-saving equipment for environmental responsibility However, an increasing number of high-intensity storms
and for cost-efficiency has the potential to damage building roofs and cause
leaks.
New building methods that are more efficient will
also be considered as part of the renewal/upgrade of Council has in place sustainability measures for buildings
buildings to reduce the impact of climate change. Examples include
In terms of information technology, further retrofitting Council buildings and multistorey car parks
improvements to the asset management system used with LED lights and the installation of solar panels on
by Council will ensure that condition surveys are more building roofs. Recycled building materials and porous
accurate, efficient and lead to increased data integrity. paving are also used throughout the LGA.
The asset management system currently has a GIS
system in place with tablet support. There are some
issues with conducting inspections via the tablet due
to data display limitations but this is expected to be
improved/eliminated
The asset management system has a high capability
for planning maintenance and operational works which
are not being utilised to its full potential. There will be
trialling on using these features during the next 5 years18
CURRENT STATE
OF ASSETS
Asset Information Investment – Buildings leased for commercial or
residential purposes. These buildings provide rental
Council Buildings
income for Council
Mosman Council buildings/facilities are listed as an
operational or investment building. They are defined as: Buildings are summarised below in Table 5 and Table 6, for
operational and investment buildings, respectively. These
Operational – Facilities for the administration of tables include condition ratings of each building, which is
local government, delivery of services, recreation or an average of all the components it comprises of (as of 30
community facilities that are managed and maintained June 2019). A detailed list of Council buildings/facilities is
by Council. All income from these buildings are part of also included in Appendix A.
Council’s total income
Operational Buildings Assessed Average Condition (1 to 5 Scale) Current Replacement Cost (CRC) ($)
Civic Centre 2 16,232,000
Seniors Centre & Meals on Wheels 3 1,046,000
Civic Centre Bin Store 3 64,000
Library 3 7,400,000
Library Annexe 3 494,000
Youth Centre 3 987,000
Library Walk Structure 2 407,000
Library Walk – Amenity Block 2 49,000
Mosman Art Gallery 3 5,289,000
Mosman Community Centre 2 5,289,000
Cowles Road Depot 3 2,356,000
Cowles Road Depot Plant Rooms 3 214,000
Bridgepoint Carpark 2 7,526,000
Vista Street Carpark 3 4,376,000
Alexander Ave Multipurpose Building 2 1,007,000
Allan Border Oval Childcare Centre * 3 474,000
Balmoral Childcare Centre † 2 963,000
Mosman Bowling Club 3 3,169,000
Mosman Croquet Club 2 339,000Asset Management Plan - Buildings 2020–2029 19 Operational Buildings Assessed Average Condition (1 to 5 Scale) Current Replacement Cost (CRC) ($) Mosman Swim Centre 3 5,707,000 Balmoral Swimmers Club 3 380,000 Drill Hall 2 1,178,000 Drill Hall – Amenity Block 2 236,000 Marie Bashir Mosman Sports Centre 2 4,805,000 Allan Border Oval Pavilion 4 1,066,000 Allan Border Oval Pavilion Club Room 4 355,000 Balmoral Oval Pavilion 3 909,000 Georges Heights Oval Pavilion 3 627,000 Middle Head Oval Pavilion 3 1,137,000 Rawson Oval Pavilion 3 1,266,000 Rawson Oval Pavilion Club Room 3 389,000 Rawson Oval Gardeners Shed 3 71,000 Balmoral Rotunda 2 364,000 Balmoral Umbrellas 1 66,000 Tram Shed 2 89,000 Tram Shed – Amenity Block 2 380,000 Balmoral Baths – Amenity Block 3 760,000 Clifton Gardens – Amenity Block 3 663,000 Rosherville Reserve – Amenity Block 2 486,000 Raglan St West - Amenity Block 3 198,000 Sirius Cove Reserve – Amenity Block 3 323,000 Balmoral Bathers Pavilion – Amenity Block 3 271,000 The Spit West – Amenity Block 3 244,000 * Allan Border Oval Child Care disused in 2019/20 and demolished along with Allan Border Oval Pavilion in 2020/21 † Balmoral Oval Child Care Centre demolished during 2019/20 Table 5 – Council Operational Buildings
20

      Operational Buildings                    Assessed Average Condition (1 to 5 Scale)   Current Replacement Cost (CRC) ($)

      Civic Centre Shops (Nos 1-9)             3                                           1,046,000

      Library Walk Shops (Nos 1-5)             3                                           702,000

      Library Walk Shops (Nos 6-10) & 5        3                                           1,976,000
      Residential Flats

      Boronia House                            3                                           3,295,000

      Swim Centre Cafe                         3                                           223,000

      Balmoral Baths - Kiosk                   3                                           760,000

      Balmoral Baths - Restaurant              3                                           1,900,000

      Balmoral Bathers Pavilion - Restaurant   3                                           7,473,000

     Table 6 – Council Investment Buildings
Asset Management Plan - Buildings 2020–2029 21
Asset Componentisation Sub-groups provide further categorisation. The asset
groups they are linked to are in brackets:
Council’s buildings are categorised into functional asset
groups and sub-groups to provide a framework for 1. Civic/Administration (Council Offices/Administration
maintenance scheduling and risk management. The Centre)
groups are:
2. Community (Cultural Facilities, Library, Specialised
1. Childcare Centres Buildings)
2. Council Offices/Administration Centre 3. Childcare Centres (Childcare Centres)
3. Council Works Depot 4. Operational (Council Offices/Administration Centre,
Council Works Depot, Specialised Buildings)
4. Cultural Facilities
5. Public Toilets/Amenities (Specialised Buildings)
5. Investment Buildings
6. Parks and Recreation (Other Buildings, Specialised
6. Library
Buildings)
7. Multi-Storey Car Park
7. Swim Centre (Other Buildings)
8. Other Buildings
8. Multi-Storey Car Park (Multi-Storey Car Park)
9. Specialised Buildings
9. Leased/Commercial (Investment Buildings, Other
Buildings, Specialised Buildings)
The asset component hierarchy divides the buildings into
7 components providing information about the extent,
valuation and condition of the parts of the building:
1. Structure
2. Roof
3. External Finishes
4. Internal Finishes
5. Fittings and Fixtures
6. Services
7. Site Features22
Condition & Age Profile
Condition Profile
The condition profile gathers the condition rating and
replacement value of each building component and then
graphs the rating against the components value. The
profile as of June 30, 2019, is shown in Figure 2.
For more information, see the Asset Valuation section,
which shows a more detailed breakdown of building
assets condition by replacement value.
Figure 2 – Buildings Assets Condition Profile as per Asset Value (CRC)Asset Management Plan - Buildings 2020–2029 23
Age Profile Some buildings are second or third generation assets
Unlike the condition profile, the age profile only looks having been renovated, reconstructed or upgraded on a
at the age of the entire building (i.e. since the building number of occasions in the past.
was first constructed) and not the age of the individual
The build date information that is available is listed in
components. The age profile is shown in Figure 3.
Appendix A.
The age of the Council’s building assets varies significantly.
Some original building structures date back 125 years e.g.
Boronia House – 150 years, the Art Gallery/Community
Centre – 120 years.
Figure 3 – Buildings Assets Age Profile as per Asset Value (CRC)24
Asset Valuation Building Assets Condition by
The value of buildings assets as at 30 June 2019 covered Replacement Value
by this asset management plan is summarised below. The The condition survey (by replacement value) as assessed
buildings assets were last revalued during the 2017/2018 in 2018/2019 is detailed in Table 8 and references the
financial year. Assets are valued at Brownfield rates. condition profile in Figure 2. Table 8 compiles condition of
buildings at the component level.
Currently, 1.0% of building assets (by asset replacement
value) are in an unsatisfactory condition. Assets in
condition 4 have been listed for renewal in 2019/2020 or
later.
Condition ratings for components of each building/facility
are held within the Council’s asset management system.
Depreciated Replacement
Current Replacement Cost Annual Depreciation ($/yr) Cost ($)
Operational 79,651 919 39,555
Investment* 17,375 - -
Total 97,026 919 39,555
* Investment buildings are not depreciated as they are revalued annually with any increment/decrement recognised as such in the Income
Statement of the Financial Statements.
Table 7 – Building Assets Valuation ($000’s)
Asset Group Condition 1 Condition 2 Condition 3 Condition 4 Condition 5
Operational 3,745 31,034 43,905 967 0
Investment* 0 0 17,375 0 0
* Limited data available for components of investment buildings.
Table 8 – Building Assets Condition by replacement value ($000’s)Asset Management Plan - Buildings 2020–2029 25
26
Asset Management Plan - Buildings 2020–2029 27
LIFECYCLE
MANAGEMENT PLAN
Lifecycle Strategy Service Deficiencies
The lifecycle management plan describes how Council Council’s services are generally provided to meet the
plans to manage the building’s assets at the agreed levels desired standard. There are instances where the level of
of service (information available in Levels of Service service is not being met and will need future investigation
section) while optimising life cycle costs. and this is detailed in Table 9.
The lifecycle of an asset encompasses: These service deficiencies have been identified by the
Council’s Property Officers. Works are planned or are
Identification of its need (including confirming that there being considered to address these issues.
is no non-asset solution)
Selection of the asset solution (according to a set
process)
Installation/construction Service Deficiency
Operation, maintenance and inspection Need to review and implement accessibility requirements of
civic & public amenity buildings
Renewal/upgrade
Civic Centre roof leak issues
Disposal
Allan Border Oval Sporting Pavilion needs redevelopment as it
is aged and many components are in poor condition
Rawson Oval Pavilion is aged and in need of redevelopment
Components of the Mosman Bowling Club are in need of
further redevelopment
Vista St carpark ventilation
Swim Centre requires upgrade
Library walk flats require assessments
Lifts in Council buildings are at end of life and require
replacement
Table 9 – Known Service Performance Deficiencies28
Operations and Maintenance Plan Historical Annual Operations
Operations Overview & Historical Expenditure Year Expenditure
Operations activities are activities that consume resources 2015/16 $881,000
to ensure the infrastructure asset levels of service are met.
2016/17 $829,000
For example “running costs” and consumables.
2017/18 $913,000
These are day to day operational activities that have
no effect on the asset’s condition but are necessary to 2018/19 $935,000
physically keep the asset operating. Typical operational Average Annual $890,000
activities include:
Utility costs, e.g. electricity, rates Table 11 – Historical Operations Expenditure Trends
Cleaning
Meter reading
Insurance
Security including patrols
Asset management data collection and condition
assessment
Operations expenditure is not fully distinguished from
maintenance expenditure in the organisation’s financial
systems, although there are some entries on a line item
basis which relate to operations costs e.g. utility costs
including electricity, gas, and water.
In many cases, facility lessees pay utility accounts directly.
These costs are not a cost to Council and are not included
in the Council’s operating budget.
Indicative historical operations expenditure (including
electricity, water and gas as extracted from the Council’s
financial system, the staff managed registers and recent
energy audit reports) are displayed in Table 11.
Operations costs will likely rise in the future with increasing
utility costs, particularly electricity. Council will consider
various sustainability and energy efficiency measures in
existing and upgraded facilities to minimise costs and
environmental impact.Asset Management Plan - Buildings 2020–2029 29
Maintenance Overview & Historical Historical Annual Maintenance
Expenditure Year Expenditure
Maintenance is the regular on-going work that is necessary
2015/16 $652,000
to keep assets operating, including instances where
portions of the asset fail and need immediate repair to 2016/17 $584,000
make the asset operational again. Maintenance includes 2017/18 $718,000
reactive, planned and cyclic work activities:
2018/19 $762,000
Reactive: Unplanned repair work carried out in response
Average Annual $679,000
to service requests and management/supervisory
directions. Traditionally, assessment and prioritisation of
reactive maintenance are undertaken by Council staff Table 12 – Historical Maintenance Expenditure Trends
using experience and judgement, within some basic
maintenance management frameworks.
Planned: Repair work that is identified and managed
through a maintenance management system (MMS),
asset management system (AMS) or through other tools
to assist in identifying when individual assets are due for
repairs
Cyclic: Replacement of higher value components/sub-
components of assets that are undertaken on a regular
cycle. Examples include repainting street furniture e.g.
seating and shelters and pump component replacement
All non-operations works that fall below the capitalisation
threshold of $5,000 are considered maintenance.
Historical maintenance expenditure trends are shown in
Table 12.
Maintenance expenditure has been consistent over the last
few years and this is expected to continue as discussed in
the 10 year financial forecast section.30
Maintenance Methods & Management Maintenance and Operations
In conjunction with the AMPs, building asset maintenance 10 Year Financial Forecast
specifications and practices have been reviewed and Projecting the 10 year financial forecast involves
will be further developed. This will include a more comparing the required maintenance to the budgeted
comprehensive outline of maintenance strategies and maintenance:
maintenance intervention levels and response times. It
is proposed that the asset maintenance specification Required maintenance – The cost of maintenance and
will guide future maintenance, subject to allocation of operations required to meet minimum levels of service
appropriate resourcing. in Mosman. The value is determined via useful life
modelling to be 1.29% of the current replacement cost
(CRC) for building assets
Planned (budgeted) maintenance – The expenditure
that Council has budgeted for maintenance and
operation works
Figure 4 shows a comparison between the required
expenditure for maintenance for the next 10 years and
the budgeted expenditure. Of the operational costs,
80% is estimated to meet required levels of service. The
other 20% is budgeted for emerging issues in safety and
unplanned expenses.Asset Management Plan - Buildings 2020–2029 31
Maintenance expenditure levels are around $550,000 Future revisions of this asset management plan will include
higher than the minimum that is required to be spent a more detailed analysis linking required maintenance
every year. Council has budgeted to spend more than the expenditures with service levels, to set future expenditure.
minimum requirement to deliver a high level of service,
improve the quality of the buildings and reduce the risk Expenditure increases in line with the capital works
consistent with the community expectations. It amounts program (in the Capital Works section), meaning that
to $100,000 more than the amount spent by Council for required maintenance expenditure may be reduced in
buildings maintenance/operations in 2018/19. the medium to long term. This will need to be reassessed
as the renewal program gets underway. An increase in
Figure 4 shows future maintenance expenditure levels capital works funding will have an effect on required
are similar over the next 10 years. Practically more maintenance.
maintenance may be required in some years but this
can be adjusted during the course of the plan as more Deferred maintenance, i.e. works that are identified for
accurate information becomes available. maintenance and unable to be funded are to be included
in the risk management plan.
There is no increase in planned and required expenditure
over time due to CPI, as all values are based on 2019/20
dollar values. Planned and required maintenance forecasts
are detailed in Appendix B.
Figure 4 – Planned Operations & Maintenance Expenditure32
Standards & specifications Condition Inspection Schedule
Maintenance and operations work is carried out Formal condition assessments are conducted over a
in accordance with the following Standards and 5-year cycle. It is expected that at least 20% of operational
Specifications: buildings assets be inspected each year. The schedule
is to be broken down so that an entire building and its
Relevant Australian Standards
components are inspected within the same year. This
Building Code of Australia would equal at least 8 or 9 buildings being inspected per
year, with some critical buildings such as those in Category
Relevant industry guidelines / best practice
A and B (as per Building importance/criticality index)
Natspec/AUS-Spec specifications and guidelines being inspected more frequently. Condition inspections
will likely be completed by an external party.
The condition inspections are used to support the
accumulation of more comprehensive and refined asset
data and to understand the deterioration profile of the
various assets. As buildings are upgraded or as renewal
work is completed, asset inventories will be updated
accordingly.
The condition ratings of building assets are updated in the
AMS along with any updates from capital works. The AMS
has the capability to store condition inspection data that
helps to plan where future inspections are required and
performing reactive maintenance or capital works.
The inspection programs for each category of asset are
outlined in Table 13. They are recorded as the percentage
of assets required for inspection annually.
Asset Type Annual % of Assets Inspected
Operational Buildings 20%
Investment Buildings Flats twice a year, commercial
buildings when necessary
Table 13 – Required Frequency of Annual Condition
InspectionsAsset Management Plan - Buildings 2020–2029 33
Capital Works Plan
Capital Works Overview & Historical Year Historical Annual Capital Expenditure
Expenditure 2015/16 $796,000
Capital works are defined by Mosman Council’s
2016/17 $799,000
Capitalisation Threshold as any works valued at $5000
and over. It applies to the renewal or upgrade of the 2017/18 $1,321,000
existing assets and the installation of new assets. A
2018/19 $5,657,000
description of the three types:
Average Annual $2,143,000
Renewal: Major work that does not increase the asset’s
design capacity but restores, rehabilitates, replaces or
renews an existing asset to its original service potential. Table 14 – Historical Capital Expenditure Trends
For example, the replacement of a carpet using the
same material as previously and which holds the same
value The variation in capital expenditure each year is due to
the varying values of buildings and their components. In
Upgrade: Work over and above restoring an asset to some years, more expenditure is required to undertake the
original service potential often increasing the value of renewal of a building due to its higher value. In 2018/19,
the asset or expanding an already existing asset. For this involved the refurbishment of the Civic Centre which is
example, replacing an HVAC system that is more energy- the highest valued building owned by Council.
efficient and regulates temperature better
Availability of external (grant) funding also impacts
New: The installation of a new asset that is not related to
on project planning and capital spending each year.
an existing asset. For example, constructing a wall in a
In 2020/21, grants will support the expenditure on the
building to divide one room into two
renewal of the Allan Border Oval Pavilion.
Capital works are reported to the Asset Coordinator on
a capitalisation form to update the asset management
system and provide an accurate record of the work
throughout the year. The changes in the AMS then
contribute to calculating the replacement value,
depreciation and Special Schedule 7 of buildings assets at
the end of each financial year.
Historical expenditure for capital works is captured in our
budgeting system. Table 14 shows the expenditure trends.34
Asset Management Plan - Buildings 2020–2029 35
Renewal/Replacement Plan Renewal Methods and Planning
Renewals/replacements will be funded from Council’s Determining which assets are to be renewed uses a
capital works program and grants typically towards the combination of factors. These include the asset type,
end of their useful life. condition, remaining life, asset renewal intervention
strategy and other factors such as how critical an asset
The priority for renewing assets is those that are in an may be. Critical assets have higher priority for renewal
‘unsatisfactory’ condition, 4 or 5. even though the condition may be relatively better than
others.
Council’s objective is to have no buildings assets fall into
condition 4 or 5 but the reality of restrained resources Assets proposed for renewal are inspected to verify
mean that there will be a small percentage of assets fall accuracy of condition, the remaining life and to develop
into condition 4 each year. The condition 4 assets relate a preliminary estimate. Verified proposals are ranked by
to only one component and not the overall building. priority and available funds and then are scheduled into
Even though these components are unsatisfactory, the the works program.
overall buildings condition is based on an average of its
components. Where the majority of the other components For building assets, it is more common to undertake a
are satisfactory the overall building rating is satisfactory. major renewal of multiple components at one time, rather
than complete separate minor renewals spread out over
As of June 30, 2019, all buildings assets are in a a number of years. This results in these projects being
‘satisfactory’ condition. Some Building component’s that less expensive and less disruptive (e.g. noise, closure of
are in unsatisfactory condition will be replaced shortly. facilities).
Through the life of the plan, budgeted renewal Renewals, also where practical, will be undertaken using
expenditure requirements have been forecast to allow ‘low-cost’ renewal methods. The aim of ‘low-cost’ renewals
for assets falling into an ‘unsatisfactory’ condition by is to restore the service potential or future economic
projecting condition information, the estimated remaining benefits of the asset by renewing the assets at a cost
lives, asset inventory and the value of Council’s building similar to or less than replacement cost.
facilities network.
Deferred renewal, i.e. those assets identified for renewal
Significant renewal expenditure (over $250,000) is and not scheduled for renewal in capital works programs
scheduled for the following building in the next five years: are to be included in the risk assessment process in the risk
management plan.
Balmoral Baths, Tram Shed, Raglan
West (Roundhouse), Balmoral 2019/2020
Bathers Pavilion – Amenity Blocks
Allan Border Oval Pavilion 2020/2021
Mosman Swim Centre 2020/2021
Library Walk Shops (Nos. 1-5) 2020/2021
Clifton Gardens – Amenity Block,
2021/2022
Georges Heights Oval Pavilion
Rawson Oval Pavilion 2023/2024
Balmoral Oval Pavilion 2024/202536
Asset Renewal 10 Year Financial Forecast There are years where planned expenditure is above the
The 10-year asset renewal financial forecast scenario minimum required expenditure. Council has budgeted to
defines asset renewal requirements to sustain assets to spend more than the minimum requirement to deliver a
meet the required levels of service. high level of service, improve the quality of the buildings
and reduce the risk consistent with the community
Projecting the 10 year financial forecast involves the expectations.
comparison of two figures:
The large amount of expenditure in 2019/20 and 2020/21
Required renewal expenditure – The renewal expenditure is due to MOSPLAN projects for example, Allan Border
required to meet minimum levels of service in Mosman. Oval Pavilion needs to be renewed as it is in poor condition
This value is determined from the annual depreciation and the estimated cost is $4.95 million for the building
of the building assets. Building assets are depreciating renewal component of this project. This large expenditure
at around $900,000 to $920,000 per year, therefore is in line with the two financial years 2017/18 and 2018/19,
Council is required to spend at least that amount to as Council has made a priority of carrying out much-
offset the declining assets needed building renewals across the LGA.
Planned (budgeted) renewal expenditure – The Other significant projects that contribute to the higher
amount budgeted by Council to spend on the renewal expenditure occur within 2019/20 and 2020/21:
of buildings assets each year. A 10-year capital works
program (see Capital Works section and Appendix 2019/20 – Amenities upgrades occurring at multiple
C) includes these renewal works and their estimated sites including Balmoral Baths and Raglan West car park
budget. The projects are prioritised based on the (Roundhouse), funded by the contributions plan
condition rating, remaining useful life, MOSPLAN or
2020/21 - Mosman Swim Centre refurbishment funded
criticality. It includes the required renewals (i.e. backlog)
using the Swim Centre Reserve
Figure 5 shows the comparison between the required and
In the years following 2020/21, assets renewals are
the budgeted expenditure for buildings. Expenditure has
closer to the required expenditure needed to offset the
been calculated in 2019/20 dollar values and therefore is
depreciation of building assets and similar to historical
not affected by CPI and other market factors.
spending in 2015/16 and 2016/17. From 2021/22 to
2028/29, the average required renewals is approximately
$902,000 and the average budgeted renewals is
approximately $834,000.Asset Management Plan - Buildings 2020–2029 37 Figure 5 – Forecast 10 Year Renewal Requirements
38
Expenditure Gap and Backlog Ratio Backlog Ratio – The measurement of the replacement
The shortfall accumulated during the last few years of the cost of assets in Condition 4 or 5 (i.e. in unsatisfactory
10 year renewal program may need to be assessed closely condition) divided by the total depreciated replacement
during this period, however due to the large budgeted value of all building assets. It indicates the percentage of
expenditure in the 2019/20 and 2020/21 financial the replacement value that needs to be spent to bring
years, the effect is likely to be minimal. Table 16 gives a the assets back to a satisfactory standard
breakdown of planned and required renewal spending and Backlog Benchmark – A benchmark of 2.0% or lower is
the renewal funding gap per year. set by the Office of Local Government and indicates that
assets are performing well and being renewed in a timely
There is a funding gap in 2023/24, 2026/27, 2027/28
manner
and 2028/29 that results in the rise of the backlog ratio.
Measuring the backlog ratio involves the comparison of Council’s 10 year backlog ratio is displayed in Figure 6.
the following:
Year Required Renewals Planned Renewals Renewal Funding Gap
2019/20 919 2,040 0
2020/21 908 7,415 0
2021/22 902 1,050 0
2022/23 902 910 0
2023/24 902 845 57
2024/25 902 920 0
2025/26 902 970 0
2026/27 902 800 102
2027/28 902 650 252
2028/29 902 575 327
Table 16 – Projected and Current/Planned Renewals and Expenditure Gap ($000s)Asset Management Plan - Buildings 2020–2029 39
Figure 6 – Forecast 10 Year Backlog Ratio
By 2028/29, the backlog ratio is expected to reach 0.42% In the future, where necessary Council will allocate
but this is still well under the backlog benchmark of 2.0%. additional capital funding to the building asset renewal
Expenditure is those later years will need to be monitored program, or:
to ensure that the backlog does not increase above the
benchmark. Review general capital programs with a view to re-
allocating additional funding to building asset renewals
Pursue asset renewal for relevant leased or externally
managed buildings with the respective agencies and
organisations and seek funding or contributions either in
part or full towards required renewal works
Pursue external funding and grants as opportunities
arise. Maintenance expenditure will be reviewed regularly
to manage the risk and provide appropriate levels of
service if renewal funding is not available for the project.40
Upgrade/New Works Plan Capital Works Program
Upgrade works are works that improve an asset beyond A draft capital works program is detailed in Appendix C.
its existing capacity and new works create a new asset
that did not previously exist. The program has been determined by factors such as
remaining useful life, condition and other factors. Backlog
New assets may be required due to growth, social or items have been prioritised for renewal in the 19/20 and
environmental needs. Assets may also be acquired at no 20/21 financial years. Projects of importance as part of
cost to the Council from private development. MOSPLAN are also incorporated into the works program.
The need for increasing the level of service as demand
New/upgraded assets are considered in Future Demand increases have also been considered, as well. However, as
and it is estimated in the next 10 years that there will be stated in the Upgrade/New Works Plan section, no budget
less need on upgrading existing or installing new assets has been assigned to this type of work, as it is not too
and more of a need for renewals, based on modelling of likely.
asset needs.
Examples of capital works include items such as lift
However, if a need arises for upgraded/new assets, replacements and painting of internal walls in a number of
grants can be used to fund these projects or budget will buildings.
be redistributed from the low priority works. These low
priority works will then be deferred to later financial years. Given the nature of building works, it is more cost-effective
Upgrade of existing assets and new assets are identified to undertake multiple building component replacements
from various sources such as strategic plans, Mosman at the same time. This can achieve cost efficiencies even
Contributions plan, service deficiencies, councillor if some building components still have some useful life
or community requests and partnerships with other remaining.
organisations.
The program has been created using the best available
Opportunities for implementation of environmental knowledge and data at the time and should be viewed as
sustainability initiatives will be included in the New Works a guide only.
program or as renewal works when opportunities arise.
Capital Works Standards and Specifications
Capital works are carried out in accordance with the
following Standards and Specifications:
Relevant Australian Standards
Relevant industry guidelines / best practice
Building Code of Australia
Natspec/AUS-Spec specifications and guidelinesAsset Management Plan - Buildings 2020–2029 41
Disposal Plan Documentation & Loss on Disposal
Overview Currently, any disposals that occur during a financial year
Disposal includes any activity associated with the are recorded on a disposal form (related to a capitalisation
disposal of a decommissioned asset including the sale, form where required), which is then reported on at the
demolition or relocation. Disposal not only occurs when end of each financial year. The disposal is also recorded in
an entire building is renewed or demolished but also when the AMS.
particular components may be renewed or demolished
The costs of the disposal are included in capital works
only. Often, disposal affects only part of a component,
costs during the replacement/renewal of the asset. The
which is known as partial disposal. When partial disposals
loss on the disposal of the asset is the value that is lost
or renewals occur, the asset component should be
from an asset that has not yet reached the end of its useful
revalued to determine the new replacement cost of the
life or is in Condition 5.
entire component.
Identified Disposals
Disposals include Balmoral Child Care Centre (demolished
in 2019/20) and Allan Border Oval Child Care and Allan
Border Oval Pavilion (demolished in 2020/21). Balmoral
Child Care Centre and Allan Border Oval Child Care
will not be replaced. Allan Border Oval pavilion will be
renewed with a new building.
Other assets that are identified for disposal in the future
will be further investigated to determine the required levels
of service and see what options are available for alternate
service delivery if required. Cashflow projections from any
future proposed asset disposals will be developed and
included in future revisions of this AMP.You can also read