Automated Crisis Content Categorization for COVID-19 Tweet Streams
←
→
Page content transcription
If your browser does not render page correctly, please read the page content below
Long et al. Crisis Content Categorization for Covid-19 Tweets

 Automated Crisis Content
 Categorization for COVID-19 Tweet
 Streams

 Zijun Long Richard McCreadie
 University of Glasgow University of Glasgow
 z.long.2@research.gla.ac.uk richard.mccreadie@glasgow.ac.uk

ABSTRACT

Social media platforms, like Twitter, are increasingly used by billions of people internationally to share information.
As such, these platforms contain vast volumes of real-time multimedia content about the world, which could
be invaluable for a range of tasks such as incident tracking, damage estimation during disasters, insurance risk
estimation, and more. By mining this real-time data, there are substantial economic benefits, as well as opportunities
to save lives. Currently, the COVID-19 pandemic is attacking societies at an unprecedented speed and scale, forming
an important use-case for social media analysis. However, the amount of information during such crisis events
is vast and information normally exists in unstructured and multiple formats, making manual analysis very time
consuming. Hence, in this paper, we examine how to extract valuable information from tweets related to COVID-19
automatically. For 12 geographical locations, we experiment with supervised approaches for labelling tweets into
7 crisis categories, as well as investigated automatic priority estimation, using both classical and deep learned
approaches. Through evaluation using the TREC-IS 2020 COVID-19 datasets, we demonstrated that effective
automatic labelling for this task is possible with an average of 61% F1 performance across crisis categories, while
also analysing key factors that affect model performance and model generalizability across locations.

Keywords

COVID-19 tweets classification, crisis management, deep learning, BERT, supervised learning.

INTRODUCTION

Historically, the primary source of first-hand information during crises is reporting by first responders1. However, in
recent years the use of social media as an alternative communication platform has become popular (McCreadie et al.
2020). Indeed, recent statistics, indicate that one in three people worldwide and two thirds of those with Internet
access engage with social media2. Furthermore, regionally, particular social media platforms can dominate. For
instance, in the United States, with 68% of American adults reported they obtain news from social media.
With the significant worldwide impact of COVID-19, social media is widely used as a discussion platform, which
may contain valuable insights for the response effort. However, the vast volume of on-topic content posted in
contrast to the comparatively small volume of actionable content makes direct leverage of social media by response
personnel difficult and costly. Therefore, there is a clear and urgent need for support systems to help response
organisations filter this content to a degree that it becomes manageable.
 In this paper, we report our experiences in developing a system that automatically analyses tweets posted during
 emergency events and then labels then based on the content that they contain. In particular, we target tweet labelling
 for 7 crisis categories, such as reports of services becoming available, or people providing advice (that may need
 fact checked). We also examine automatic assignment of priorities to tweets, for use as a general filter for the large
volumes of irrelevant or non-useful content on social media. Indeed, based on these labels, we can forward tweets
with actionable information to response officers in need of that information. For example, tweets assigned the
‘Emerging-Threats’ label could be forwarded to officers managing the deployment of resources.
 1https://training.fema.gov/is/courseoverview.aspx?code=IS-42
 2https://ourworldindata.org/rise-of-social-media

 CoRe Paper – Social Media for Disaster Response and Resilience
 Proceedings of the 17th ISCRAM Conference – Blacksburg, VA, USA May 2020
 Amanda Lee Hughes, Fiona McNeill and Christopher Zobel, eds. 667

Long et al. Crisis Content Categorization for Covid-19 Tweets

The contributions of this work are four-fold. First, to the best of our knowledge this is the first work to examine
automated content categorization for COVID-19 using the new TREC-IS 2020 COVID-19 dataset, and as such can
provide valuable insights for future researchers planning to use this new resource. Indeed, we provide an analysis of
a range of automatic classification models for this task. Second, as valuable content on social media is rare for
COVID-19, this makes it difficult to train automated approaches to find such content. We propose and evaluate a
new approach referred to as incremental rectified training (IRT) to alleviate this issue within state-of-the-art deep
neural models. Third, given the wide impact of COVID-19 as a topic, we examine whether automatic COVID-19
content classification approaches are able to generalize across locations. Finally, we also highlight some notable
insights we gained when analysing the models developed.
Based on experimentation over the TREC-IS 2020 A/B data sets, we believe the development of effective automated
tooling to aid in the filtering of COVID-19 data for personnel tasked with either finding localised information
or identifying information needing fact-checked is possible. The development of deep neural language models
such as BERT enable reasonably high precision and recall (approximately 65%) for the majority of information
types tested, meaning that while not perfect, such models can drastically improve the information-to-noise ratio
over simply scanning a keyword filtered feed. We also showed that our proposed IRT method can further improve
the quality of the classification models produced by around 17%. On the other hand, our analysis indicates that
while information categorization models seem to generalize for most information types, the same is not true for
information prioritization classifiers, indicating that what is considered as ‘high-priority’ in one location is not the
same in another.
The remainder of this paper is structured as follows. In the next section we provide a brief summary of relevant
works from the literature on content categorization for pandemics, the TREC-IS initiative, and machine learning over
social media data. Next, we provide a structured overview of the factors that might affect the quality of a COVID-19
content classifier, which are variables that we experiment with in our later experiments. This is followed by an
experimental setup section, where we provide more technical details about the dataset and training methodology
employed. Finally, we list our research questions, as well as report our results, analysis and conclusions.

RELATED WORK

In this section we provide a brief overview of recent papers in crisis informatics, as well as past works within TREC
Incident Streams track that are relevant to our investigation.

Social Media During Emergencies

Social media is a new but critical platform for relevant party to gather and analyse urgent information, especially like
Twitter. Information collected via Twitter has previously been shown to be useful for detecting infectious disease
both spatially and temporally (Ye et al. 2016), HIV/AIDS (Fung et al. 2019), seasonal influenza (Nagar et al. 2014)
and Ebola (E. H.-J. Kim et al. 2016).
Information extraction from social media platforms like Twitter is a recent but increasingly critical problem.
Information collected via Twitter has previously been shown to be useful for detecting infectious disease both
spatially and temporally (Ye et al. 2016), HIV/AIDS (Fung et al. 2019), seasonal influenza (Nagar et al. 2014) and
Ebola (E. H.-J. Kim et al. 2016). Indeed, within social media streams, a common task for emergency responders is
to classify documents based on the information they contain. Twitter data, as a popular data source, can help many
emergency departments (Nagar et al. 2014) and public health agencies (Fung et al. 2019) to predict disease spread.
Moreover, geographically tagged social media content has shown to be a valuable tool for tracing and mapping
disease outbreaks (Widener and Li 2014). However, up until now, few agencies actively take advantage of these
resources.

TREC-IS Pilot Effort in 2020

The Text Retrieval Conference (TREC) Incident Streams track (denoted TREC-IS) is a public data challenge that
aims to tackle current issues with automatically extracting actionable content from social media during crises. At
a high level, participant TREC-IS systems can perform two tasks: classifying tweets by information type, and
ranking tweets by criticality. For both tasks, given an event, a participating system receives a stream of filtered,
event-relevant tweets and an ontology of information types from TREC-IS. The goal of that system is to produce
tweet-level labels and priority ratings, which they then submit for evaluation. TREC-IS has run editions in 2018,
2019 and 2020. Importantly for this work, in response to the global COVID-19 pandemic the 2020 editions of
TREC-IS introduced a COVID-19 sub-task and provided labelled tweets for evaluation. In particular, TREC-IS
2020 defines information ‘types’ to represent categories of information that emergency response officers might find
interesting, for TREC-IS 2020 COVID-19 task (Task 3), the information types are as follows:
 CoRe Paper – Social Media for Disaster Response and Resilience
 Proceedings of the 17th ISCRAM Conference – Blacksburg, VA, USA May 2020
 Amanda Lee Hughes, Fiona McNeill and Christopher Zobel, eds. 668
Long et al. Crisis Content Categorization for Covid-19 Tweets

 1. GoodsServices: The user is asking for a particular service or physical good.
 2. InformationWanted: The user is requesting information.
 3. Volunteer: The user asks people to volunteer to help the response effort.
 4. EmergingThreats: The user reports problems may cause loss of life or damage.
 5. NewSubEvent: The user reports a new occurrence that officers need to respond to.
 6. ServiceAvailable: The user says that he or someone else is providing a service.
 7. Advice: The author provides some advice to the public.

To capture the importance a given message has to emergency response officers, TREC-IS defines four information
criticality labels: low, medium, high, and critical, where high- and critical-level messages require prompt or
immediate review and potentially action by an emergency manager. For instance, examples of critical information
might include calls for search and rescue, emergence of new threats (e.g., a infected patient), or calls for emergency
medical care.

Machine Learning Approaches
In this paper, we experiment with both classical and deep learned approaches to tackle the TREC-IS Task 3 (COVID).
For reference, we consider classical approaches to be those that rely on either bag-of-words or shallow embeddings
to represent tweet text. Indeed, according to a 2019 review conducted by McCreadie et al. for TREC-IS Task 1 and
2 (Crises), classical classifiers can still be very competitive and robust, even when comparing to state-of-the-art
deep neural network models (McCreadie et al. 2019), although that study did not cover pandemic-type events like
COVID-19.
In contrast, recently, pre-trained deep neural language models have become popular as they are very effective
methods to encode meaning contained within sequences of text (Simonyan and Zisserman 2014; Razavian et al.
2014; Antonellis et al. 2015). These models replace the traditional bag-of-words or shallow word embeddings used
by classical models. At the time of writing, the most widely used neural language model is the transformer BERT
model (Devlin et al. 2018) and its subsequent variants. For the purposes of classification, BERT and similar models
can be tuned to produce a numeric vector representing a text sequence, which can then be passed to a traditional
classification model. While models like BERT are widely seen as superior to more traditional text representation
approaches (Xia et al. 2020), they are not yet commonly used in production systems due to their high computational
cost and the need for dedicated GPU acceleration.
It is worth noting that models like BERT can be re-trained or tuned to make them more effective for particular
domains or tasks. In the COVID-19 space, Müller et al. (2020) recently produced an updated BERT model by
re-training it over a COVID-19 twitter dataset. However, given the small gains in down-stream performance reported
(around 0.03 F1) and the large cost of retraining the model, it is unclear whether the benefits are worth the effort
and cost.

Tackling Class Imbalance
A concern with content classification for COVID-19 is the class imbalance (Japkowicz and Stephen 2002; Weiss
2004; He and Garcia 2009). For TREC-IS Task 3, there are 7 categories of interest, where only a small proportion
of the tweets belong to each class. This is a challenge when training models, as there are few positive examples
to learn from, leading to model bias towards the majority class. Moreover, from a task perspective, emergency
responders are more sensitive to failures regarding positive class, as this represents potentially useful information
not being surfaced to the user.
A common approach for solving class imbalance is to balance the number of positive or negative samples used
for training. For example, by down-sampling the majority class, over-sampling the minority class, or using a
combination of the two (Drummond, Holte, et al. 2003; Chawla et al. 2002; Maciejewski and Stefanowski 2011;
He and Garcia 2009). Alternatively, a number of learning methods that intrinsically account for class imbalance
have have been proposed, e.g. (Krawczyk 2016). However, these require larger numbers of positive samples
to be effective than is available for this task, hence we employ sampling methods here. Deep neural network
models also suffer from imbalanced training data (Huang et al. 2016; Jeatrakul et al. 2010). Hard sample mining
is a technique that has been exploited in computer vision to solve the class imbalance, e.g. for tasks such as
object detection (Felzenszwalb et al. 2010; Shrivastava et al. 2016), image categorisation (Song et al. 2016), and
unsupervised representation learning (X. Wang and Gupta 2015). Hard sample mining focuses on selecting samples
that represent difficult to classify, as they carry more discriminative power for the classifier to learn from. Inspired
by this work, we employ a similar approach for our task, referred to as incremental rectification training, where we
use direct sampling based on information criticality.

 CoRe Paper – Social Media for Disaster Response and Resilience
 Proceedings of the 17th ISCRAM Conference – Blacksburg, VA, USA May 2020
 Amanda Lee Hughes, Fiona McNeill and Christopher Zobel, eds. 669
Long et al. Crisis Content Categorization for Covid-19 Tweets

TREC-IS Participant Systems

Participants to TREC-IS 2020 have developed a range of initial solutions for the COVID-19 task, where details can
be found in the associated technical reports (known as ‘notebooks’) provided by TREC.3 For instance, C. Wang and
Lillis (2020) experimented with two multi-task transfer learning approaches, one is an encoder-based model like
BERT, while the other one leverages a sequence-to-sequence transformer, such as T5. These models do not explicitly
attempt to counteract the problems of class imbalance in the crisis data. In contrast Buntain and Sharma (2020) tackle
this problem via the automatic generation of additional examples via a synonym-augmentation strategy using the Cri-
sisMMD dataset as a ground truth. Notably, this work applies a VGG model to classify images attached to the tweets,
enabling both text and image data to be considered, which to some degree alleviates the issues with class imbalance.

VARIABLES WHEN BUILDING COVID CLASSIFICATION MODELS

In this paper we examine to what extent automatic approaches can be used to identify valuable information from
COVID-19 tweets. This section summarizes the variables that we experiment with when developing classical and
state-of-the-art models. When considering model creation in this context, it is useful to divide approaches along
five dimensions: data sampling; tweet representation; model type; training methodology; and model tuning. Data
sampling describes any alterations to the original dataset made prior to training. The tweet representation describes
how each tweet is converted into features used by the learning model while the model type defines the structure
of the resultant model. The training methodology describes how the model is trained, meanwhile model tuning
describes any additional steps that are taken to improve model performance. We describe each of these in more
detail below:

Data Sampling

 • No Sampling (NS) In this case we use the dataset as provided by TREC-IS without any modifications. We
 can expect performance for rare categories to suffer under this type of sampling, as there are few positive
 examples for the learner to work with.

 • Over Sampling (OS) Over sampling is a technique to counteract class-imbalance in a dataset by ‘cloning’
 rare positive examples in the training set such that the learner is exposed to them more frequently when
 training (Barandela et al. 2004). Over sampling has a hyper-parameter that defines the degree to which
 positive examples should be cloned, which we tune per-information type based on the validation set for each
 fold.

Tweet Representations

 • Text: Bag of Words - Count/TFIDF: A bag-of-words approach is the simplest method for representing the
 text in a tweet (Zhang et al. 2010). Here, the presence/absence of terms from a pre-defined dictionary are
 used to represent the tweet text. The dictionary is constructed from the most frequently appearing 25,000
 words in the dataset. Terms are either represented as a count of that term in the dataset (count), using the
 TF-IDF weighting scheme (TFIDF) to emphasise rarer terms that are more informative.

 • Text: Deep Neural Language Models: An alternative approach encoding a tweet’s text is to pass it to the
 sequence encoder of a deep neural language model. This transforms the sequence of text into a numeric
 vector that is suitable for learning and captures the ordering and semantics of the text. We experiment with
 the popular BERT model (Devlin et al. 2018) in our later experiments. We set the maximum sequence length
 to 144 characters (the maximum length of a tweet) to reduce the GPU memory overhead during training.

 • Tweet Metadata: In addition to using the text of a tweet, we can also leverage some additional metadata
 about that tweet (A. Kim et al. 2017). In particular, we encode the following numerical data into our models.
 1) Favourite Count, 2) Retweet Count and 3) Quoted Status.

 • Hashtags: In addition, we separately encode the presence/absence of common hashtags as binary fea-
 tures (Antenucci et al. 2011).

 3https://trec.nist.gov/proceedings/proceedings.html

 CoRe Paper – Social Media for Disaster Response and Resilience
 Proceedings of the 17th ISCRAM Conference – Blacksburg, VA, USA May 2020
 Amanda Lee Hughes, Fiona McNeill and Christopher Zobel, eds. 670
Long et al. Crisis Content Categorization for Covid-19 Tweets

Model Type

 • Logistic Regression (LR): Logistic regression (Wright 1995) is a classical machine learned model that
 performs a (weighted) linear combination of features generated by the above tweet representations.

 • Support Vector Machines (SVM) A classical supervised model designed for categorization tasks, which
 leverages support vectors to influence the decision boundary (hyperplane) allowing for (typically) better
 performance than simpler linear regression models (Drucker et al. 1997)

 • Decision Trees (DT): A decision tree learner produces a tree-like model comprised of binary decision points
 that each condition on an input feature. The primary advantage of these models is that they inherrently are
 able to model non-linear interactions between features (Quinlan 1986).

 • BERT: BERT is a transformer deep neural language model (Devlin et al. 2018) that can also be applied directly
 as a classification model by training an additional layer which takes the last neural layer output and transforms
 that output into classification predictions. There are two basic versions of the BERT model, BERT-Base and
 BERT-Large. We use BERT-base here due to the very high memory overheads of BERT-Large.

Training Methodology

 • Cross-fold Validation (CV) This is a technique to enable the evaluation of models in scenarios where there
 is limited volumes of training data available. In this context, it involves splitting the dataset into five equally
 sized sets of tweets (5-fold) (Wright 1995). Each of these sets are selected in turn as the ‘test’ set, and the
 remaining tweets are used for training the machine learned model(s). The resultant model is applied to the
 test set to evaluate performance. The next tweet set is then selected and the process repeated, until all 5 sets
 have been used as the test set. Reported performance is then the average over the 5 experiments.

 • Cross-Edition Training (CE) TREC-IS ran for two editions this year (2020-A and 2020-B). Under cross-
 edition training, we train a model on tweets from one edition and then test the other edition. As there is little
 in the way of location overlap between the editions, then this type of training can be used to evaluate whether
 models trained from one location can generalize to other locations.

Model Tuning

 • No Tuning (None) The models trained using default hyper-parameters are used.

 • Hyper Parameter Tuning (HPT) Both classical and deep learned models have hyper-parameters, which
 represent ways that the training process can be customised with the aim of improving performance (e.g. the
 model learning rate) (Feurer and Hutter 2019). Prior to model learning, there is often no way to know what
 hyper-parameter settings will result with the best model. Hyper-parameter tuning is the process of trying
 different settings and checking the resultant performance on a validation set. The best performing model is
 then used for testing.

 • Incremental Rectified Training (IRT) Incremental Rectified Training is a new approach that we propose to
 improve the performance of deep learned models in scenarios with highly class imbalanced data, which we
 summarize in the next section.

PROPOSED INCREMENTAL RECTIFIED TRAINING APPROACH

The majority of the variables discussed above are commonly discussed in the literature and hence we direct the
reader to the associated citations. However, Incremental Rectified Training is a new approach that we developed
to explicitly tackle the issues of imbalanced classes when training models like BERT, hence we provide a more
in-depth summary of how this functions below.
The standard procedure for training a neural network is as follows. For a batch of training data, we first run a
forward pass of the current model and calculate the loss of this batch against the validation set. Then we calculate
the gradient based on the loss and use an optimizer to update the parameters of the neural model. This process is
repeated until the model performance stabilizes or a target maximum number of iterations is reached. The issue
with this approach is that as most examples in the COVID scenario for an information type will be negative due to
class imbalance, the model will naturally focus more on those negative examples, leading to poor performance on
the positive class.

 CoRe Paper – Social Media for Disaster Response and Resilience
 Proceedings of the 17th ISCRAM Conference – Blacksburg, VA, USA May 2020
 Amanda Lee Hughes, Fiona McNeill and Christopher Zobel, eds. 671
Long et al. Crisis Content Categorization for Covid-19 Tweets

Algorithm 1 Incremental rectified training
Rectified neural model normal Fine-tuning procedure ← 0 incremental factor Every minority classes in the data
set select all samples in one batch which belong to this class
forward pass based on these samples
calculate loss and gradient
use optimizer two to optimize hyper-parameters

The intuition underpinning incremental rectified training (IRT) is to take better advantage of the small number of
informative ‘hard samples’ per information type (Krawczyk 2016), which for this task we can identify based on the
priority label of each tweet (e.g. those marked as ‘Critical’). There are two main stages of our training process.
The first stage is the same as the standard training procedure. We calculate the gradient and update the model
parameters using an initial optimizer over the whole training dataset. The second stage is incremental rectification
(see Algorithm 1 below).
For an IRT iteration, we sample from the whole dataset a sub-set that represents the type of examples we wish to
rectify (in this case we rectify twice, once using tweets marked as ‘Critical’ priority and once using tweets marked
as ‘High’ priority). We then calculate the loss and gradient only based on this sample, using a second optimizer
(with a lower learning rate) to update the model parameters.

EXPERIMENTAL SETUP

To evaluate to what extent we can automatically identify actionable content from COVID-19 tweet streams, we
evaluate using the TREC-IS 2020 Task 3 datasets and methodology. We summarize the technical details for the
dataset and model creation below.
Dataset: The TREC-IS 2020 A and B Task 3 datasets contain around 21k COVID-19-related tweets collected
from different geographical locations. 2020-A is comprised of three locations, while 2020-B is comprised of 8
locations. The locations are listed in Table 1. For each location tweets were sampled (based on textual diversity)
and subsequently manually labelled based on the information each contained (information types) and the perceived
critically of that information (priority). These tweets were assessed by between one and four human assessors (a
sample of tweets were redundantly assessed for the purposes of calculating inter-annotator agreement). To facilitate
evaluation where a tweet has been labeled multiple times (which may disagree), we collapse those labels as follows.
For the information type labels, we use the union from all assessors as the true label set. Meanwhile, as information
priority evaluation requires only a single label, we take the majority vote amongst the assessors where possible, in
cases where only two assessors labelled a tweet and disagreed on that label (3.4% of tweets), we randomly select
one to use as the ground truth.

 Figure 1. Number of tweets labeled as containing information for each of the 7 information types investigated and
 4 priority labels in the 2020-A and 2020-B datasets.

Figure 1 reports the number of tweets labeled as containing information from each of the 7 information types
investigated and 4 priority labels for the 2020-A and 2020-B data sets. This covers around 3.3k of the 21k total
tweets (the remaining tweets were not assigned any of these 7 categories). As we can see from Figure 1, the
COVID-19 dataset only contains a very small number of positive examples of each information type (recall that
the number of tweets labeled was around 22k), i.e. potentially useful information is rare. Indeed, instances of

 CoRe Paper – Social Media for Disaster Response and Resilience
 Proceedings of the 17th ISCRAM Conference – Blacksburg, VA, USA May 2020
 Amanda Lee Hughes, Fiona McNeill and Christopher Zobel, eds. 672
Long et al. Crisis Content Categorization for Covid-19 Tweets

 Dataset Identifier Event Name Event Type Provided Tweets Labeled Tweets
 TRECIS-CTIT-H-Test-050 2020 COVID-19 Outbreak in Washington DC COVID-19 49,894 4,012
 2020-A TRECIS-CTIT-H-Test-051 2020 COVID-19 Outbreak in Washington State COVID-19 48,499 5,697
 TRECIS-CTIT-H-Test-052 2020 COVID-19 Outbreak in New York COVID-19 50,000 5,126
 TRECIS-CTIT-H-Test-068 2020 COVID-19 Outbreak in Jacksonville, FL COVID-19 13,506 664
 TRECIS-CTIT-H-Test-069 2020 COVID-19 Outbreak in Houston, TX COVID-19 44,297 963
 TRECIS-CTIT-H-Test-070 2020 COVID-19 Outbreak in Phoenix, AZ COVID-19 16,766 871
 TRECIS-CTIT-H-Test-071 2020 COVID-19 Outbreak in Atlanta, GA COVID-19 50,000 966
 2020-B
 TRECIS-CTIT-H-Test-072 2020 COVID-19 Outbreak in New York, part 2 COVID-19 50,000 1,396
 TRECIS-CTIT-H-Test-073 2020 COVID-19 Outbreak in Seattle, WA COVID-19 50,000 966
 TRECIS-CTIT-H-Test-074 2020 COVID-19 Outbreak in Melbourne, AU COVID-19 50,000 957
 TRECIS-CTIT-H-Test-075 2020 COVID-19 Outbreak in New Zealand COVID-19 5,148 783

 Table 1. TREC-IS 2020 COVID-19 Locations

tweets requesting goods/services or information are particularly few in number (which contrasts to what we might
see in natural disaster-type events (McCreadie et al. 2019)). Hence, why techniques for tackling class imbalance
(as discussed earlier) are needed here. When considering the priority labels, we observe a particularly skewed
distribution with almost no “Critical" tweets.
Model Training: For all information type categorization scenarios, we treat it as a series of 7 binary classification
tasks (one per information type). Meanwhile, prioritization is treated as a 4-class classification problem, where one
model is trained. When using cross-fold validation (CV), for each fold setting we divide the dataset into three parts,
three training folds, one validation fold and one test fold. We only use training set and validation set for model
tuning and use the test set to evaluate the model at last and only once. For experiments with BERT, we perform our
research on a GPU cluster supporting TITAN RTX GPUs with 24GB memory.
Model Tuning: For the logistic regression (LR), SVM and Decision Tree (DT) models for some settings we perform
hyper-parameter tuning over for 8 parameters. Here we use a randomized search of the hyper-parameter space as a
full grid-search would be computationally impractical. For example, when we conduct a randomized search for
10000 fits, the time cost is around 53 hours in our experiments. Furthermore, 10000 fits with 5 folds cross validation
is only very small subset of all combination of these 8 parameters. Therefore, we believe this level of searching is
not effective. For the BERT models, following best practices (Devlin et al. 2018) we tune the batch size ([16,32])
and learning rate ([5e-5,3e-5,2e-5]). We also use a learning rate decay function to decrease the learning rate step by
step during tuning. We use the Adam optimizer with an epsilon value of 1e-8.
Metrics: To evaluate the performance for both information type categorization and prioritization, we use four
traditional classification metrics: precision, recall, and F1 score.

RESEARCH QUESTIONS AND STRUCTURE

To evaluate to what extent automated approaches for covid content categorization are effective, we divide our
analysis into two parts. First, we examine four research questions that focus on the quantitative evaluation of
supervised models for both information type categorization within tweets, as well as for priority estimation. We
then follow this with a discussion section where we highlight some notable outcomes from our subsequent analysis
of the output of the developed models.

 1. RQ1: How effective is a classical machine learning model at covid content classification?
 2. RQ2: How does the tweet text representation affect performance?
 3. RQ3: Is Incremental Rectified Training effective?
 4. RQ4: Can covid categorization models generalize across locations?

RQ1: HOW EFFECTIVE IS A CLASSICAL MACHINE LEARNING MODEL AT COVID CLASSIFICATION?

To begin our performance analysis, as this is the first work looking at COVID-19 content classification for TREC-IS
Task 3, it is worth examining how difficult the two categorization tasks are (information types and priority) for a
classical machine learned model on COVID-19 data. Table 2 (RQ1) reports the performance of a logistic regression
model when trained using CV (5-fold) for the 2020-A dataset with oversampling (OS), both with and without
hyper-parameter tuning (HPT). For information type categorization, reported performance is macro-averaged across
the information types.

 CoRe Paper – Social Media for Disaster Response and Resilience
 Proceedings of the 17th ISCRAM Conference – Blacksburg, VA, USA May 2020
 Amanda Lee Hughes, Fiona McNeill and Christopher Zobel, eds. 673
Long et al. Crisis Content Categorization for Covid-19 Tweets

 Model Information Types Priority
 Data Training Tweet Model Time Time
 Tuning Precision Recall F1 Precision Recall F1
 Sample Methodology Representation Type (min) (min)
 2020-A OS CV (5-fold) BoW (Count) + # + Meta LR None 0.2096 0.5190 0.2875 264.22 0.3160 0.6770 0.3480 37.46
 RQ1
 2020-A OS CV (5-fold) BoW (Count) + # + Meta LR HPT 0.1951 0.6239 0.2945 - 0.3300 0.6360 0.3540 -
 2020-A OS CV (5-fold) BoW (Count) + # + Meta LR None 0.2096 0.5190 0.2875 264.22 0.3470 0.6500 0.3820 35.30
 2020-A OS CV (5-fold) BoW (TFIDF) + # + Meta LR None 0.1843 0.4725 0.2652 255.30 0.3160 0.6770 0.3480 37.46
 RQ2
 2020-A OS CV (5-fold) Word2Vec + # + Meta LR None 0.2103 0.1917 0.2200 384.50 0.2275 0.2138 0.2204 58.30
 2020-A OS CV (5-fold) BoW (Count) + # + Meta DT None 0.1120 0.3860 0.1740 48.32 0.3333 0.3245 0.3289 6.58
 2020-A OS CV (5-fold) BoW (TFIDF) + # + Meta DT None 0.0970 0.3520 0.1520 50.29 0.3333 0.3245 0.3289 7.20
 2020-A OS CV (5-fold) Word2Vec + # + Meta DT None 0.1480 0.2870 0.1950 136.70 0.3400 0.3280 0.3339 15.30
 2020-A OS CV (5-fold) BoW (Count) + # + Meta SVM None 0.1905 0.0016 0.0031 46.23 0.2623 0.2937 0.2684 7.15
 2020-A OS CV (5-fold) BoW (TFIDF) + # + Meta SVM None 0.1714 0.0013 0.0026 48.10 0.3150 0.3018 0.3036 7.32
 2020-A OS CV (5-fold) Word2Vec + # + Meta SVM None 0.2033 0.0137 0.0256 111.03 0.3380 0.3110 0.3239 16.80
 2020-A OS CV (5-fold) BERT + # + Meta LR None 0.5011 0.4526 0.4699 281.30 0.2505 0.2265 0.2275 43.70
 2020-A OS CV (5-fold) BERT + # + Meta BERT None 0.6155 0.5808 0.5880 330.70 0.3867 0.3529 0.3575 67.00
 2020-A OS CV (5-fold) BERT + # + Meta BERT None 0.6155 0.5808 0.5880 330.70 0.3867 0.3529 0.3575 43.70
 RQ3
 2020-A OS CV (5-fold) BERT + # + Meta BERT IRT 0.6164 0.6130 0.6106 376.33 0.4326 0.4448 0.3839 52.19
 2020-A OS CV (5-fold) BoW (Count) + # + Meta LR None 0.2096 0.5190 0.2875 264.22 0.3470 0.6500 0.3820 37.46
 2020-A/B OS CE (AVG:A->B,B->A) BoW (Count) + # + Meta LR None 0.5001 0.4963 0.4691 611.84 0.2851 0.4944 0.3541 87.12
 RQ4
 2020-A OS CV (5-fold) BERT + # + Meta BERT IRT 0.6164 0.6130 0.6106 376.33 0.4326 0.4448 0.3839 52.19
 2020-A/B OS CE (AVG:A->B,B->A) BERT + # + Meta BERT IRT 0.6675 0.6684 0.6628 612.4 0.2232 0.3387 0.3262 87.2

 Table 2. Performance analysis of different Covid Classificaton models for TREC-IS Task 3.

As can be seen from Table 2 (RQ1), in terms of information type categorization performance, categorization
precision is around 20%, with recall higher at between 51% and 62%. The precision performances, in particular, are
quite low here indicating that this is quite a difficult classification task, likely due to the very small number of tweets
for some information types like volunteering, emerging threats and requests for information or goods/services in the
2020-A dataset (see Figure 1). The other outcome of note here is that as expected, the addition of hyper-parameter
tuning (HPT) does improve performance by a small margin (e.g. 0.3480 F1 to 0.3540 F1 for priority estimation).
However this comes at the cost of increasing training time by around 52 hours, hence to keep training time tractable
given the large number of variables investigated here, we do not apply HPT for logistic regression in the following
experiments.

RQ2: HOW DOES THE TWEET TEXT REPRESENTATION AFFECT PERFORMANCE?

Having provided an initial baseline that we can use for comparison, we next need to evaluate what impacts
classification performance for this task. Hence, we next investigate the impact of the primary input to the learned
model, i.e. how we encode the tweet text for the learner. As discussed previously, we have two main options here.
1) use a bag-of-words representation (either with term counting, or via a term weighting model like TFIDF). 2) Use
an embedding of the text using a neural language model. Our expectation is that neural language modelling should
be more effective, as they can better encode the semantics of each tweet.
Table 2 (RQ2) reports the performance of these three text representation approaches across both categorization tasks.
Note that we can use the BERT embedding of the sentence either as an input to a classical model or extend the neural
network to do end-to-end classification, hence we report the outcomes for both of these scenarios (RQ2 rows 3 and
4 in Table 2). From Table 2 (RQ2) we observe the following. First comparing the two bag-of-words approaches, we
observe interestingly the simpler approach (count) where we use the document frequency to represent the importance
of each term is more effective than the TFIDF representation. The primary difference between these two approaches
is that TFIDF introduces a term frequency component, which can be noisy when working with short tweets (Amati
et al. 2011). Secondly, contrasting the bag-of-words and neural embedding approaches, we see that both information
type categorization models that utilize the BERT-based text embeddings are markedly more effective than the
models that use the bag-of-words representation. This is expected given the impressive performances that deep
neural language models have shown for similar related tasks (Müller et al. 2020). However, the picture is less clear
when we consider tweet priority/criticality prediction. In particular, while one of the BERT-based models does
demonstrate a clear advantage over the bag-of-words representation in terms of precision, this seems to come at a
large cost in terms of recall. This indicates that the semantic representation provided by the BERT model is not
well suited to capture the text features that are indicative of information priority, although further investigation is
needed to better understand why this is the case. To answer RQ2, it is clear that the text representation can have a
strong impact on model performance here, where neural language models are recommended for information type
categorization tasks, but not for priority estimation.

RQ3: IS INCREMENTAL RECTIFIED TRAINING EFFECTIVE?

In the previous section, we showed that using a neural language model for covid content classification was effective.
However, given the strong class imbalance inherent to the covid data, can our proposed incremental rectified training

 CoRe Paper – Social Media for Disaster Response and Resilience
 Proceedings of the 17th ISCRAM Conference – Blacksburg, VA, USA May 2020
 Amanda Lee Hughes, Fiona McNeill and Christopher Zobel, eds. 674
Long et al. Crisis Content Categorization for Covid-19 Tweets

approach help alleviate this issue (in tandem with oversampling)? In this section, we compare the performance of
our BERT-based model both with and without IRT to see if it benefits performance. We would expect that if IRT is
useful, overall performance will increase, and that the benefits will be most present in information types where there
are very few positive examples.
Table 2 (RQ3) reports the performance of the BERT-based model both with and without IRT. As we can see from
Table 2, in terms of overall performance, IRT is effective, outperforming the BERT baseline under all metrics for
both information type and prioritization sub-tasks.4 For instance, for information type categorization, performance
increases from 0.5880 F1 to 0.6106 F1, primarily due to increased recall for no loss in precision. Hence, to answer
RQ3, we conclude that incremental rectified training is indeed effective.

 Figure 2. F1 Performance of the BERT model with and without Incremental Rectified Training per Information
 Type.

However, what information types are most benefited from this approach? Figure 2 reports the performance change
in terms of categorization F1 for the 7 information types. Counter to our expectations, we see that the performance
gains observed are not for the cases with very few examples (volunteering and requests for goods/services or
information), but rather the other categories. First, it is worth noting that even though these other four information
types have more examples (between 100 to 500), they are still rare in terms of the overall COVID-19 dataset (21k
tweets), so our expectation that IRT will help for rare categories is still upheld. On the other hand, although we
cannot definitively prove this, we believe that the reason that the extremely rare information types (volunteering and
requests for goods/services or information) are not benefited by IRT is that they simply lack the needed critical mass
of examples to learn any further meaningful patterns through tuning. Indeed, there are only between 14 and 53
examples for these information types. Hence, this may be a case where more examples need to be found to enable a
better model to be created.

RQ4: CAN COVID CATEGORIZATION MODELS GENERALIZE ACROSS LOCATIONS?

So far, we have focused on classification performance under a 5-fold cross validation for the TREC-IS 2020-A
dataset (covering 3 locations). Under this scenario, tweets from each location will be spread over the training,
validation and test sets for each fold, i.e. the model will have received at least some training examples from the same
location as is used for testing. In effect, this represents a scenario where some training is available for each location.
However, as the pandemic spread, a valid use-case might be to take a model trained in one location and then apply it
to a different location. Hence, it would be practically useful to test to what extent this is possible. To evaluate this,
we test model performance in a cross-edition training setting, i.e. we train on locations from one TREC-IS edition
and test on locations from the other TREC-IS edition. If performance is comparable to the cross-fold setting, then
we could conclude that model generalization is possible.
Table 2 (RQ4) reports the performance of both the best logistic regression and BERT models when trained either
in a cross-fold or cross-edition manner. Interestingly, from Table 2 (RQ4) we observe a clear split between the
information type categorization and priority sub-tasks here. In particular, for information type-categorization,
the performance was comparable or markedly better when training both model types in a cross-edition manner,
indicating that model generalization is indeed viable. However, when considering the prioritization sub-task, we
see the opposite picture, where performance degrades markedly when moving from cross-fold to cross-edition
training. This indicates that what might be considered as of ‘high’ priority in one location is not the same across
locations. Indeed, we observed quite a diverse set of tweets being marked as of high priority across locations in our
 4It is worth noting that while overall performance across categories is improved, this is only statistically significant for 3 of the 7 categories
(McNemar’s Test, p
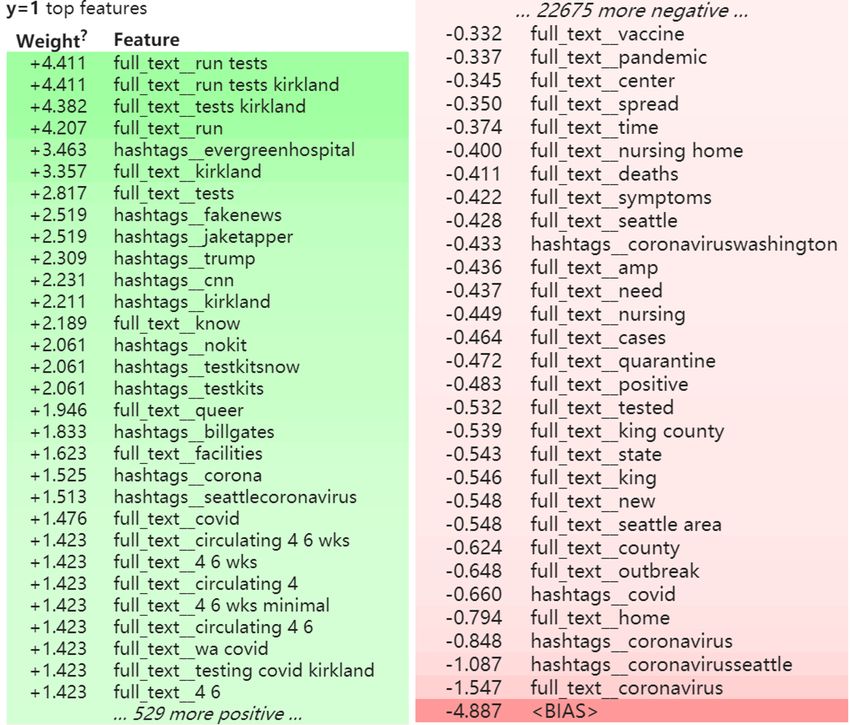
Long et al. Crisis Content Categorization for Covid-19 Tweets

subsequent manual analysis. Information about new cases emerging in an area appears to be commonly labelled as
a high priority across locations, but we also observe particular topics that seem to be localized, such as reporting on
pollution levels in one U.S. state, or the outcome of drug trials in another. Hence, to answer RQ4, we conclude
that the information type categorization models developed appear to generalise well across locations, however, the
priority estimation models do not.

ADDITIONAL OBSERVATIONS AND DISCUSSION

Having performed a quantitative analysis of the impact of different variables on model performance in the previous
sections, we now report some select outcomes from a manual failure analysis we performed on one of these models,
5 which may be useful to future researchers and practitioners working on this task.
URLs can miss-lead classifiers: In terms of the 7 information types, requests for goods and services (‘GoodsSer-
vices’) is the most difficult (exhibits the lowest performance). To explain why, we analysed the key term features
that the model was focusing on when attempting to classify each tweet. Figure 3a lists the term features and their
weight according to the logistic regression model learned for the Washington State location. As we can see from
Figure 3a, the model is learning that some URLs are important (as indicated as term features with both the highest
and lowest weights). However, such URLs are both location and time dependant and hence will not generalize. If
training a model for use across locations, it would be advisable to either filter out such URLs or encode them in a
location/time agnostic way, as unaltered they can confuse the learner.
Location-bearing hashtags are important relevance indicators: Additionally, also from Figure 3a (a), we
observe that hashtags like “seattle" and “coronavirusseattle" are weighted highly. In this case, the model has learned
that these are negative features because they indicate that the tweet is irrelevant to the current location, i.e. the model
was being applied on Washington State, not Seattle, hence Seattle-related tweets are defacto irrelevant under the
task guidelines. Indeed, we can see the same pattern in Figure 3a (b) for a different information type (Information
Wanted).

 (a) Request for Goods and Services (b) Information Wanted.
 Figure 3. Top features by weighting factor for the Logistic Regression model

Images and videos can also be important: Notably, when analysing cases where the model made errors, we
encountered scenarios where we could not explain why the human assessors labelled them with particular tags
when looking only at their text. For example, consider the tweet “@realDonaldTrump Major coronavirus high
risk cities 4 Seattle. companies, need employees relief Amazon Boeing Microsoft walmart". The human assessor
marked this tweet as belonging to the request for goods and services category, but why? We might think that the
human assessor assigned the wrong label, but if we render this tweet on Twitter then we find that it contains a video
about how to get access to food supplies. This highlights that some cases will require more than just analysing the
text to effectively label some tweets.

CONCLUSIONS

In this paper we analysed to what extent automatic machine learned models are able to identify useful information
from high volumes of COVID-19-related social media content. In particular, using the TREC-IS 2020 COVID-19
 5More precisely, those trained on 2020-A OS using CV (5-fold), the BoW (Count) + # + Meta features using logistic regression.

 CoRe Paper – Social Media for Disaster Response and Resilience
 Proceedings of the 17th ISCRAM Conference – Blacksburg, VA, USA May 2020
 Amanda Lee Hughes, Fiona McNeill and Christopher Zobel, eds. 676
Long et al. Crisis Content Categorization for Covid-19 Tweets

sub-task datasets, we trained a range of traditional and state-of-the-art deep neural models to both identify tweets
containing particular types of useful information (e.g. emerging threats or advice), as well as to estimate the
priority/criticality of that information. Our results show that accurate automatic identification of tweets containing
particular information types such as services becoming available, advice sharing, new relevant events and emerging
threats is possible. Indeed, deep neural language models such as BERT provide reasonably high precision and
recall ( 65%) for these information types. From a practical perspective, this means that while not perfect, such
models could be used to drastically improve the information-to-noise ratio for analysts who currently just use the
search tools provided by Twitter itself. Additionally, we proposed a new approach to alleviate issues stemming
from limited examples when training deep neural models for this task (denoted incremental rectified training or
IRT), with demonstrated improvements of up-to 17%. Furthermore, through analysis of model generalization
across geographical locations affected by covid, we showed that while information categorization models seem
to generalize across locations, the same is not true for information prioritization models, indicating that what is
considered as ‘high-priority’ in one location is not the same in another. Moving forward, we aim to investigate how
to better integrate non-text content into the categorization process, such as images and videos attached to each
tweet, as we found that both 1) tweets exist that need such information to be categorized correctly and 2) the current
models we tested were unable to perform effectively for such tweets.

REFERENCES

Amati, G., Amodeo, G., Bianchi, M., Celi, A., De Nicola, C., Flammini, M., Gaibisso, C., Gambosi, G., and
 Marcone, G. (2011). “Fub, iasi-cnr, univaq at trec 2011”. In: Text REtrieval Conference (TREC 2011). US.
Antenucci, D., Handy, G., Modi, A., and Tinkerhess, M. (2011). “Classification of tweets via clustering of hashtags”.
 In: EECS 545, pp. 1–11.
Antonellis, G., Gavras, A. G., Panagiotou, M., Kutter, B. L., Guerrini, G., Sander, A. C., and Fox, P. J. (May 2015).
 “Shake Table Test of Large-Scale Bridge Columns Supported on Rocking Shallow Foundations”. In: Journal of
 Geotechnical and Geoenvironmental Engineering 141.5, p. 04015009.
Barandela, R., Valdovinos, R. M., Sánchez, J. S., and Ferri, F. J. (2004). “The imbalanced training sample problem:
 Under or over sampling?” In: Joint IAPR international workshops on statistical techniques in pattern recognition
 (SPR) and structural and syntactic pattern recognition (SSPR). Springer, pp. 806–814.
Buntain, C. L. and Sharma, S. (2020). “#pray4victims : Improving Classification of Crisis-Related Social Media
 Content via Text Augmentation and Image Analysis”. In: The Text REtrieval Conference (TREC) 2020. Jersey
 City, NY, USA: ACM.
Chawla, N. V., Bowyer, K. W., Hall, L. O., and Kegelmeyer, W. P. (June 2002). “SMOTE: Synthetic Minority
 Over-sampling Technique”. In: Journal of Artificial Intelligence Research 16, pp. 321–357.
Devlin, J., Chang, M.-W., Lee, K., and Toutanova, K. (2018). “Bert: Pre-training of deep bidirectional transformers
 for language understanding”. In: arXiv preprint arXiv:1810.04805.
Drucker, H., Burges, C. J., Kaufman, L., Smola, A., Vapnik, V., et al. (1997). “Support vector regression machines”.
 In: Advances in neural information processing systems 9, pp. 155–161.
Drummond, C., Holte, R. C., et al. (2003). “C4. 5, class imbalance, and cost sensitivity: why under-sampling beats
 over-sampling”. In: Workshop on learning from imbalanced datasets II. Vol. 11. Citeseer, pp. 1–8.
Felzenszwalb, P. F., Girshick, R. B., McAllester, D., and Ramanan, D. (Sept. 2010). “Object Detection with
 Discriminatively Trained Part-Based Models”. In: IEEE Transactions on Pattern Analysis and Machine Intelligence
 32.9, pp. 1627–1645.
Feurer, M. and Hutter, F. (2019). “Hyperparameter optimization”. In: Automated Machine Learning. Springer,
 Cham, pp. 3–33.
Fung, I. C.-H., Yin, J., Pressley, K. D., Duke, C. H., Mo, C., Liang, H., Fu, K.-W., Tse, Z. T. H., and Hou, S.-I.
 (2019). “Pedagogical Demonstration of Twitter Data Analysis: A Case Study of World AIDS Day, 2014”. In:
 Data 4.2, p. 84.
He, H. and Garcia, E. A. (2009). “Learning from imbalanced data”. In: IEEE Transactions on knowledge and data
 engineering 21.9, pp. 1263–1284.
Huang, C., Li, Y., Loy, C. C., and Tang, X. (June 2016). “Learning Deep Representation for Imbalanced Classification”.
 In: 2016 IEEE Conference on Computer Vision and Pattern Recognition (CVPR).

 CoRe Paper – Social Media for Disaster Response and Resilience
 Proceedings of the 17th ISCRAM Conference – Blacksburg, VA, USA May 2020
 Amanda Lee Hughes, Fiona McNeill and Christopher Zobel, eds. 677
Long et al. Crisis Content Categorization for Covid-19 Tweets

Japkowicz, N. and Stephen, S. (2002). “The class imbalance problem: A systematic study”. In: Intelligent data
 analysis 6.5, pp. 429–449.
Jeatrakul, P., Wong, K. W., and Fung, C. C. (2010). “Classification of Imbalanced Data by Combining the
 Complementary Neural Network and SMOTE Algorithm”. In: Neural Information Processing. Models and
 Applications, pp. 152–159.
Kim, A., Miano, T., Chew, R., Eggers, M., and Nonnemaker, J. (2017). “Classification of Twitter users who tweet
 about e-cigarettes”. In: JMIR public health and surveillance 3.3, e63.
Kim, E. H.-J., Jeong, Y. K., Kim, Y., Kang, K. Y., and Song, M. (2016). “Topic-based content and sentiment analysis
 of Ebola virus on Twitter and in the news”. In: Journal of Information Science 42.6, pp. 763–781.
Krawczyk, B. (Apr. 2016). “Learning from imbalanced data: open challenges and future directions”. In: Progress in
 Artificial Intelligence 5.4, pp. 221–232.
Maciejewski, T. and Stefanowski, J. (Apr. 2011). “Local neighbourhood extension of SMOTE for mining imbalanced
 data”. In: 2011 IEEE Symposium on Computational Intelligence and Data Mining (CIDM).
McCreadie, R., Buntain, C., and Soboroff, I. (2019). “TREC Incident Streams: Finding Actionable Information on
 Social Media”. In: Proceedings of the 16th International Conference on Information Systems for Crisis Response
 and Management (ISCRAM).
McCreadie, R., Buntain, C., and Soboroff, I. (2020). “Incident Streams 2019: Actionable Insights and How to Find
 Them”. In:
Müller, M., Salathé, M., and Kummervold, P. E. (2020). “COVID-Twitter-BERT: A Natural Language Processing
 Model to Analyse COVID-19 Content on Twitter”. In: arXiv preprint arXiv:2005.07503.
Nagar, R., Yuan, Q., Freifeld, C. C., Santillana, M., Nojima, A., Chunara, R., and Brownstein, J. S. (2014). “A case
 study of the New York City 2012-2013 influenza season with daily geocoded Twitter data from temporal and
 spatiotemporal perspectives”. In: Journal of medical Internet research 16.10, e236.
Quinlan, J. R. (1986). “Induction of decision trees”. In: Machine learning 1.1, pp. 81–106.
Razavian, A. S., Azizpour, H., Sullivan, J., and Carlsson, S. (June 2014). “CNN Features Off-the-Shelf: An
 Astounding Baseline for Recognition”. In: 2014 IEEE Conference on Computer Vision and Pattern Recognition
 Workshops.
Shrivastava, A., Gupta, A., and Girshick, R. (June 2016). “Training Region-Based Object Detectors with Online
 Hard Example Mining”. In: 2016 IEEE Conference on Computer Vision and Pattern Recognition (CVPR).
Simonyan, K. and Zisserman, A. (2014). Very Deep Convolutional Networks for Large-Scale Image Recognition.
 arXiv: 1409.1556 [cs.CV].
Song, H. O., Xiang, Y., Jegelka, S., and Savarese, S. (June 2016). “Deep Metric Learning via Lifted Structured
 Feature Embedding”. In: 2016 IEEE Conference on Computer Vision and Pattern Recognition (CVPR).
Wang, C. and Lillis, D. (2020). “#pray4victims : Multi-task transfer learning for finding actionable information from
 crisis-related messages on social media”. In: The Text REtrieval Conference (TREC) 2020. Dublin, Ireland: ACM.
Wang, X. and Gupta, A. (Dec. 2015). “Unsupervised Learning of Visual Representations Using Videos”. In: 2015
 IEEE International Conference on Computer Vision (ICCV).
Weiss, G. M. (2004). “Mining with rarity: a unifying framework”. In: ACM Sigkdd Explorations Newsletter 6.1,
 pp. 7–19.
Widener, M. J. and Li, W. (2014). “Using geolocated Twitter data to monitor the prevalence of healthy and unhealthy
 food references across the US”. In: Applied Geography 54, pp. 189–197.
Wright, R. E. (1995). “Logistic regression.” In:
Xia, P., Wu, S., and Van Durme, B. (2020). “Which* bert? a survey organizing contextualized encoders”. In: arXiv
 preprint arXiv:2010.00854.
Ye, X., Li, S., Yang, X., and Qin, C. (2016). “Use of social media for the detection and analysis of infectious diseases
 in China”. In: ISPRS International Journal of Geo-Information 5.9, p. 156.
Zhang, Y., Jin, R., and Zhou, Z.-H. (2010). “Understanding bag-of-words model: a statistical framework”. In:
 International Journal of Machine Learning and Cybernetics 1.1-4, pp. 43–52.

 CoRe Paper – Social Media for Disaster Response and Resilience
 Proceedings of the 17th ISCRAM Conference – Blacksburg, VA, USA May 2020
 Amanda Lee Hughes, Fiona McNeill and Christopher Zobel, eds. 678
You can also read