Automated quantification of posterior vitreous inflammation: optical coherence tomography scan number requirements - Nature
←
→
Page content transcription
If your browser does not render page correctly, please read the page content below
www.nature.com/scientificreports
OPEN Automated quantification
of posterior vitreous inflammation:
optical coherence tomography scan
number requirements
Jan Henrik Terheyden 1*, Giovanni Ometto2, Giovanni Montesano2,
Maximilian W. M. Wintergerst 1, Magdalena Langner1, Xiaoxuan Liu 3,4
, Pearse A. Keane 5
,
David P. Crabb 2, Alastair K. Denniston 3,4,5 & Robert P. Finger1*
Quantifying intraocular inflammation is crucial in managing uveitis patients. We assessed the
minimum B-scan density for reliable automated vitreous intensity (VI) assessment, using a novel
approach based on optical coherence tomography (OCT). OCT volume scans centered on the macula
were retrospectively collected in patients with uveitis. Nine B-scans per volume scan at fixed locations
were automatically analyzed. The following B-scan selections were compared against the average
score of 9 B-scans per volume scan as a reference standard: 1/3/5/7 central scans (1c/3c/5c/7c), 3
widely distributed scans (3w). Image data of 49 patients (31 females) were included. The median
VI was 0.029 (IQR: 0.032). The intra-class-correlation coefficient of the VI across the 9 B-scans was
0.923. The median difference from the reference standard ranged between 0.001 (7c) and 0.006 (1c).
It was significantly lower for scan selection 3w than 5c, p(adjusted) = 0.022, and lower for selection
7c than 3w, p(adjusted) = 0.003. The scan selections 7c and 3w showed the two highest areas under
the receiver operating curve (0.985 and 0.965, respectively). Three widely distributed B-scans are
sufficient to quantify VI reliably. Highest reliability was achieved using 7 central B-scans. Automated
quantification of VI in uveitis is reliable and requires only few OCT B-scans.
Uveitis is a common inflammatory disease of the eye, accounting for 5–10% of visual impairment worldwide1,2.
The disease affects the vascular layer (consisting of iris, ciliary body and choroid) of people who are frequently of
working age1,3. Quantification of intraocular inflammation is crucial in managing patients with uveitis. To date
the quantification of intraocular inflammation is mostly done semi-quantitatively by subjective clinical evalu-
ation, which comes with a range of limitations common to subjective r atings3–5. Thus, several approaches have
been developed to quantify vitreous intensity (VI) more o bjectively6–9. This includes quantification of vitreous
inflammation based on optical coherence tomography (OCT) s cans8–12.
The developed algorithm for an automatic assessment of vitreous inflammation is based on the measurement
of hyperreflective spots within the posterior vitreous included on macular OCT scans. As this parameter alone is
prone to artefacts due to media opacities, a score relative to the retinal pigment epithelium has been established
in previous studies and evaluated against the reference standard of the Standardization of Uveitis Nomenclature
(SUN) clinical grading of vitreous h aze8–13.
The application of an OCT-based, automated algorithm for quantification of vitreous inflammation requires
manual selection and a certain amount of manual post-processing steps of scans. For this reason, the number
of scans should be limited to the minimum amount required for reliable quantification of VI to facilitate future
employment in clinical routine and randomized controlled clinical trials. These applications include a potential
use of the OCT-based parameter as a biomarker for therapeutic decisions, follow-up intervals and as a clinical
1
Department of Ophthalmology, University Hospital Bonn, 53127 Bonn, Germany. 2Division of Optometry
and Visual Science, City, University of London, London, UK. 3Academic Unit of Ophthalmology, Institute of
Inflammation and Ageing, University of Birmingham, Birmingham, UK. 4Department of Ophthalmology,
University Hospitals Birmingham NHS Foundation Trust, Birmingham, UK. 5NIHR Biomedical Research Centre At
Moorfields Eye Hospital and UCL Institute of Ophthalmology, London, UK. *email: Jan.Terheyden@ukbonn.de;
Robert.Finger@ukbonn.de
Scientific Reports | (2021) 11:3271 | https://doi.org/10.1038/s41598-021-82786-0 1
Vol.:(0123456789)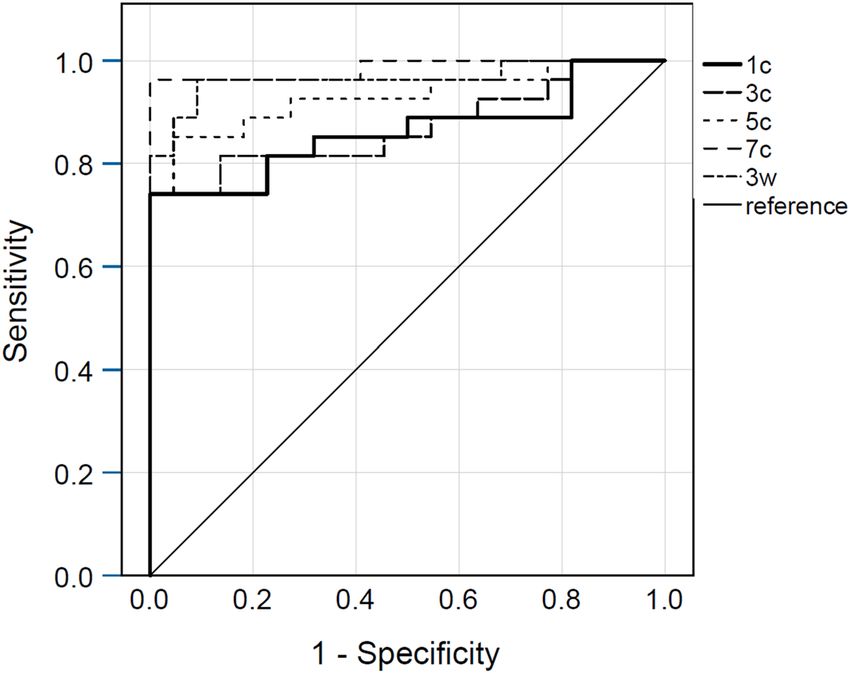
www.nature.com/scientificreports/
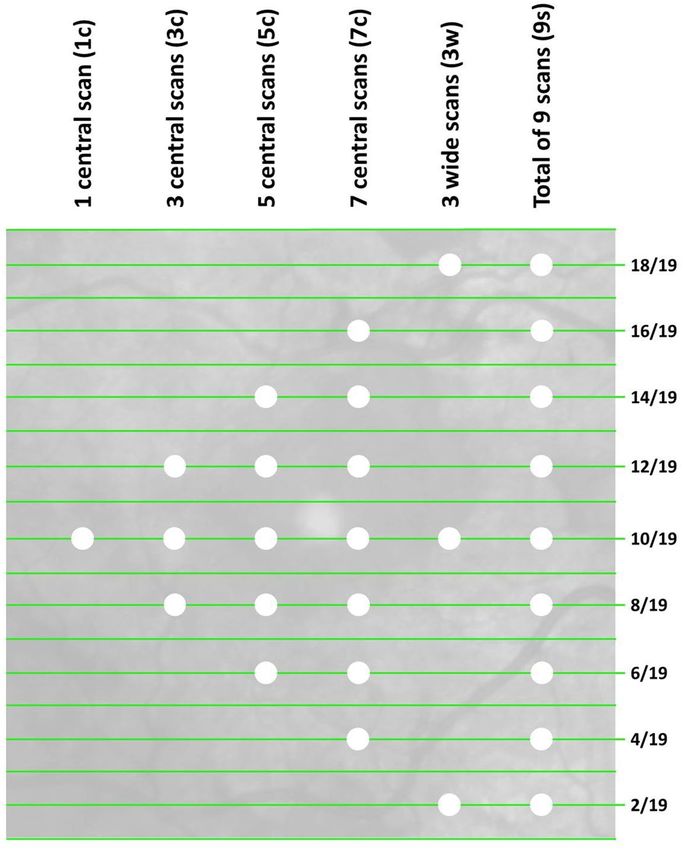
Figure 1. Illustration of an infrared image linked to an OCT volume scan that consists of 19 B-scans. The white
dots indicate which scans (green lines) have been included in the different sub selections of B-scans (columns).
Median VI difference from reference standard
Scan sub selection (interquartile range) Limits of agreement compared to reference standard
1 central scan (1c) 0.006 (0.009) [− 0.039;0.037]
3 central scans (3c) 0.005 (0.011) [− 0.033;0.032]
5 central scans (5c) 0.004 (0.009) [− 0.028;0.026]
7 central scans (7c) 0.001 (0.004) [− 0.009;0.009]
3 wide scans (3w) 0.003 (0.005) [− 0.014;0.013]
Table 1. Deviation between the reference standard (VI means of 9 B-scans) and average VI values from the
sub selections of B-scans and respective limits of agreement. VI, vitreous intensity.
trial endpoint. Thus, we assessed the minimum required number of B-scans to reliably quantify vitreous inflam-
mation in this study.
Results
Current image data of 49 eyes of 49 patients (31 females, 18 males) examined at a tertiary referral centre were
included. Uveitis was classified as intermediate in 8 eyes, posterior in 33 eyes and panuveitis in 8 eyes. Mean age at
examination was 70 ± 12 years; mean logMAR BCVA at examination was 0.5 ± 0.3 and 44 eyes were pseudophakic.
The mean distance between two B-scans was 243 ± 8 µm (Fig. 1, individual B-scans are represented by green
lines). Across all B-scans, the median VI was 0.029 (interquartile range: 0.032), ranging from 0.0026 to 0.394. The
mean VI per eye did not differ significantly between phakic and pseudophakic eyes (P = 0.919). The intra-class
correlation coefficient of the VI values across the 9 B-scans was 0.923 (95% confidence interval 0.886 – 0.952),
indicating high agreement between VI values.
Smaller median differences indicate less variation from the chosen reference standard (i.e. the mean VI value
from 9 B-scans, Fig. 1). Table 1 shows that the median differences between the reference standard and the aver-
age values of scan selections (1 central scan, 1c; 3 central scans, 3c; 5 central scans, 5c; 7 central scans, 7c and 3
widely distributed scans, 3w) were noticeably different. For instance, the difference from the total VI average in
Scientific Reports | (2021) 11:3271 | https://doi.org/10.1038/s41598-021-82786-0 2
Vol:.(1234567890)www.nature.com/scientificreports/
Scan sub selection AUC [95% CI]
1 central scan (1c) 0.862 [0.753; 0.971]
3 central scans (3c) 0.870 [0.767; 0.974]
5 central scans (5c) 0.929 [0.855; 1.0]
7 central scans (7c) 0.985 [0.954; 1.0]
3 wide scans (3w) 0.965 [0.912:.1.0]
Table 2. Area under the curve values for the detection of values larger than the dataset’s median, per scan sub
selection. AUC, area under the curve; CI, confidence interval.
Figure 2. Receiver operating curves of the different scan sub selections. The state variable was the dataset’s
median. 1c, 1 central scan; 3c, 3 central scans; 5c, 5 central scans; 7c, 7 central scans; 3w, 3 wide scans.
9 B-scans was smaller in the sub selection 3w compared to 5c (Holm-Bonferroni adjusted P = 0.022). It was also
smaller in the sub selection 7c compared to 3w (Holm-Bonferroni adjusted P = 0.003).
Linear regression analysis revealed no significant associations between the two axes on Bland–Altman plots
with each other, comparing the reference standard with the VI scores from individual scan selections (compara-
tors: 1c, p = 0.907; 3c, p = 0.120; 5c, p = 0.172; 7c, p = 0.604; 3w, p = 0.243).
All area under the curve (AUC) values from ROC analysis were > 0.8 (Table 2), indicating high sensitivity
and specificity for the detection of values larger than the dataset’s median, i.e. detection of eyes with statistically
“higher inflammation” in contrast to eyes with “lower inflammation”. The scan sub selections 7c and 3w achieved
the highest sensitivity and specificity values (Fig. 2). We achieved similar results using a comparison with the
dataset’s upper and lower quartile as state variables (data not shown).
Discussion
The results indicate that Vitreous/RPE-relative intensity is consistent across OCT scans in individuals with
uveitis. Averaging the VI of several B-scans within one OCT volume scan further improved measurement reli-
ability because it reduces the influence of local structural alterations. VI calculation from three widely distributed
B-scans (average distance 1944 µm) achieves comparable results with VI calculation from nine equally distributed
B-Scans (average distance 486 µm) and allows for sufficient discrimination of different levels of inflammation.
Our results indicate that less dense scan patterns compare well to more dense scans in the quantification of
VI. As the biomarker itself as well as the measurement of vitreous inflammation using OCT are relatively novel,
no data comparing different scan densities for this purpose are available so far. However, different OCT scan
patterns of the macula have been compared in the literature with respect to detection of retinal biomarkers such
as the presence of intraretinal fluid and quantification of retinal layer thicknesses. Sayanagi and colleagues did
not find a significant difference in retinal thickness measurements of patients with macular diseases between a
dense OCT volume scan and a radial scan consisting of 6 lines14. Other groups confirmed that retinal thickness
can be measured almost as reliably with low B-scan density scans compared to high density scans in individuals
with defined macular diseases such as diabetic macular o edema15,16, age-related macular d egeneration17 and
cclusion18. Different studies showed the detection of fluid to be almost as sensitive in scan patterns
retinal vein o
Scientific Reports | (2021) 11:3271 | https://doi.org/10.1038/s41598-021-82786-0 3
Vol.:(0123456789)www.nature.com/scientificreports/
only 25–50% as dense as the respective reference standard in age-related macular degeneration, diabetic macular
oedema, retinal vein occlusion and other retinal diseases17–23.
Our main result that a pattern with a smaller number of OCT B-scans-based measurements is similarly
sensitive as a denser reference standard is thus consistent with findings reported in the literature. The scan sub
selection “3w” including a central B-scan and two peripheral B-scans was superior to a single central scan, 3
central scans and 5 central scans. Reliability can be increased with 7 B-scans, i.e. the difference from the refer-
ence standard was significantly lower, but the relevance of this small decrease in mean difference is unclear and
needs to be considered against the increased workload.
Of note is that the minimum scan density that can be recommended for the measurement of VI is lower
than the one recommended for use in retinal diseases to assess retinal thickness or presence of macular oedema
reported in the literature. The minimum number of B-scans required for these purposes varies between five
and 32 scans17–23. The diffuse nature of the signal in the vitreous cavity in inflammatory diseases in contrast to
clearly locatable pathologies in only a small part of the retina in retinal diseases might be a potential explana-
tion for this. However, the impact of local heterogeneity in vitreous haze or accumulation of inflammatory cells
(e.g. snowballs) on the OCT-based parameter and its changes with eye movement require further investigation.
The strengths of our study include a standardized imaging protocol for all participants, a relatively homog-
enous sample consisting of only uveitis patients (excluding anterior uveitis) and the use of a previously developed
algorithm which is already clinically validated. Limitations include the relatively small sample size with only a
limited number of B-scans per subject available, the use of only one device (Spectralis, Heidelberg Engineering),
the relatively high age of the participants for a uveitis population, and the limited availability of clinical data.
In this study we have considered measurements taken at a single visit, and therefore have not considered the
stability of the signal over time.
Overall, our study shows that automated determination of VI is reliable across OCT B-scans in uveitis
patients. The recommended minimum B-scan density for future research based on this parameter is three hori-
zontal scans: One central scan and two peripheral scans located approximately 2000 µm inferiorly and superiorly
from the central B-scan (3w). Measurements were even more stable across scans in a pattern of 7 horizontal
scans (7c) but we interpret this improvement as not clinically relevant compared to the recommended pattern.
In the future, further correlation of the data with clinical vitreous haze scores and other clinical variables as well
as further reliability analysis based on these values is warranted.
Methods
The retrospective study took place at the department of ophthalmology of the University of Bonn, Germany.
The institutional Ethics Committee (University Hospital Bonn, Germany) approved the use of retrospective data
for study purposes and approved that informed consent can be waived due to the use of retrospective data only
(no. 103/18). The study adhered to the principles of the declaration of Helsinki. Participants were included if
they had a form of Posterior Segment Involving Uveitis (PSIU) i.e. one of Intermediate, posterior or panuveitis
as classified according to the SUN c riteria3.
Image data. Macular OCT volume scans were retrospectively collected. OCT is a light-based, non-invasive
technique frequently applied in ophthalmology. It is based on local interference between two signals (object sig-
nal and reference signal)24,25. Using software, B-scans (e.g. axial) are automatically calculated from A-scans. Reti-
nal OCT B- scans show parts of the posterior vitreous cavity, the retinal layers as well as choroidal structures. The
volume scans were obtained with the Spectralis SD-OCT (Heidelberg Engineering, Heidelberg, Germany), with
a B-scan image resolution of 512 × 496 pixels and 5 images averaged (automated real-time tracking mode = 5).
Inclusion criteria were volume scans consisting of 19 B-scans each and a B-scan size of 20° × 15°. Exclusion cri-
teria were insufficient image quality (HEYEX software image quality score < 20 in > 3 B-scans), incomplete scan,
fixation errors and a presumed disease aetiology other than uveitis. Besides image data, age, uveitis classification,
best-corrected visual acuity (BCVA) and lens status of all included patients were collected.
Image analysis. Every other B-scan was selected from the OCT volume scans, resulting in 9 B-scans per
volume scan available for analysis (Fig. 1). As one of the previous VI algorithm validation studies included
a reference of 7 B-scans per volume, we used a comparable density as our gold standard11. The image data
and additional image acquisition parameters were imported into MATLAB, Version R2016a (The MathWorks,
Natick, Massachusetts, USA). The VI parameter Vitreous/Retinal Pigment Epithelium (RPE)-relative intensity
was automatically calculated per B-scan according to an algorithm that has previously been described and clini-
cally validated8–12,26. In summary, pre-processing steps include opening, thresholding and adjustment as out-
lined by Keane et al.9. The posterior part of the vitreous cavity is automatically detected and the OCT sum signal
in this area is quantified relative to the RPE signal intensity in order to lower the impact of media opacities on the
outcome parameter. The overall vitreous reflectivity is increased in inflammation which has been explained e.g.
by inflammatory components and proteins in the vitreous c avity9,26. B-scan quality was assessed for all selected
B-scans and the distance between B-scans was obtained per individual volume scan.
Statistical analyses. The intra-class correlation coefficient between all VI values per volume scan was cal-
culated. The single VI value of the central B-scan (1c) and averaged VI values of five combinations of B-scans (3,
5 and 7 central scans (3c, 5c, 7c), all 9 scans available for analysis (9 s), 3 widely distributed scans (3w); Fig. 1)
were computed for all volume scans included. The averaged VI value of 9 B-scans was used as the standard refer-
ence. Mean absolute differences between this reference and a single central B-scan VI as well as the averaged VI
values listed above (3c, 5c, 7c, 3w) were calculated. 95% limits of agreement (LoA) were calculated according to
Scientific Reports | (2021) 11:3271 | https://doi.org/10.1038/s41598-021-82786-0 4
Vol:.(1234567890)www.nature.com/scientificreports/
the formula LoA = mean ± 1.96 × standard deviation of the differences between the two measurements. Linear
regression analysis was performed based on Bland–Altman plots to identify associations between the above
mentioned mean absolute differences (e.g. 9 s-1c, 9 s-3c, 9 s-5c, etc.) and their respective means, excluding four
cases that were likely outside of the sensitivity range of our study (mean VI score > 0.1). In addition, we per-
formed receiver operating curve characteristic (ROC) analysis for discrimination of VI values greater or equal
and VI values smaller than the median VI value out of all B-scans.
Statistical analyses were performed with SPSS Statistics, version 25 (IBM Corporation, Armonk, New York,
USA) and R, version 3.5.0 (R Core Team, Vienna, Austria). Paired samples were compared with the Wilcoxon
rank sum test correcting for multiple comparisons using the Holm-Bonferroni m ethod27. The level of statistical
significance was P < 0.05.
Received: 26 May 2020; Accepted: 25 January 2021
References
1. Miserocchi, E., Fogliato, G., Modorati, G. & Bandello, F. Review on the worldwide epidemiology of uveitis. Eur. J. Ophthalmol. 23,
705–717 (2013).
2. Tsirouki, T. et al. A focus on the epidemiology of uveitis. Ocul. Immunol. Inflamm. 26, 2–16 (2018).
3. Standardization of Uveitis Nomenclature (SUN) Working Group. Standardization of uveitis nomenclature for reporting clinical
data Results of the First International Workshop. Am. J. Ophthalmol. 140, 509–516 (2005).
4. Kempen, J. H., Ganesh, S. K., Sangwan, V. S. & Rathinam, S. R. Interobserver agreement in grading activity and site of inflamma-
tion in eyes of patients with uveitis. Am. J. Ophthalmol. 146, 813-818.e1 (2008).
5. Davis, J. L. et al. Scale for photographic grading of vitreous haze in uveitis. Am. J. Ophthalmol. 150, 637-641.e1 (2010).
6. Tugal-Tutkun, I. & Herbort, C. P. Laser flare photometry: a noninvasive, objective, and quantitative method to measure intraocular
inflammation. Int. Ophthalmol. 30, 453–464 (2010).
7. Herbort, C. P., Guex-Crosier, Y., de Ancos, E. & Pittet, N. Use of laser flare photometry to assess and monitor inflammation in
uveitis. Ophthalmology 104, 64–71 (1997) (discussion 71-2).
8. Keane, P. A. et al. Objective measurement of vitreous inflammation using optical coherence tomography. Ophthalmology 121,
1706–1714 (2014).
9. Keane, P. A. et al. Automated analysis of vitreous inflammation using spectral-domain optical coherence tomography. Transl. Vis.
Sci. Technol. 4, 4 (2015).
10. Sreekantam, S. et al. Quantitative analysis of vitreous inflammation using optical coherence tomography in patients receiving
sub-Tenon’s triamcinolone acetonide for uveitic cystoid macular oedema. Br. J. Ophthalmol. 101, 175–179 (2017).
11. Montesano, G. et al. Optimizing OCT acquisition parameters for assessments of vitreous haze for application in uveitis. Sci. Rep.
8, 1–7 (2018).
12. Zarranz-Ventura, J. et al. Evaluation of objective vitritis grading method using optical coherence tomography: influence of phakic
status and previous vitrectomy. Am. J. Ophthalmol. 161, 172-80.e1–4 (2016).
13. Coric, D. et al. Objective quantification of vitreous haze on optical coherence tomography scans: no evidence for relationship
between uveitis and inflammation in multiple sclerosis. Eur. J. Neurol. 27, 144-e3 (2020).
14. Sayanagi, K., Sharma, S. & Kaiser, P. K. Comparison of retinal thickness measurements between three-dimensional and radial
scans on spectral-domain optical coherence tomography. Am. J. Ophthalmol. 148, 431–438 (2009).
15. Nittala, M. G., Konduru, R., Ruiz-Garcia, H. & Sadda, S. R. Effect of OCT volume scan density on thickness measurements in
diabetic macular edema. Eye (London) 25, 1347–1355 (2011).
16. Taban, M., Sharma, S., Williams, D. R., Waheed, N. & Kaiser, P. K. Comparing retinal thickness measurements using automated
fast macular thickness map versus six-radial line scans with manual measurements. Ophthalmology 116, 964–970 (2009).
17. Velaga, S. B. et al. Impact of optical coherence tomography scanning density on quantitative analyses in neovascular age-related
macular degeneration. Eye (London) 31, 53–61 (2017).
18. Rahimy, E., Rayess, N., Maguire, J. I. & Hsu, J. Radial versus raster spectral-domain optical coherence tomography scan patterns
for detection of macular pathology. Am. J. Ophthalmol. 158, 345-353.e2 (2014).
19. Fang, P. P. et al. Minimal optical coherence tomography B-scan density for reliable detection of intraretinal and subretinal fluid in
macular diseases. Retina 39, 150–156 (2019).
20. Baranano, A. E., Keane, P. A., Ruiz-Garcia, H., Walsh, A. C. & Sadda, S. R. Impact of scanning density on spectral domain optical
coherence tomography assessments in neovascular age-related macular degeneration. Acta Ophthalmol. 90, e274–e280 (2012).
21. Sadda, S. R., Keane, P. A., Ouyang, Y., Updike, J. F. & Walsh, A. C. Impact of scanning density on measurements from spectral
domain optical coherence tomography. Investig. Ophthalmol. Vis. Sci. 51, 1071–1078 (2010).
22. de Niro, J. E. et al. Sensitivity of fluid detection in patients with neovascular and using spectral domain optical coherence tomog-
raphy high-definition line scans. Retina 34, 1163–1166 (2014).
23. Adam, M. K., Rayess, N., Rahimy, E., Maguire, J. I. & Hsu, J. Radial versus raster spectral-domain optical coherence tomography
scan patterns for detection of macular fluid in neovascular age-related macular degeneration. Br. J. Ophthalmol. 100, 491–494
(2016).
24. Podoleanu, A. G. Optical coherence tomography. J. Microsc. 247, 209–219 (2012).
25. Huang, D. et al. Optical coherence tomography. Science (New York, N.Y.) 254, 1178–1181 (1991).
26. Denniston, A. K., Keane, P. A. & Srivastava, S. K. Biomarkers and surrogate endpoints in uveitis: the impact of quantitative imag-
ing. Investig. Ophthalmol. Vis. Sci. 58, BIO131–BIO140 (2017).
27. Holm, S. A simple sequentially rejective multiple test procedure. Scand. J. Statist. 6, 65–70 (1979).
Acknowledgments
This work was supported by the BONFOR GEROK Program, Faculty of Medicine, University of Bonn, Grant
No O-137.0028 to MWMW.
Author contributions
J.H.T. and R.P.F. designed the study, G.O., G.M., X.L., P.A.K. and A.K.D. created the software used in this work,
G.O., J.H.T. and M.L. acquired and analysed the data. J.H.T., M.W.M.W. and R.P.F. interpreted the data, J.H.T.
and R.P.F. drafted the manuscript, G.O., G.M., M.W.M.W., M.L., X.L., P.A.K., D.P.C. and A.K.D. substantively
revised the manuscript. All authors have approved the submitted version and have agreed both to be personally
accountable for the author’s own contributions and to ensure that questions related to the accuracy or integrity of
Scientific Reports | (2021) 11:3271 | https://doi.org/10.1038/s41598-021-82786-0 5
Vol.:(0123456789)www.nature.com/scientificreports/
any part of the work, even ones in which the author was not personally involved, are appropriately investigated,
resolved, and the resolution documented in the literature.
Funding
Open Access funding enabled and organized by Projekt DEAL. This research was supported by funding of the
German Scholars Organization/Else Kröner Fresenius Stiftung (GSO/EKFS 16) to RF, by BONFOR GEROK
Program, Faculty of Medicine, University of Bonn, Grant No. O-137.0028 to MWMW and by a Wellcome Trust
Health Innovation Challenge grant (200141/Z/15/Z) to XL, GO, AKD, DPC and PAK.
Competing interests
The Department of Ophthalmology, University of Bonn received imaging devices from Heidelberg Engineer-
ing, Optos, Carl Zeiss Meditec, and CenterVue. JHT: No additional conflicts of interest. GO: None. GM: None.
MWMW: Travel grant/reimbursement from DigiSight Technologies, Heine Optotechnik GmbH, ASKIN & CO
GmbH and Berlin-Chemie AG, grants from Heine Optotechnik and Berlin-Chemie AG, consultant for Heine
Optotechnik GmbH, imaging devices from DigiSight Technologies, D-EYE Srl and Heine Optotechnik GmbH,
free analysis from Eyenuk Inc. ML: No additional conflicts of interest. XL: None. PAK: Grants from Allergan,
Bayer, Carl Zeiss Meditec, Haag-Streit, Heidelberg Engineering, Novartis, Topcon, consultant for Deepmind.
AKD: None. DPC: Speaker fees from Allergan, Bayer, Santen; unrestricted funding from Allergan, Santen;
consultancy with Centervue—all outside the remit of the submitted work. RPF: Consultant for Bayer, Novartis,
Santen, Opthea, Novelion, Santhera, Inositec, Alimera and RetinaImplant; honoraria from Bayer, Ellex, Alimera.
Additional information
Correspondence and requests for materials should be addressed to J.H.T. or R.P.F.
Reprints and permissions information is available at www.nature.com/reprints.
Publisher’s note Springer Nature remains neutral with regard to jurisdictional claims in published maps and
institutional affiliations.
Open Access This article is licensed under a Creative Commons Attribution 4.0 International
License, which permits use, sharing, adaptation, distribution and reproduction in any medium or
format, as long as you give appropriate credit to the original author(s) and the source, provide a link to the
Creative Commons licence, and indicate if changes were made. The images or other third party material in this
article are included in the article’s Creative Commons licence, unless indicated otherwise in a credit line to the
material. If material is not included in the article’s Creative Commons licence and your intended use is not
permitted by statutory regulation or exceeds the permitted use, you will need to obtain permission directly from
the copyright holder. To view a copy of this licence, visit http://creativecommons.org/licenses/by/4.0/.
© The Author(s) 2021
Scientific Reports | (2021) 11:3271 | https://doi.org/10.1038/s41598-021-82786-0 6
Vol:.(1234567890)You can also read