Automatic Classification of Neuromuscular Diseases in Children Using Photoacoustic Imaging
←
→
Page content transcription
If your browser does not render page correctly, please read the page content below
Automatic Classification of Neuromuscular Diseases in
                                                     Children Using Photoacoustic Imaging

                                               Maja Schlereth1,2 , Daniel Stromer2 , Katharina Breininger1 , Alexandra Wagner3 ,
                                                              Lina Tan3 , Andreas Maier2 , Ferdinand Knieling3
                                                          1 Department  of Artificial Intelligence in Biomedical Engineering,
                                                                          FAU Erlangen-Nürnberg, Erlangen
arXiv:2201.11630v1 [eess.IV] 27 Jan 2022

                                                           2 Pattern Recognition Lab, FAU Erlangen-Nürnberg, Erlangen
                                                3 Department of Pediatrics and Adolescent Medicine, Universitätsklinik Erlangen, FAU
                                                                             Erlangen-Nürnberg, Erlangen
                                                                              maja.schlereth@fau.de

                                                  Abstract. Neuromuscular diseases (NMDs) cause a significant burden for both
                                                  healthcare systems and society. They can lead to severe progressive muscle weak-
                                                  ness, muscle degeneration, contracture, deformity and progressive disability. The
                                                  NMDs evaluated in this study often manifest in early childhood. As subtypes of
                                                  disease, e.g. Duchenne Muscular Dystropy (DMD) and Spinal Muscular Atrophy
                                                  (SMA), are difficult to differentiate at the beginning and worsen quickly, fast and
                                                  reliable differential diagnosis is crucial. Photoacoustic and ultrasound imaging
                                                  has shown great potential to visualize and quantify the extent of different dis-
                                                  eases. The addition of automatic classification of such image data could further
                                                  improve standard diagnostic procedures. We compare deep learning-based 2-class
                                                  and 3-class classifiers based on VGG16 for differentiating healthy from diseased
                                                  muscular tissue. This work shows promising results with high accuracies above
                                                  0.86 for the 3-class problem and can be used as a proof of concept for future
                                                  approaches for earlier diagnosis and therapeutic monitoring of NMDs.

                                           1    Introduction
                                           Duchenne Muscular Dystropy (DMD) and Spinal Muscular Atrophy (SMA) often man-
                                           ifest in early childhood and are hard to differentiate in early stages [1]. In severe cases,
                                           the muscles degenerate quickly, and reliable and fast diagnosis is necessary to start
                                           with the correct treatment as early as possible. Currently, confirmation of the diagnosis
                                           is typically done by genetic testing which takes up to several months [2]. To support
                                           an early assessment, imaging-based diagnosis has been proposed. Photoacoustic (PA)
                                           imaging has been investigated as an imaging modality for assessing neuromuscular dis-
                                           eases [3]. It comes with many advantages, as it is non-invasive, has a low acquisition
                                           time and is able to differentiate tissue composition based on their PA properties. While
                                           ultrasound (US) images depict the morphology of different tissue types, PA images
                                           contain functional information. For instance, the wavelength 800 nm helps to observe
                                           highly perfused and hemoglobin or myoglobin rich tissue, such as muscular or brain
                                           tissue [4, 5]. Regensburger et al. show that PA imaging can be successfully used to
                                           detect collagen tissue as a biomarker for DMD as muscular tissue degenerates in DMD
                                           and is replaced by collagen or fatty tissue [6]. The authors found significant differences

                                                                                                                                        1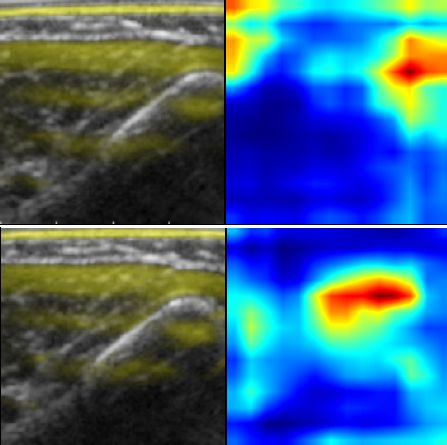
2                                                                           Schlereth et al.

between healthy and diseased tissue regarding signal intensity for collagen. To analyse
the data, regions of interest were manually drawn and individually evaluated for each
patient. To overcome these limitations, automatic image processing and classification
can be used [7]. Zhang et al. propose a traditional machine learning (ML) and a deep
learning (DL) method using AlexNet and GoogLeNet for classification of breast cancer
for PA images with high accuracies [8], which motivates the use of DL for diagnosis of
SMA and DMD.
    Our main contributions are the development and evaluation of binary classifiers
that differentiate between healthy volunteers and DMD or SMA patients as a proof-
of-concept study as well as a three-class classifier (healthy control, DMD, SMA) for a
differential diagnosis. As DMD and SMA are difficult to differentiate in early stages,
an additional indicator could speed up the diagnostic process. We compare the use of
US and PA images with different wavelengths and spectrally unmixed signals (SUS) as
input to the network for classification. Furthermore, we analyse the performance of the
classifiers across age groups/severity and identify next steps to provide clinicians with
rapid diagnostic support for muscular diseases using PA imaging.

2     Materials and methods

In the following section, we will shortly describe the data sets, image preprocessing and
the experimental setup for the two-class and three-class problem to differentiate between
DMD, SMA and healthy volunteers.

2.1   Datasets
Image data from two studies considering both DMD and SMA were provided by the De-
partment of Pediatrics and Adolescent Medicine at the University Hospital of Erlangen.
In these studies PA raw data were generated from 10 patients with DMD, 10 patients
with SMA and 20 age-matched controls using a handheld PA system (MSOT Acuity
Echo, iThera Medical GmbH, Munich, Germany). In total, the dataset consists of 10 683
valid image frames per single-wavelength (WL) or per SUS. A WL or SUS is used
for visualization of different tissue types. Each task was performed with four different
input images, i.e., US images, two different WL images (800 nm, 920 nm) and a SUS
image (Collagen). At this stage no raw data but only preprocessed data as provided by
the vendor software were available, and combining different WL/SUS images did not
provide a benefit within this setup.
    For DMD, which usually worsens with age, the data is divided into age groups which
correlate with the progress of the disease. Three patients aged 5–6, five patients aged
7–8 and two patients aged 9–10 were examined. For SMA, the data is divided by the
type of SMA. Patients with type SMA 1 exhibit more obvious symptoms than patients
with SMA 2 or 3. For SMA, two patients with SMA 1, four patients with SMA 2 and
four patients with SMA 3 were considered. For each class, the data is split patient-wise
into training, validation and test set with ratio 0.5, 0.2, 0.3 to represent each severity
stage of DMD and SMA in the test set. As the selection of the input image and network
architecture was highly exploratory, we opted not to use cross-validation.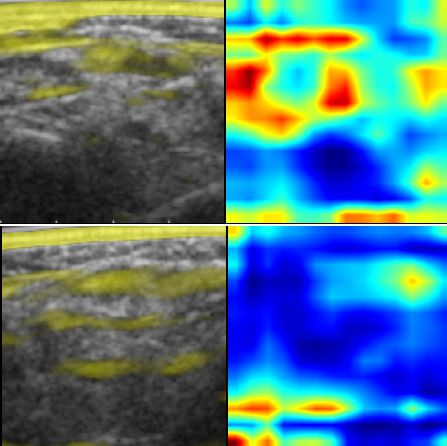
Photoacoustic Imaging for Neuromuscular Diseases                                        3

2.2   Pre-processing

To obtain the required PA images, the provided raw data was processed with the vendor
specific-software to obtain four images containing one WL/SUS each. Furthermore, they
were resized to 224×224 px.

2.3   Experimental setup
A VGG16 network was trained for each classification task (control vs. DMD: 2-class
DMD, control vs. SMA: 2-class SMA, control vs. DMD vs. SMA: 3-class) with each
of the four different input image types separately. We then used the validation set to
determine the best performing WL/SUS for each task for further investigation. For both
the two-class and three-class classification tasks, a weighted cross entropy loss was
used as loss function to counteract class imbalance. Stochastic gradient descent (SGD)
with momentum was set as optimizer. VGG16 was pre-trained on the ImageNet dataset
and all weights were frozen except for the last layer [9]. Here, random augmentation
techniques were applied to improve the training process (random brightness, noise,
saturation, rotation and left-right flipping). Finally, the data was normalized to match
ImageNet statistics. For the three-class problem, Gradient-weighted Class Activation
Mapping (Grad-CAM) was used to highlight regions relevant for the network predictions
from VGG16 and further investigate the network prediction. The resulting images were
evaluated jointly with a pediatrician (F.K.) experienced in working with US and PA
images of muscular tissue.

3     Results
As discussed in the previous section, a separate neural network was trained for each input
image type and each classification task. During validation, US showed the best accuracy
across all tasks with 0.96 (2-class DMD), 0.83 (2-class SMA) and 0.91 (3-class). Out
of the PA images, 920 nm provides the best validation accuracy for 2-class DMD (0.95)
and the 3-class case (0.83), whereas the 800 nm image showed the best accuracy for
2-class SMA.
    For the final evaluation on the test set, we use the VGG16 networks trained with US
and best performing PA image on the validation set, i.e., the 920 nm WL for the 2-class
DMD and the 3-class case, and the 800 nm WL for the 2-class SMA. Table 1 shows
the final evaluation results on unseen images. All tasks show high accuracies ranging
from 0.86 to 1.00 with better performance for the networks with US input, but also
discriminative power from the networks with PA input.
    Table 2 shows the true positive rate broken down by disease severity for all frames
from the three DMD and SMA patients of the test set, respectively, using US and 920 nm
input images. As expected, we mainly see errors in patients which are in an earlier stage
of disease progression, i.e., DMD at age 5 and SMA type 3. While the error rates are
similar for DMD across US and 920 nm, we see a considerably larger difference in errors
for SMA between the input types. Table 3 shows the confusion matrix for the 3-class
case using US and 920 nm images. Figure 1 shows the activated gradients for VGG16
4 Schlereth et al.
Tab. 1. Accuracy, recall, precision, AUC and F1 score for unseen test data for both 2-class and
the 3-class tasks using US and the best PA WL/SUS as input and VGG16 as network architecture.
Input Accuracy Recall Precision AUC F1
2-class DMD US 0.95 0.92 0.97 0.95 0.95
920 nm 0.90 0.82 0.96 0.90 0.90
2-class SMA US 1.00 1.00 0.99 0.99 0.99
800 nm 0.86 0.97 0.69 0.89 0.86
3-class DMD US 0.94 0.87 0.98 0.94 0.92
920 nm 0.91 0.86 0.95 0.91 0.90
3-class SMA US 0.94 1.00 0.99 0.94 0.99
920 nm 0.91 0.59 0.93 0.91 0.72
Tab. 2. Percentage of frames classified correctly as DMD or SMA (true positive rate, 3-class
case) for three DMD and three SMA patients broken down by different disease states using US
and 920 nm images as input. Left: DMD, ages 5,7 and 10. Right: SMA type 1, 2 and 3.
DMD SMA
Age 10 Age 7 Age 5 Type 1 Type 2 Type 3
US 97 % 98 % 70 % 100 % 100 % 100 %
920 nm 90 % 99 % 69 % 100 % 49 % 31 %
Tab. 3. Relative confusion matrix for US and 920 nm of the 3-class case comparing network pre-
diction and ground truth (GT) labels. Diagonal elements shows percentage of correctly classified
frames.
Predicted
US 920 nm
Healthy DMD SMA Healthy DMD SMA
Healthy 98.6 % 1.3 % 0.1 % 97.3 % 2.3 % 0.4 %
GT DMD 12.5 % 87.5 % 0% 14 % 86 % 0%
SMA 0% 0% 100 % 33.6 % 7.1 % 59.3 %
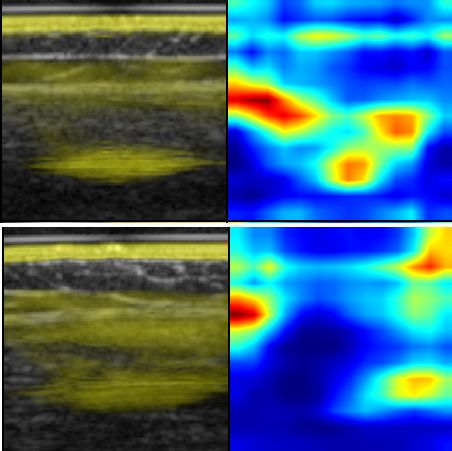
in layer 29 of six different 920 nm WL images. One example each for SMA, DMD and
healthy control which is correctly classified and one example each which is wrongly
classified is exhibited. The visualization using Grad-CAM shows activated gradients for
correctly classified SMA in the central muscle area. In the wrongly classified scan, no
central activation is visible. For correctly classified DMD, strong activations are visible
in more superficial muscular areas. For the correctly classified healthy scan, no central
activations are present.
4 Discussion
In this paper, we show initial results for the classification of neuromuscular diseases
based on US and PA images for pediatric patients suffering from DMD and SMA. These
initial results on a small dataset are promising across the different settings and tasks.Photoacoustic Imaging for Neuromuscular Diseases 5
While US imaging provides slightly better quantitative classification results compared
to PA input images in our study, clinical observations indicate the potential for an added
value by PA images as it may offer finer gradation than US alone. Specifically, it is able to
enrich the imaging data with functional information beyond the morphological structures
visible in US. As we could not demonstrate a benefit in preliminary experiments yet,
further research will have to investigate the potential of combining PA and US images
and the limitations of this strategy under a more careful preprocessing scheme.
The dataset in the current study was acquired from a small study population with a
comparatively simple network architecture and further evaluation has to be performed to
validate our findings. In preliminary experiments, other architectures such as AlexNet,
ResNet and EfficientNet-B0 were also considered and performed on par or slightly lower
compared to VGG16. An evaluation of this performance difference will be interesting to
(a) SMA. (b) DMD.
(c) Healthy.
Fig. 1. Grad-CAM results for (a) SMA, (b) DMD and (c) healthy. Left: 920 nm image (yellow)
overlayed on US image, right: heatmap of activated gradients. Highly activated regions are depicted
in red and localize class discriminative features. Top row is correctly classified, bottom row is
wrongly classified.6 Schlereth et al.
discuss in future work. Due to the small dataset, we opted for a frame-wise evaluation of
the classification. We expect that the classification performance can be increased further
if multiple frames or scans of one patient are considered, e.g., via majority voting. On
a larger dataset, we further see considerable potential for using multiple input images
jointly for a classification to combine complementary information across US and PA,
i.e., combining morphology and functional information. This also translates to other
applications such as inflammatory diseases where increased blood circulation in the
injured region may be identified in the PA images whereas morphological changes can
be identified in US images.
Our analysis shows a connection between the number of correctly classified scans
and age for DMD, and correctly classified frames and subtype for SMA. This matches
well with the fact that older patients in the case of DMD also exhibit more distinct
clinical symptoms [1] and that clinical symptoms vary in severeness in the different
SMA subtypes [10]. It can therefore be postulated that the disease progression also has
clear impact both on the measured US and PA signal. US and PA could potentially
be used to monitor treatment process and medication response to support personalized
treatment planning and assessment if further research confirms predictability of severity
for each disease. Despite the slightly lower performance of PA compared to US, PA’s
inherent properties will make it an interesting choice for future applications.
References
1. Feldman EL. Atlas of neuromuscular diseases. Springer, 2005.
2. Stuberg WA. Muscular dystrophy and spinal muscular atrophy. Physical therapy for children
(2006), pp. 421–452.
3. Wagner AL, Danko V, Federle A, Klett D, Simon D, Heiss R et al. Precision of hand-
held multispectral optoacoustic tomography for muscle imaging. Photoacoustics 21 (2021),
p. 100220.
4. Phelps JE, Vishwanath K, Chang VTC, Ramanujam N. Rapid ratiometric determination of
hemoglobin concentration using UV-VIS diffuse reflectance at isosbestic wavelengths. Opt
Express 18.18 (2010), pp. 18779–18792.
5. Kirchner T, Gröhl J, Holzwarth N, Herrera MA, Hernández-Aguilera A, Santos E et al.
Photoacoustic monitoring of blood oxygenation during neurosurgical interventions. Photons
Plus Ultrasound. Ed. by Oraevsky AA, Wang LV. Vol. 10878. International Society for Optics
and Photonics. SPIE, 2019, pp. 14–18.
6. Regensburger AP, Fonteyne LM, Jüngert J, Wagner AL, Gerhalter T, Nagel AM et al.
Detection of collagens by multispectral optoacoustic tomography as an imaging biomarker
for Duchenne muscular dystrophy. Nat Med 25.12 (2019), pp. 1905–1915.
7. Gröhl J, Schellenberg M, Dreher K, Maier-Hein L. Deep learning for biomedical photoa-
coustic imaging: A review. Photoacoustics 22 (2021), p. 100241.
8. Zhang J, Chen B, Zhou M, Lan H, Gao F. Photoacoustic image classification and segmentation
of breast cancer: A feasibility study. IEEE Access 7 (2019), pp. 5457–5466.
9. Simonyan K, Zisserman A. Very deep convolutional networks for large-scale image recogni-
tion. https://arxiv.org/pdf/1409.1556. 2014.
10. Schara U, Schneider-Gold CJ, Schrank B. Klinik und Transition neuromuskulärer Erkrankun-
gen. Berlin: Springer, 2015.You can also read