Back to Goldilocks? Schroders Investment Conference Edinburgh 2019 Keith Wade, Chief Economist
←
→
Page content transcription
If your browser does not render page correctly, please read the page content below

Back to Goldilocks?
Schroders Investment Conference Edinburgh 2019
Keith Wade, Chief Economist
May 2019                                         For professional investors or advisers only. Not for retail clients

Back to Goldilocks?
Key issues

    Where are we in the cycle ?

    Back to Goldilocks ?

    What about Brexit ?

1
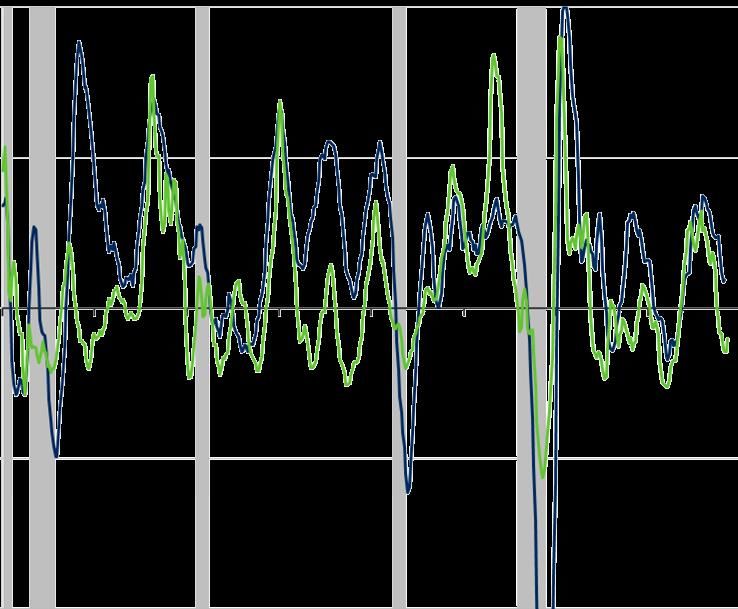
Spring search for green shoots
Commodity prices and orders stabilise

                                                                                   Index                                                               % 3m y/y
 10                                                                         100    55                                                                        7

                                                                                   54                                                                        6

                                                                                   53
    5                                                                       50                                                                               5
                                                                                   52
                                                                                                                                                             4
                                                                                   51
    0                                                                       0                                                                                3
                                                                                   50
                                                                                                                                                             2
                                                                                   49

    -5                                                                      -50                                                                              1
                                                                                   48

                                                                                   47                                                                        0

-10                                                                         -100   46                                                                        -1
   1980     1985      1990     1995     2000      2005     2010      2015            2012   2013      2014      2015   2016     2017       2018      2019

                   Recession
                   G7 Production – total industry excl. construction Vola
                                                                                            New export orders, world    Global import volumes (3mma), rhs
                   S&P GSCI Industrial Metals Spot

Source: Thomson DataStream, Schroders Economics Group. 7 May 2019.

2
Our global activity indicator remains weak
Surveys yet to signal turning point

Source: Thomson Reuters Datastream, Schroders, G0005, updated 2 May 2019.

3
Stock-building has boosted activity
UK inventories hit a record high ahead of Brexit

                                                                                    “   We thought just in case there
                                                                                        were significant delays at ports
                                                                                        as a result of Brexit, that we
                                                                                        ought to increase our cover by
                                                                                        about an extra month’s supply,
                                                                                        so didn’t sell out. The Holy Grail
                                                                                        of retailing is you don’t want to
                                                                                        hold more stock than you need
                                                                                        to — but given the high-profile
                                                                                        nature of that event, we
                                                                                        genuinely thought it would be
                                                                                        important to hold a few more

                                                                                                                         ”
                                                                                        weeks’ stock just in case.

                                                                                        Fortnum & Mason CEO Ewan Venters, in an
                                                                                            interview with Talk Radio, 4 April 2019.

Source: Thomson Datastream, IHS Markit, Schroders Economics Group. 29 April 2019.

4
China: real GDP stable in Q1, beating expectations
Higher frequency data shows support from industrial production

16
                                                                                                                                            Q4     Q1
                                                                                                                        Factor (y/y, %)
                                                                                                                                          2018   2019
14
                                                                                                                        Retail Sales       8.3    8.5
12
                                                                                                                        Industrial
                                                                                                                                           5.6    6.9
                                                                                                                        Production
10

                                                                                                                        Exports            4.0    1.4
 8
                                                                                                                        Fixed Asset
                                                                                                                                           7.3    6.3
 6                                                                                                                      Investment

 4

 2

 0
     04     05      06      07      08      09      10      11          12   13   14     15     16       17   18   19
                               Schroders China Activity Indicator             Real GDP growth (%, y/y)

Source: Thomson Datastream, Schroders Economics Group. 17 April 2019.

5
China: credit impulse looks to have turned
Uptrend from here seems likely
New credit % GDP                                                                                                                   y/y, %
40                                                                                                                                    60

                                                                                                                                       50
35
                                                                                                                                       40

30                                                                                                                                     30

                                                                                                                                       20
25
                                                                                                                                       10

20                                                                                                                                     0

                                                                                                                                       -10
15
                                                                                                                                       -20

10                                                                                                                                     -30
     07             08             09             10             11      12   13   14     15            16              17   18   19

                                                Credit impulse (12mma)                  Total property sales ytd, rhs

Source: Thomson Datastream, Schroders Economics Group. 23 April 2019.

6
Goldilocks – what might extend the US cycle?
Inflation has surprised to the downside
y/y, %                                                                                                                                  y/y, %
 3.5                                                                                                                                       8.0

 3.0
                                                                                                                                           6.0

 2.5

                                                                                                                                           4.0
 2.0

 1.5                                                                                                                                       2.0

 1.0
                                                                                                                                           0.0

 0.5

                                                                                                                                           -2.0
 0.0

-0.5                                                                                                                                      -4.0
    1995 1996 1997 1998 1999 2000 2001 2002 2003 2004 2005 2006 2007 2008 2009 2010 2011 2012 2013 2014 2015 2016 2017 2018 2019 2020 2021

                                                                        Core CPI   US GDP, 6Q lag., rhs

Source: Thomson Reuters DataStream, Schroders, updated 23 April 2019.

7
Goldilocks – what might extend the cycle?
Wage growth and productivity
y/y, %
4.0 30 6
5
3.5 25
4
3.0 20
3
2.5 15 2
1
2.0 10
0
1.5 5
-1
1.0 0 -2
2004 2006 2008 2010 2012 2014 2016 2018 2020 60 65 70 75 80 85 90 95 0 5 10 15
Recession Recession
ECI y/y % Labour productivity (output/hour) – Non-farm business y/y %, 1 year moving average
NFIB Survey % firms planning to raise worker compensation 3mma, 6m lag (rhs) 7y moving average
Source: Thomson Reuters Datastream, Schroders g0065 Updated 8 May 2019.
8Trade war: truce declared on again? Will talks lead to peace? Or are the two sides playing different games? Source: South China Morning Post (image – all rights reserved). Schroders Economics Group. 7 January 2019. 9
Geopolitical disruption will persist
Rise of China alters US approach to international relations
% share of world GDP
40
                                                                                                      Forecast
35

30

25

20

15

10

 5

 0
  1980         1985         1990        1995         2000        2005         2010        2015         2020        2025         2030        2035
                                                    China                   USA

Source: Thomson DataStream, Oxford Economics, Schroders Economics Group. Economist Magazine, November 2018.
Note: The forecasts should be regarded as illustrative of trends. Actual figures will differ from forecasts. Please see Important Information regarding forecasts.

10
What might end the US cycle? Fading fiscal stimulus
Impact of Tax Cuts and Jobs Act (2017) and the Bipartisan Budget Act (2018)
Impact on the budget deficit Impact on GDP growth
Budget deficit (% of GDP) Real GDP growth, % y/y
6 3.0
5 2.5 +0.7
+0.5
4 2.0
3 1.5 +0.3
2 1.0
1 0.5
0 0.0
2016 2017 2018 2019 2020 2021 2022 2016 2017 2018 2019 2020
Current Law Underlying growth Impact of Tax Cuts & Jobs Act
New spending bill (BBA, 2018) Impact of BBA Impact of lifting sequester caps
New spending bill without sequester caps
Source: Oxford Economics, Congressional Budget Office, Schroders Economics Group. 14 November 2018.
11Profits under pressure
Low inflation plus rising costs equals margin squeeze
Share of profits in GDP (ex financials), %
12
Forecast
10
8
6
4
2
0
1996 1998 2000 2002 2004 2006 2008 2010 2012 2014 2016 2018 2020
Recession Pre-tax After-tax
Source: Thomson Datastream, Schroders Economics Group. 4 April 2019.
12Where are the risks?
Balance skewed toward weaker growth
Cumulative 2019/20 Inflation vs. baseline forecast
2.0 Stagflationary Reflationary
1.5
Global inflation surge
1.0
US supply side surprise
0.5 Trade war: US vs. Rest of the World
Italian debt crisis China reopens the spigots
0.0
Baseline
-0.5 US 2020 recession
Recession ex. US
-1.0
-1.5
Deflationary Productivity boost
-2.0
-2.0 -1.5 -1.0 -0.5 0.0 0.5 1.0 1.5 2.0
Cumulative 2019/20 Growth vs. baseline forecast
Source: Schroders. 27 February 2019 forecast. Schroders’ Economics Group baseline 2019 forecast 2.8% global growth and 2.4% global inflation. The forecasts included should not be relied upon, are not
guaranteed and are provided only as at the date of issue. Our forecasts are based on our own assumptions which may change. We accept no responsibility for any errors of fact or opinion and assume no
obligation to provide you with any changes to our assumptions or forecasts. Forecasts and assumptions may be affected by external economic or other factors.
13Brexit – what on earth is going on? Source: Kal (all rights reserved). 14
That sinking feeling – the Brexit effect so far
The UK has slipped from top of the G7 growth league
Real GDP growth, % y/y
 6
                                                                                                                 UK Brexit
                                                                                                                 referendum
 4

 2

 0

-2

-4

-6

-8
  2008             2009             2010             2011               2012   2013         2014   2015   2016        2017    2018
                                                                                 G7 range     UK

Source: Thomson Datastream, Schroders Economics Group. 29 March 2019.

15
The road ahead
Brexit countdown
29 Sept 17–18
23 May 1 Jun 1 Aug 31 Oct 2025
– 2 Oct Oct
European UK leaves EU UK leaves EU Tory party EU summit Brexit day UK-EU trade
elections (if does not (if supports conference (Hard Brexit, deal agreed
take part in PM’s (May leaves?) or start of
EU elections) withdrawal transition to
agreement) end 2022?)
Source: Schroders Economics Group. 7 May 2019.
16Important information For professional investors only. The material is not suitable for retail clients. The views and opinions contained herein are those of Keith Wade, Chief Economist, and may not necessarily represent views expressed or reflected in other Schroders communications, strategies or funds. This presentation is intended to be for information purposes only and it is not intended as promotional material in any respect. The material is not intended as an offer or solicitation for the purchase or sale of any financial instrument. The material is not intended to provide, and should not be relied on for, accounting, legal or tax advice, or investment recommendations. Information herein is believed to be reliable but Schroder Investment Management Ltd (Schroders) does not warrant its completeness or accuracy. The data has been sourced by Schroders and should be independently verified before further publication or use. No responsibility can be accepted for error of fact or opinion. This does not exclude or restrict any duty or liability that Schroders has to its customers under the Financial Services and Markets Act 2000 (as amended from time to time) or any other regulatory system. Reliance should not be placed on the views and information in the document when taking individual investment and/or strategic decisions. Past Performance is not a guide to future performance and may not be repeated. The value of investments and the income from them may go down as well as up and investors may not get back the amounts originally invested. Company names are mentioned for illustrative purposes only and should not be viewed as a recommendation to buy or sell securities issued by those companies. The forecasts included should not be relied upon, are not guaranteed and are provided only as at the date of issue. Our forecasts are based on our own assumptions which may change. Forecasts and assumptions may be affected by external economic or other factors. Issued by Schroder Investment Management Limited, 1 London Wall Place, London EC2Y 5AU. Registration No. 1893220 England. Authorised and regulated by the Financial Conduct Authority. 17
You can also read