Renewables: Getting From Promise to Performance - What Will It Take? - Edwin F. Feo USRG Renewable Finance - Aquarium of ...
←
→
Page content transcription
If your browser does not render page correctly, please read the page content below
Renewables: Getting From Promise to Performance –
               What Will It Take?
                  Edwin F. Feo                     1

              USRG Renewable Finance
Overview
Renewable Energy– Current
and Projected
Challenges to Deployment
Solutions
Example - the Future of
Wind Energy - 20% by 2030
2
Sources and Uses

                   3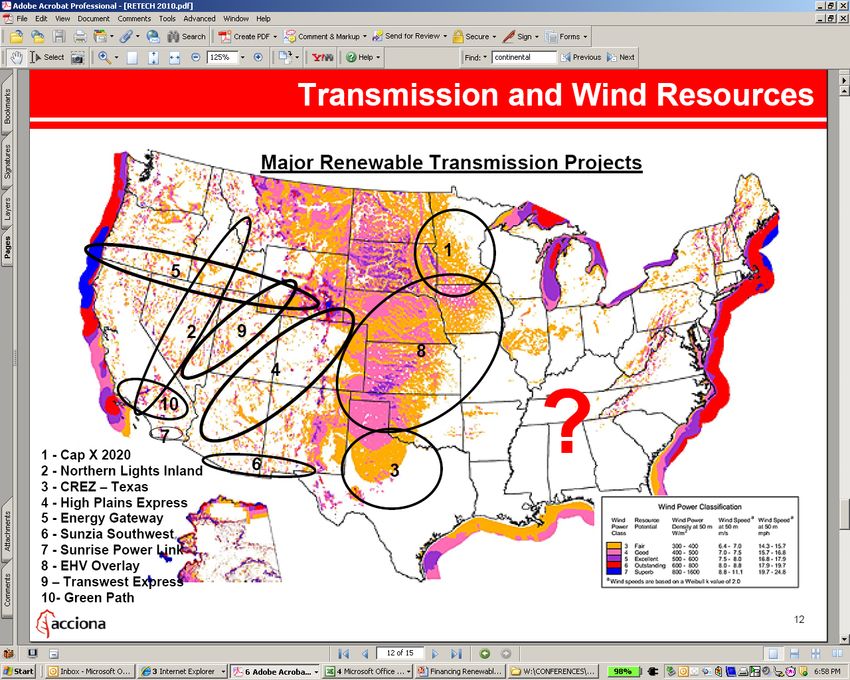
Renewable Resources

                                         20-30% of Energy Needs…
                                                                   4
Source: AWEA, US DOE, Acciona, 2010
Primary Energy Production by Source 2008

1
2 Includes lease condensate.
3 Conventional hydroelectric power
  Natural gas plant liquids
Source: Energy Information Administration, 2010   5

US Electric Power Industry Net Generation 2008

Source: Energy Information Administration, 2010

                                                  6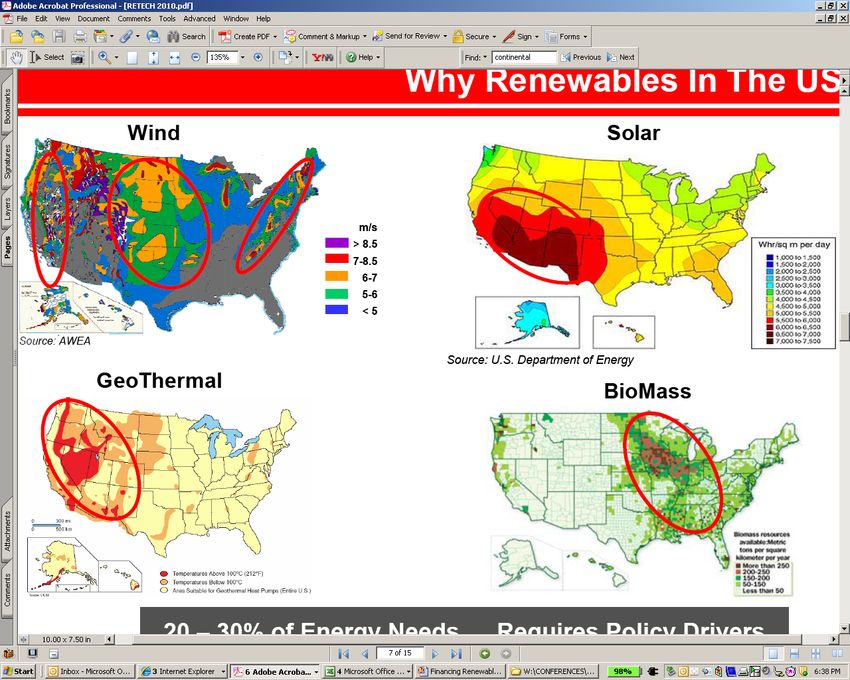
Non-fossil Energy Use: Predictions

Non-fossil energy use grows rapidly, but fossil fuels still provide 78 percent of total
energy use in 2035
Source: Johns Hopkins SAIS, Energy Information Administration, 2009                       7

Non-fossil Energy Use: Predictions

Non-hydropower renewable sources meet 41% of total electricity generation growth -from 2008 to 2035
Source: Johns Hopkins SAIS, Energy Information Administration, 2009                                   8
Challenges

             9
Challenges to Use of Renewable Sources
Relative Cost of Energy
Technology Development
Customer Acceptance
Infrastructure
Environmental Impact– Siting Challenges
10Cost of Energy
Levelized Cost of Energy: $/MWh
Source: New Energy Finance, 2009
11Average Retail Price of Electricity by State, 2008
12
Source: Energy Information Administration, 2010Transmission – Major Backlogs
California had over 13,000 MW of
wind energy waiting to connect to the
grid
70,000 MW of wind energy waiting to
interconnect in the upper Midwest
40,000 MW of wind energy in the
lower Midwest
40,000 MW of wind energy in the
Great Lakes/Mid-Atlantic
50,000 MW of wind energy in Texas
13Transmission and Wind Resources
Source: Acciona, 2010
14Solutions
15Policy Solutions
Federal Incentives– Taxes, Grants, Loans
Other Financial Incentives
Federal Renewable Fuel Mandate
Renewable Portfolio Standards
Infrastructure and Permitting
16Federal Tax Incentives IRC Section 45 Production Tax Credit IRC Section 48 Production Tax Credit RE Manufacturer’s Tax Credit Accelerated and Bonus Depreciation Ethanol Production, Use and Sale Alternative Fuel Mixture Credit Cellulosic Biofuel Producer Tax Credit 17
Other Federal Incentives
DoE Loan Guaranty Program
1703– federal loans for innovative technology
1705– support financing for commercial technology
ARPA-E grants
Treasury Grant Program
In lieu of tax credits
18Renewable Fuel Standard
Energy Security Act of 2007
increased Renewable Fuels
Standard to 36 billion gallons
by 2022
Set mandatory blend levels for
renewable fuels and
establishes GHG reduction
criteria
RF producers required to
register with the EPA
Regulations apply to refiners,
blenders and importers
Source: www.EPA.gov - EPA presentation on Energy
19
Independence and Security Act of 2007: Key Provisions Affecting
Combined Heat and Power.Renewable Portfolio Standards
www.dsireusa.org / October 2010
ME: 30% x 2000
VT: (1) RE meets any increase in retail New RE: 10% x 2017
WA: 15% x 2020* sales x 2012;
MN: 25% x 2025 (2) 20% RE & CHP x 2017
MT: 15% x 2015 (Xcel: 30% x 2020) NH: 23.8% x 2025
OR: 25% x 2025 (large utilities)* ND: 10% x 2015 MI: 10% + 1,100 MW x 2015* MA: 22.1% x 2020 New RE: 15% x
2020
5% - 10% x 2025 (smaller utilities) (+1% annually thereafter)
SD: 10% x 2015
WI: Varies by utility;
10% x 2015 statewide NY: 29% x 2015 RI: 16% x 2020
NV: 25% x 2025* CT: 23% x 2020
IA: 105 MW
OH: 25% x 2025†
PA: ~18% x 2021†
CO: 30% by 2020 (IOUs)
10% by 2020 (co-ops & large munis)*
WV: 25% x 2025*†
IL: 25% x 2025 NJ: 22.5% x 2021
CA: 33% x 2020 KS: 20% x 2020
UT: 20% by 2025* VA: 15% x 2025* MD: 20% x 2022
MO: 15% x 2021
DE: 25% x 2026*
AZ: 15% x 2025
OK: 15% x 2015
NC: 12.5% x 2021 (IOUs) DC DC: 20% x 2020
10% x 2018 (co-ops & munis)
NM: 20% x 2020 (IOUs)
10% x 2020 (co-ops)
PR: 20% x 2035
TX: 5,880 MW x 2015
HI: 40% x 2030
29 states +
Renewable portfolio standard Minimum solar or customer-sited requirement DC and PR have
*† an RPS
Renewable portfolio goal
Extra credit for solar or customer-sited renewables
Solar water heating eligible (7 states have goals)
Includes non-renewable alternative resources 20California RPS: 20% (Headed to 33%)
IOUs to achieve 20% or financial penalty
Major municipals have instituted programs
Proposed 33% by 2020
Currently 15% average
RFO process
Results in long-term power purchase agreements
Terms up to 25 years
Fixed price (with TOU variation)
MPR
21Utility Compliance with RPS
22Other State Incentives
Property tax exemptions
California Solar Initiative (2006)
Global Warming Solutions Act
(AB32) (2006)
Feed in Tariff (2010)
23Infrastructure and Siting
Federal Transmission Policy– National Security
Corridors
BLM Programmatic Approach
Offshore Leases– Authority of DOI and FERC
State Programs
CREZ, RETI
Expedited CEC Siting
24What Else?
Federal RES?
Cap and Trade or Carbon Tax?
Federal FIT?
Federal Transmission Siting?
25US Energy Bills/Climate Change Initiatives
Bill Number Sponsor(s) Status
American Clean Energy H.R. 2454 Waxman-Markey Jul 7, 2009: Read the second
and Security Act time. Placed on Senate
Legislative Calendar under
General Orders.
Clean Energy Jobs and S. 1733 Kerry-Boxer Feb 2, 2010: Placed on Senate
American Power Act Legislative Calendar under
General Orders. Calendar No.
267.
American Clean Energy S. 1462 Bingaman Jul 16, 2009: Placed on Senate
Leadership Legislative Calendar under
General Orders. Would require
15% renewable electric standard
for large utilities.
Clean Energy Partnerships S. 2729 Stabenow Nov 5, 2009: Sponsor
Act introductory remarks on
measure. (S11202-11203)
Clean Energy Act S. 2776 Alexander-Webb Nov 16, 2009: Read twice and
referred to the Committee on
Energy and Natural Resources.
Carbon Limits and Energy S. 2877 Cantwell- Collins Dec 11, 2009: Read twice and
for American’s Renewal referred to the Committee on
Finance.
Act 26Example
DoE Study on the Future of Wind
Energy – 20% by 2030
27Scope and Findings
Department of Energy study in 2008 re requirements to achieve
20% Wind Energy Generation by 2030
Focus on federal policies necessary to meet a wind penetration
target
Primary Findings
20% wind electricity would require about 300 GW (300,000 MW)
of wind generation
Affordable, accessible wind resources available across the
nation
Cost to integrate wind modest
Emissions reductions and water savings
Transmission a challenge
28Policies Considered
Current State RPS
Continuation of Tax Credits
Areas of Change:
Federal RES
Carbon Pricing
29National RES Model
30Carbon Policies Model
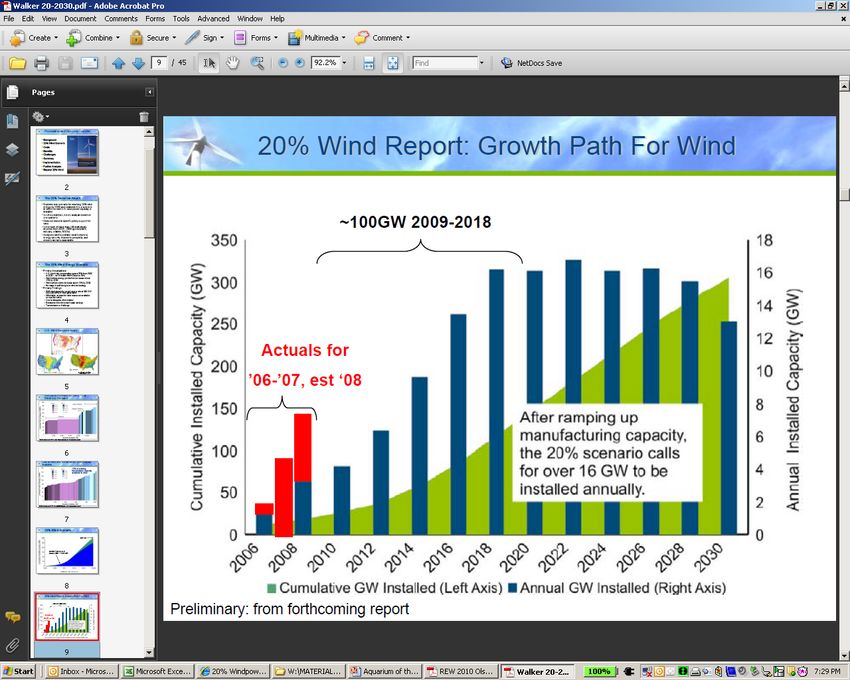
31Growth Path for Wind Source: DOE, AWEA. enXco 2009 32
Base Case - Capacity

Source: Black & Veatch, 2010

                                                      33
20% Wind Scenario Impact on Generation Mix in 2030
Reduces electric utility
natural gas consumption
by 50%
Reduces total natural gas
consumption by 11%
Natural gas consumer
benefits: $86-214 billion*
Reduces electric utility
coal consumption by 18%
Avoids construction of 80
GW of new coal power
plants
Source: DOE, AWEA. enXco 2009 34Results of RPS, RES
35Carbon Price Initially a Weak Driver
36Carbon Price Effect
37CO2 Results
Source: Black & Veatch, 2010
38Medium Carbon + High RES = Steady Growth
39Policy Contributions Toward Goals
Source: Black & Veatch, 2010
40Biomass Issues
Questions?
41About the Presenter
Ed Feo is a founder and managing partner of USRG Renewable Finance. USRGRF provides
long term financing to renewable energy projects. Previously, Ed was a partner in the
international law firm of Milbank, Tweed, Hadley & McCloy LLP and headed the Firm's
Power & Energy practice.
Mr. Feo was named in 2010 by the National Law Journal as one of “The Most Influential
Lawyers of the Decade” for his work on energy and environmental transactions. He has been
named in the California Lawyer magazine as an “Attorney of the Year” in the Energy
category and by The American Lawyer as a “Deal Maker of the Year.” He was named as one
of the Top 100 Lawyers in California by The Daily Journal in 2006, 2007, 2008 and 2009,
and was named one of the “Five Most Influential People in Renewable Energy” in 2008 by
Institutional Investor.
Mr. Feo is a well known speaker at renewable energy conferences, including at the American
Wind Energy Association annual conference, the European Wind Energy Association annual
conference, the National Renewable Energy Laboratory Growth Forum, Solar Power
Ed Feo International, the American Council on Renewable Energy annual conference, the Geothermal
213 446 3206 Resources Council, the World Renewable Energy Conference, the Renewable Energy Finance
ed@usrgrf.com Forum, and numerous other industry events. He is also a frequent writer on renewable energy
topics, including as a columnist for North American Clean Energy and as a contributor to
Reuter’s/PFI Clean Energy Finance. He is on the board of editors of The Journal of
Structured Finance.
Mr. Feo graduated with a B.A. and J.D. from UCLA, and was elected to Phi Beta Kappa, the
Board of Editors of the UCLA Law Review and Order of the Coif.
42You can also read