TAAC Meeting - MEETING WILL BEGIN SHORTLY - RTC Southern Nevada
←
→
Page content transcription
If your browser does not render page correctly, please read the page content below
MEETING WILL BEGIN SHORTLY

R E G I O N A L   T R A N S P O R T A T I O N   C O M M I S S I O N

                      TAAC Meeting
                                                    July 29, 2020

                                                                      1
Item #1

 CONDUCT A COMMENT
  PERIOD FOR CITIZENS
     PARTICIPATION

        Item #2

 ELECT A CHAIR AND VICE
CHAIR FOR THE UPCOMING
     2020-2021 TERM

                          2
Item #3

 APPROVAL OF THE
MINUTES: MEETING OF
   May 27, 2020

 CONSENT AGENDA

  ITEMS 4 AND 5

                      3
Item #6

     RECEIVE A PRESENTATION
   AND APPROVE THE SOUTHERN
  NEVADA COORDINATED PUBLIC
    TRANSIT-HUMAN SERVICES
      TRANSPORTATION PLAN

REGIONAL TRANSPORTATION COMMISSION

                       COORDINATED
      PUBLIC TRANSIT-HUMAN SERVICES
               TRANSPORTATION PLAN

                           July 2020

                                       4
PURPOSE

Improve mobility for seniors, people with
 disabilities, and low income individuals

                         OUTREACH

        Stakeholder        Interviews & Tours     Roundtables
     Committee Meetings

      Partner Meetings     Online Inventory     RTC Committee &
                                Survey           Public Meetings

                                                                   5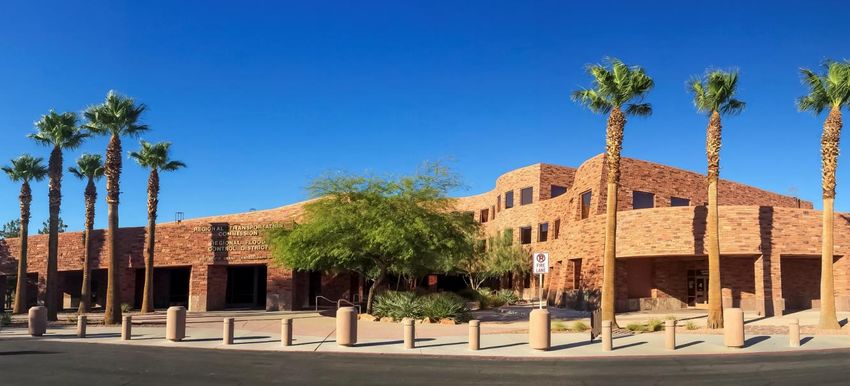
PROCESS

  TASK            TASK            TASK              TASK             TASK

   1               2               3                 4                5
Inventory &
                                  Goals &         Coordination   Plan Production
  Existing      Gap Analysis
                                 Strategies         Actions        & Approvals
 Conditions

                               FEEDBACK

              PUBLIC COMMENT                  STAKEHOLDERS &
                   PERIOD                       COMMITTEES

                                                                                   6
NEXT STEPS

✔ July 2020: RTC Committees

✔ August 2020: RTC Board

✔ Quarterly Committee Meetings

   RTCSNV.COM/CTP

                                 7
Item #7

  RECEIVE A PRESENTATION ON
THE SURVEY RESULTS TAKEN FROM
  REGIONAL TRANSPORTATION
  COMMISSION OF SOUTHERN
  NEVADA SILVER STAR RIDERS

               SILVERSTAR
                 SURVEY
                 RESULTS

                                8
Survey Respondents per Route

  What is your age group?

                               9
What is your employment status?

What is your household income?

                                  10
Including you, how many people live
in your household?
Do you use mobility aids?
11Other Modes of Transportation Utilized
Are you currently certified to use
RTC’s Paratransit Service?
12Are you satisfied with the days/hours
that the SilverSTAR service operates?
Are you satisfied with the travel time between the location
you most use SilverSTAR and your residence?
13Are the SilverSTAR operators polite and helpful?
Are the SilverSTAR stops serviced on time?
14Does the SilverSTAR bus have available
seating at the times you prefer to travel?
What time of day do you prefer to
ride SilverSTAR?
15Item #8
RECEIVE A PRESENTATION ON THE
REGIONAL TRANSPORTATION COMMISSION
OF SOUTHERN NEVADA’S PARTNERSHIP WITH
CAPABILITY HEALTH & HUMAN SERVICES
16R E G I O N A L T R A N S P O R T A T I O N C O M M I S S I O N
RTC Partnership
July 29, 2020
RTC | CAPABILITY HEALTH & HUMAN
SERVICES PARTNERSHIP
17RTC | CAPABILITY HEALTH & HUMAN
SERVICES PARTNERSHIP
18Item #9
RECEIVE A PRESENTATION
ON THE FINAL BUDGET FOR
FISCAL YEAR 2021
R E G I O N A L T R A N S P O R T A T I O N C O M M I S S I O N
BUDGET FISCAL YEAR 2021
July 29, 2020
19FY 2021 Funding Sources
Other Transit Funding Sales Tax $162.8
MILLIONS 2%FY 2021 Transit Operating Revenue
Other
MILLIONS 0.6%
Sales Tax $122.1
Passenger Fares
CARES Act 52.0
Medicaid 16.3%
Reimbursement 5307 Grant 22.0
2.2%
Fares 39.9
Sales Tax
50.0% Medicaid 5.5
5307 Grant
9.0% Advertising 1.6
CARES Act
21.2% Other 1.4
Total $244.5
Transit
Advertising
0.7%
FY 2021 Sales and Use Tax Distributions to
STREETS & HIGHWAYS & DOAQ
MILLIONS
DOAQ
16%
S&H $33.9
DOAQ 6.8
Total $40.7
Streets and
Highways
84%
21Motor Vehicle Fuel Tax
Covid-19
$ MILLIONS Projections
74.0 74.8 75.9 75.9
72.7
70.7
68.2
64.9 65.3 66.2
63.5
42.8
PROJECTED
BUDGETED
’12 ’13 ’14 ’15 ’16 ’17 ’18 ’19 ’20 ’21
Fuel Revenue Indexing - 1
Covid-19
$ MILLIONS
Projections
92.0 93.2 93.2
89.6
86.1
80.6
78.1
53.3 52.6
PROJECTED
BUDGETED
12.3
’14 ’15 ’16 ’17 ’18 ’19 ‘20 ’21
22Fuel Revenue Indexing - 2
$ MILLIONS
Covid-19
Projections
25.0
17.8
15.6 15.8
13.7
PROJECTED
BUDGETED
6.9
’18 ’19 ‘20 ‘21
General Market and Strip Corridor Fare Revenue
$ MILLIONS
Covid-19
General Market Strip Corridor
Projections
22.6 23.9 23 20.2
21.9 22.5 18.5 16.9
48.4
10.6 38.0
6.4
47.4 46.9 47 46.1 47.6 49.7 50.7
43.5 43.5 45.7
37.8
31.6
12 13 14 15 16 17 18 19 20 21
General Market Fares Strip Corridor Fares
23EXPENDITURES
FY 2021 Total Funding Uses
MILLIONS
Debt Service; Salaries & Benefits;
12.0% 5.8%
Capital Outlay $256.3
Contracted Services 218.3
Bond Payoff 140.6
Contracted
Bond Payoff; Services;
18.8%
Debt Service 90.2
29.2%
Salaries & Benefits 43.2
Total $748.6
Capital Outlay;
34.2%
24FY 2021 Capital Outlay
MILLIONS
Sales
Tax Transit $91.6
9%
FRI-2 100.0
Transit,
36% MVFT 40.0
FRI-2 Sales Tax 24.0
39%
Admin. 0.7
MVFT Total $256.3
Admin,FY2021 Budgeted Transit Operating Expenditures
Transfers Out, Salaries & Benefits,
MILLIONS
5.9% 8.0%
Contracted Services $197.6
Salaries & Benefits 19.0
TOTAL Transfers Out 11.9
$228.5 Total $228.5
Contracted
Services, 86.1%
Fixed Route Contract Cost
$ MILLIONS Covid-19
Projections
124.1
118.5
114.4 113.4
110.3
105.4 101.5
95.8
87.7 90.0
84.5 84.4
PROJECTED
BUDGETED
’12 ’13 ’14 ’15 ’16 ’17 ’18 ’19 ’20 ’21
26Paratransit Contract Cost
Covid-19
$ MILLIONS Projections
56.3
55.3
53.2
50.1
47.2
44.7
42.4 42.5 43.0
39.8 40.8
38.0
PROJECTED
BUDGETED
’12 ’13 ’14 ’15 ’16 ’17 ’18 ’19 ’20 ’21
FY2021 Structural Imbalance
Streets and Highways
In Millions
FY21 Estimated Revenues (Pre COVID-19) $405.0
Revenue Decline: COVID-19 Impact 60.4
FY21 Estimated Revenues (Post COVID-19) 344.6
Less: Expenditures (Pre COVID-19) 405.0
Structural Imbalance ($60.4)
27Structural Imbalance
A sustained
A structural structural
One-time
imbalance imbalance will
resources, such
occurs when eventually
as fund balance,
expected exhaust any one-
can be used in
revenues are less time resources,
the short-term to
than recurring requiring a
reduce the
expenditures significant
amount of the
needed to reduction in
structural
maintain current service delivery
imbalance.
service levels. to the
community.
FY2021 Budget Adjustment
In Millions
FY21 Structural Imbalance ($60.4)
Expenditure Reductions:
Contracted Services 2.8
Fund Balance Reductions:
S&H Funding 57.6
Balanced Budget ($0.0)
28FY2021 Structural Imbalance
Administration and Transit
In Millions
FY21 Estimated Revenues (Pre COVID-19) $422.0
Revenue Decline: COVID-19 Impact 152.0
FY21 Estimated Revenues (Post COVID-19) 270.0
Less: Expenditures (Pre COVID-19) 422.0
Structural Imbalance ($152.0)
FY2021 Budget Adjustment
In Millions
FY21 Structural Imbalance ($152.0)
Additional Resources:
CARES Act (non-recurring) 52.0
5307 Grant (short-term) 22.0
Expenditure Reductions:
Capital Outlay 40.7
Contracted Services 30.2
Fund Balance Reductions:
Transit Funding 1.3
Remaining Structural Imbalance ($5.8)
29FY2021 Budget Adjustment
Cost Containment Measures
In Millions
Remaining Structural Imbalance ($5.8)
Cost Containment Measures:
Hiring freeze, Layoff, Management pay cuts 3.6
Additional Cost Containment Measures 2.2
Balanced Budget ($0.0)
30Item #10
RECEIVE A PRESENTATION ON THE
TRANSIT RESOURCE AND INFORMATION
CAMPAIGN UNITING AND MOBILIZING
TO PREVENT HUMAN SEX TRAFFICKING
IN LAS VEGAS PROGRAM
31INNOVATIONS IN TANSIT PUBLIC SAFETY GRANT
PROJECT RESPONSIBILITIES
32HUMAN TRAFFICKING PREVENTION
PROJECT TIMELINE
Contractor UNLV Data
RTC Training
Training Analysis
Aug 20 – Sep 20
Aug 20 – Sep 20 Jul 20 – Jun 21
FirstMed Transit Paid Media
Services Advertising Advertising
Sep 20 – Jun 21 Oct 20 – Dec 20 Jan 21
33Item #11
RECEIVE A PRESENTATION ON
CHANGES TO THE VETERANS MEDICAL
TRANSPORTATION NETWORK
34R E G I O N A L T R A N S P O R T A T I O N C O M M I S S I O N
Veterans Medical Transportation
Network Service Update
July 29, 2020
Current VMTN Service
35What’s Changing?
Effective July 1, 2020
Paratransit-certified Some veterans may qualify
veterans receive rides, for to receive rides to
medical appointments at designated VA facilities on
no cost Ride On-Demand
36Item #12
RECEIVE A PRESENTATION AND
CONDUCT A PUBLIC HEARING
REGARDING PROPOSED FALL 2020
TRANSIT SERVICE CHANGES
R E G I O N A L T R A N S P O R T A T I O N C O M M I S S I O N
Transit Service Changes
Fall 2020
37Financial Situation
CURRENT TRANSIT BUDGET DEFICIT
FY2020 FY2021
-$6M
-$24M -$20M
-$63M
~$40M
Internal
Cuts
-$102M
PRE-COVID POST-COVID
38INTERNALLY ADDRESSING DECLINING REVENUES
• Eliminated and postponed capital projects
• Eliminated, suspended, and cut contracts
• Implemented a hiring freeze
• Cut management pay
• Negotiated collected bargaining agreement to cut staff pay
• Laid off or furloughed nearly 15% of our workforce
• Proposing significant reduction to our transit service
PROJECTED FUNDING DEFICIT
2020 2021 2022 2023 2024
5
Millions
-5
-15
-25
-$24.1
-35
-45
-55 -$50.3 -$52.6
-65 -$63.1 -$62.7
NOTE: Based on current projections, which could vary, assuming 3.5% average annual growth in sales tax.
39Service Change Overview
Proposed Proposed
Proposed
eliminations: adjustments:
frequency
Routes 207, Routes 104, decrease:
209, SDX & CX, Deuce,
Route 122
WAX HDX & SX
Community Engagement
60-day public
comment period
June 29 – August 28
40System-Wide Tactics
Elected official
Internal Community
briefings &
Communication Engagement
outreach
Public Relations Marketing
Additional efforts for impacted routes
Targeted Geo-
targeted Targeted
Community
Marketing
Engagement Advertising
41Specific Route Details
Route 104 – Valley View/Arville
Facebook
Ads
Postcards
and door
hangers
In-person at
transit
stations
42Route 122 – Maryland Pkwy/Horizon
Ridge
Facebook
Ads
Ride
daytime
Apartment, route
church &
community
center flyers
Route 207, Alta/Stewart
Discontinued
Residential Hispanic In-person at
Postcards & markets, fast Facebook
transit
business food & loan Ads
centers centers
flyers
43Route 209, Vegas/Owens
Discontinued
Residential Hispanic
Postcards & markets, fast Facebook In-person at
business food & loan Ads busiest stops
flyers centers
SX – Sahara Express
In-person at
Facebook
busiest
Ads
stops
Postcards & Apartments,
door churches &
hangers street teams
44WAX – Westcliff Airport Express &
CX – Centennial Express
Facebook
Ads
In-person at
transit
centers
HDX – Henderson Downtown Express
Apartment,
community Postcards &
center, library, door
church & hangers
business fliers
Ride
Facebook daytime
Ads route
45SDX – Strip & Downtown Express
Deuce on the Strip
LVCVA
Facebook media team
Ads & Culinary
Union
Stakeholder TVM
briefings Signage
Tactics for Paratransit
Additional
Targeted
Public
Marketing
Engagement
46Public Meetings
YouTube TAAC BTC In- BTC In-
Live Committee person person
Meeting
July 28 Aug. 5 Aug. 5
July 29
5-7 p.m. 7-9 a.m. 5-7 p.m.
1:30-3:30 p.m.
Timeline
Public
Service
Comment Board
Change
Period Approval
Fall, as early
June 29 – Sept. 10
as October
Aug. 28
47Item #13
CONDUCT A COMMENT
PERIOD FOR CITIZENS
PARTICIPATION
48MEETING HAS ENDED
49You can also read