BME populations in London: Statistical analysis of the latest UK census Neil Kaye - Social Policy Research Centre
←
→
Page content transcription
If your browser does not render page correctly, please read the page content below
BME populations in London:
Statistical analysis of the latest UK census
Neil Kaye
Social Policy Research Centre, Middlesex University
Access to data – 2011 UK Census
Availability of data (Census day – 27th March 2011; publication of main
statistics from late 2012; still being published – drip, drip, drip)
Timeliness of data (already out-of-date?)
Interpretation of data (published as statistical tables and spreadsheets; a
few charts, with some of the main topics allowing a degree of ‘interactivity’;
a limit to what can be tailored to specific needs – i.e. combining certain
variables)
Data visualisation (making sense of the tables; visualising the data for
increased ease of interpretation – can ‘see’ what the data is saying; plenty
of summary tables, charts and maps in this presentation)
Inclusivity of data analysis (our research includes visual outputs of data to
increase the level of inclusivity – greater access to the data, ability to
interpret the data and use the statistics for ones own ends, i.e. advocacy,
lobbying and appeal for resources)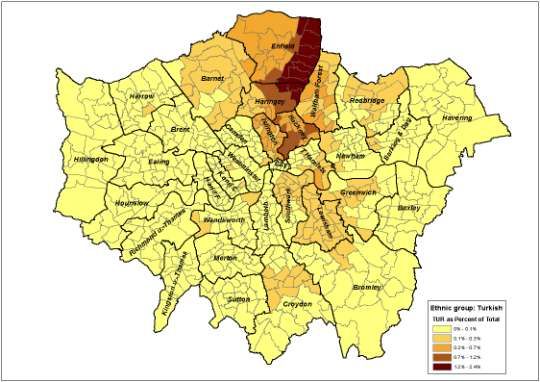
Size of the BME population
                                                       Total
                                                       population      BME           BME %
England                                                   53,012,456     10,733,220          20.2%
London                                                       8,173,941     4,504,657         55.1%
Inner London                                                 3,231,901     1,991,635         61.6%
Outer London                                                 4,942,040     2,513,022         50.8%

• The BME population in England is just over 1/5 of the total

• In London, at the last census the BME population outnumbered White:
British for the first time

•There are more than 4.5 million people in London who belong to a BME group

• In Inner London, the proportion of BME residents is three times the national
average
                BME         % BME
                                            • Within London there exists significant variation
Newham            256,468           83.3%
                                            from borough to borough in terms of BME
Brent             255,328           82.0%
Ealing            235,414           69.6%   population – notably both Newham and Brent have
Harrow            165,230           69.1%   greater than 80% non-White: British residents
Tower Hamlets     174,865           68.8%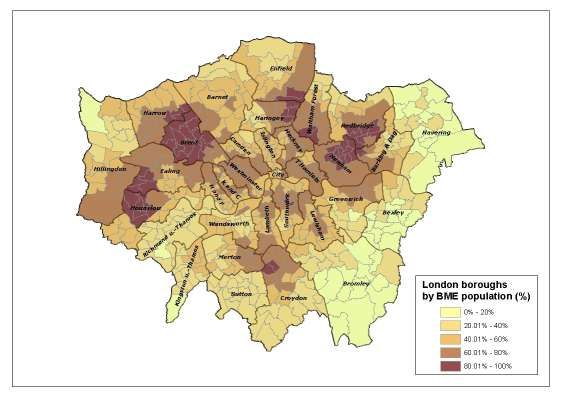
Trends in the BME population
        70.0%
                                                                                        61.6%
        60.0%

                        49.5%                                                      50.8%
        50.0%                           47.5%           46.6%           45.7%

        40.0%                      35.9%           36.7%           37.3%
                   34.4%                                                                        England
                                                                                                Outer London
        30.0%
                                                                                                Inner London
                                                                                20.2%
        20.0%                                   15.7%           16.8%
                13.0%           14.6%

        10.0%

         0.0%
                2001 Census        2004            2006            2008         2011 Census

• Since the 2001 Census the overall BME population has increased from around 1 in 7 to 1 in 5

• In London estimates put the BME population at between 1/3 (Outer London) and 1/2 (Inner London) of
the total population throughout the previous decade

• Prior to the most recent census, population estimates showed the proportion of BME groups living in Inner
London was falling, whilst there was a consistent upward trend in Outer boroughs

• The 2011 Census showed a significant rise in the proportion of BME population living in both Inner
and Outer London, such that White: British people form a minority of residents in both areas of the city
Locations of BME populations

• There is significant variation between boroughs in London in terms of the relative
size of the BME population living there

• Areas of particularly high concentration of BME groups exist in East London
(Newham, Redbridge), West London (Brent, Hounslow, Ealing) and Inner London
boroughs of Westminster, Southwark, Lambeth & Tower Hamlets
Which are the largest BME groups?
• London is one of the most
ethnically diverse cities in the
                                     # Ethnic group                         Population
world
                                     1 Black African                          573,931
                                     2 Indian or British Indian               546,016
• More than 40 non-indigenous
                                     3 Black Caribbean                        344,597
groups have a population of more     4 Pakistani or British Pakistani         224,569
than 15,000                          5 Bangladeshi or British Bangladeshi     222,545
                                     6 Other Western European                 181,603
• At the last census the Black       7 Irish                                  177,903
African population overtook the      8 Polish                                 136,598
Indian population as the largest     9 European Mixed                         134,044
BME group in the capital            10 Chinese                                126,349
                                    11 White and Black Caribbean              119,708
• It is projected that the ‘Other   12 Arab                                   110,207

Asian’ group will become the        18 Turkish                                 71,301

most sizeable overall BME           24 Afghan                                  44,505

category by the time of the next    39 Kurdish                                 20,988

census in 2021 – this group could
include a growing number of
Turkish, Kurdish and Afghan
migrants (as well as children of
current migrant communities)
Ethnic diversity in schools
% BME pupils (primary and secondary schools)
• Schools have seen a steady England London Inner London Outer London
increase in ethnic diversity 90.0%
throughout the last decade 80.0%
70.0%
• In London, more than two- 60.0%
thirds of pupils (67.2%) belong to 50.0%
a BME group, with this figure now 40.0%
above 80% in the Inner boroughs 30.0%
20.0%
10.0%
0.0%
2004 2005 2006 2007 2008 2009 2010 2011 2012
BME pupils % BME pupils
• In eight London boroughs the Newham 40,097 91.5%
BME school population is greater Tower Hamlets 29,407 88.6%
than 80% Brent 32,889 86.1%
Westminster 15,483 84.8%
Hackney 20,485 84.6%
• The proportion of BME pupils in Lambeth 22,850 84.0%
Newham is as high as 91.5% Harrow 22,191 81.5%
Ealing 32,423 81.1%Linguistic diversity in schools
% EAL pupils (primary and secondary schools) Pupils'
main % all
England London Inner London Outer London # Language language pupils
1 Urdu 103,730 1.57%
60.0% 2 Panjabi 88,225 1.34%
3 Bengali 64,230 0.97%
50.0% 4 Polish 47,135 0.71%
5 Gujarati 40,470 0.61%
40.0% 6 Somali 40,410 0.61%
7 Arabic 30,530 0.46%
8 Tamil 22,515 0.34%
30.0% 9 French 20,920 0.32%
10 Portuguese 20,830 0.32%
20.0% 11 Turkish 19,690 0.30%
12 Bengali (Sylheti) 17,995 0.27%
10.0% 13 Panjabi (Mirpuri) 16,000 0.24%
14 Yoruba 15,550 0.24%
15 Spanish 13,135 0.20%
0.0% 16 Albanian/Shqip 10,950 0.17%
2004 2005 2006 2007 2008 2009 2010 2011 2012 2013 17 Pashto/Pakhto 10,895 0.17%
18 Chinese 9,370 0.14%
19 Lithuanian 8,975 0.14%
• Increasing ethnic diversity in schools has also seen 20 Hindi
28 Persian/Farsi
8,315 0.13%
5,895 0.09%
an increase in linguistic diversity 32 Kurdish 5,035 0.08%
• More than half of all pupils in Inner London have
English as an Additional Language (EAL) • A total of 17 languages are spoken
as a main language by more than
•South Asian languages account for the majority of 10,000 pupils, including Turkish
those whose first language is ‘other than English’ (19,690) and Pashto/Pakhto (10,895)Linguistic diversity in London (1)
• The latest census has shown Speakers as main
language
% all EAL
population
# Language
Polish to be the largest minority 1 Polish 147,816 8.6%
linguistic group in London 2 Bengali 114,267 6.6%
3 Gujarati 101,676 5.9%
4 French 84,191 4.9%
• South Asian languages, such as 5 Urdu 78,667 4.6%
Bengali, Gujarati, Urdu and Tamil 6 Portuguese 71,525 4.1%
account for more than 25% of 7 Turkish 71,242 4.1%
EAL population 8 Spanish 71,192 4.1%
9 Arabic 70,602 4.1%
10 Tamil 70,565 4.1%
•Turkish- and Kurdish-speaking 11 Panjabi 68,525 4.0%
communities in London account 12 Somali 54,852 3.2%
13 Italian 49,484 2.9%
for 5% of the EAL population – 14 Romanian 39,653 2.3%
some 86,000 people 15 Persian/Farsi 39,645 2.3%
16 Lithuanian 35,341 2.0%
• The census counted more than 17 German 31,306 1.8%
18 Greek 26,924 1.6%
15,000 people in London 19 Russian 26,603 1.5%
speaking Pashto as a main 20 Tagalog/Filipino 25,869 1.5%
language 27 Kurdish 15,230 0.9%
28 Pashto 15,096 0.9%
• Persian/Farsi (the majority although included in the almost 40,000 speakers recorded
language of Afghanistan) is also a in the census will be communities from Iran, Tajikistan and
significant linguistic minority, other areas of Central and Western AsiaLinguistic diversity in London (2)
Main language other than English
Population over 3 Main language is Can speak Can speak Cannot speak Cannot speak
years English English very well English well English well English at all
England 51,005,610 92.0% 3.3% 3.0% 1.4% 0.3%
London 7,809,942 77.9% 9.8% 8.2% 3.5% 0.6%
Outer London 4,719,487 79.9% 8.5% 7.8% 3.2% 0.6%
Inner London 3,090,455 74.8% 11.7% 8.9% 3.9% 0.7%
Population over 3 years unable to speak English well or at all
• The census reveals that over (%)
22% of Londoners do not have 5.0% Cannot speak English at all Cannot speak English well
English as there main language 4.0%
3.0%
•18% of those with English as an 3.9%
additional language reported that 2.0% 3.2%
they can speak it ‘well’ or ‘very 1.0% 1.4%
well’ 0.6% 0.7%
0.0% 0.3%
England Outer London Inner London
• The remaining 4% are not
proficient in English – which • This shows a need for language-specific community
has an impact on access to services to negotiate the interaction between BME communities
services and civic participation and public authorities and service providers
•The census asks about self-assessed English-language
proficiency, so in fact the actual number of those lacking sufficient
English could be much higher than the 4% recordedSpatially concentrated communities (Turkish)
• The results from the
latest census confirm that
the Turkish community in
London continues to be
concentrated around the
boroughs of Enfield,
Hackney and Haringey
• Spatially concentrated
BME communities exist
across the capital
• Benefits/disadvantages of
this – in relation to
community services
organisations • The largest Turkish organisations are based in and operating in
these areas, e.g. DayMer (Hackney), Enfield Turkish Education
Association, Turkish Women’s Philanthropic Association
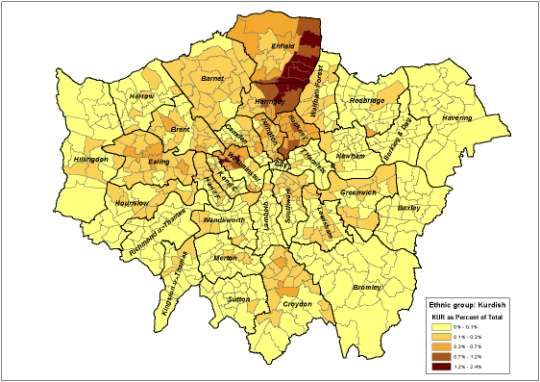
(Haringey)Spatially concentrated communities (Kurdish)
• Similarly the results
from the latest census
show that the Kurdish
community in London is
also concentrated around
the boroughs of Enfield,
Hackney and Haringey
• There also exists a
significant Kurdish
population in the west of
the capital – in parts of
Westminster,
Hammersmi-th and Ealing
• Kurdish community
Service (Haringey), Kurdish Association for Refugees
organisations are based in
(Hammersmith & Fulham) and Halkevi: Kurdish and Turkish
and around these areas,
Community Centre (Hackney)
e.g. DayMer (Hackney),
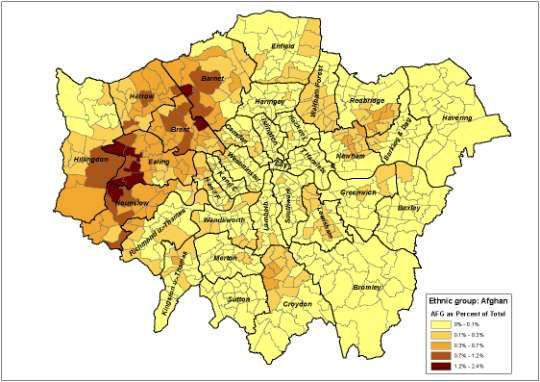
Kurdish AdviceSpatially concentrated communities (Afghan) • Similarly, the Afghan community, although more recently- established, is also concentrated in one area of the capital • Areas of the boroughs of Brent, Ealing, Harrow and Hillingdon in the west of London have the highest proportions of Afghan communities • The largest Afghan community organisations are based Association of London in Harrow and the Society of in and operate mainly in Afghan Residents in the UK in West Acton (Ealing) these areas, e.g. Paiwand and the Afghan
Socio-economic conditions –
 employment and ethnicity
                           Unemployment rate, by ethnic group (%)
        25.0%

        20.0%

        15.0%

        10.0%
                                                                           All BME Groups
         5.0%
                                                                           All Groups

         0.0%

• Unemployment disproportionately affects the BME population, with the current rate more
than 2% higher for these groups than the London average

• There are significant variations in the level of unemployment by ethnicity, with White groups
experiencing lower than average rates whilst Gypsy/Irish Traveller, ‘Other Black’, Bangladeshi
and Black African groups have a rate twice as high as average
Socio-economic conditions – employment,
ethnicity and gender
Employment rate gender gap, by ethnic group (pp)
35.0
30.0
Average gender…
25.0
20.0
15.0
10.0
5.0
0.0
-5.0
• Rates of employment differ greatly within ethnic groups according to gender with the
largest gender gap in employment being seen amongst Bangladeshis, Pakistanis and Arabs
• Other Asian groups also have a slightly higher than average gender gap in rates of
employment
• The Black Caribbean group is the only one where employment rates amongst women are
higher than amongst menSocio-economic conditions - pay
Median hourly earnings (£) of London residents in employment,
by ethnicity, 2012
18.00
16.48
16.00 15.18
14.00 13.45
12.00 11.55
10.00
10.00
White
7.67
8.00 BAME
6.00
4.00
2.00
0.00
Full time Part time All
• The ‘ethnic pay gap’ in London provides evidence of inequality in levels of income
and earnings according to ethnicity
• White groups earn, on average £4 per hour more than their BME counterparts
• The gap is greater amongst full-time employees than part-time workersSocio-economic conditions - benefits
Job Seekers' Allowance claimant rate by ethnicity (per 1,000
working-age population)
White "Ethnic minority"
60.0
55.0
50.0
45.0
40.0
35.0
30.0
25.0
20.0
• “Ethnic minority” (non-White) groups have a higher rate of JSA claimants than those
belonging to White groups
• Around 1 in 20 of the working-age “ethnic minority” population currently claim Job Seekers’
Allowance (JSA)
• The ‘gap’ currently stands at about 20 claimants per 1,000 working-age population
• This has increased throughout the current economic crisis from around 15 claimants per
1,000 at the start of 2010Socio-economic conditions - housing
Housing tenure by ethnic group (%)
Owned or shared ownership Social rented Private rented or living rent free
100%
90% 18.8% 22.1%
31.1% 33.0% 34.3%
80% 40.4%
46.1%
70% 21.3%
60% 17.4%
47.6% 26.9%
50% 35.2%
16.7% 29.2%
40%
30% 59.9%
51.5%
20% 37.2% 38.8%
31.8% 30.4% 30.3%
10%
0%
White: British Asian/Asian Other White Mixed ethnic Other ethnic Black/Black All BME
British group group British
• A higher proportion of White: British people (59.9%) live in owner-occupied or shared
ownership housing than for BME groups (38.8%)
• BME populations are more likely to live in social rented accommodation than the White:
British group
• There are large variations within different BME groups – almost half (47.6%) of
Black/Black British people live in social rented housing; over half (51.5%) of Asian/Asian
British people live in owner-occupied or shared ownership accommodationConclusion
BME groups tend to be disproportionately affected by adverse socio-
economic conditions. Minority groups experience:
◦ Higher unemployment
◦ Lower levels of pay
◦ Higher rates of JSA claimants
◦ More social housing
BME communities tend to be spatially concentrated in various parts of the
city
◦ Important for community-specific services
◦ Negotiate the interaction between BME communities and public authorities and service
providers
◦ Advocate and lobby on behalf of the community on individual- and community-level
◦ Allows access to services through contact with centrally-located organisations – although,
must be aware of ‘outlying’ community members who live some distance away from the
majority of the populationImpact on services
Language services
Schools and education services
Health services
Community services (spatially concentrated communities)
Welfare services, including benefits and housing
Employment-related services, including
◦ Assistance for job seekers
◦ Reducing inequalities in pay
◦ Tackling employment discriminationYou can also read