Possible Earthquake Impacts in Westlake and Pico Union - PPD 631 - Barry Waite
←
→
Page content transcription
If your browser does not render page correctly, please read the page content below
Possible Earthquake
Impacts in Westlake
and Pico Union
Desmian Alexander   4/24/19   PPD 631
Desmian Alexander                                                                            PPD 631
GIS Report                                                                                Intro to GIS
                 Possible Earthquake Impacts within Westlake and Pico Union

Introduction

         Earthquakes are a looming threat over the state of California and the Los Angeles region.

About 200 faults are considered hazardous within the state and more than 70% of California’s

population lives within 30 miles of a fault where a high-level earthquake could occur within 50

years (California Department of Conservation, 2019). Locally, the threat of a large earthquake on

the San Andreas Fault, dubbed “The Big One,” is ever present. The Great Southern California

ShakeOut Scenario estimates that a 7.8 magnitude quake on the San Andreas would cause about

1800 deaths and result in over $200 billion in economic losses (United States Geological Survey,

2008).

         Examining possible earthquake hazards across the entire city would have taken longer

than the timeframe allowed by this project, so my analysis instead focuses on the threats facing

the Westlake and Pico Union communities. Using data from the California Geological Survey,

the City and County of Los Angeles, as well as demographic data from Simply Analytics and the

Los Angeles Times, I was able to paint a picture of what structures and populations could

potentially be at risk in the event of a major earthquake. Although all risk could not be examined

due to data constraints, enough analysis has been completed to provide a way for the community

to make itself more resilient.

Issue Background

         The Los Angeles area is not unfamiliar with earthquakes. Hundreds of fault lines lie

within Southern California, the most famous of which being the San Andreas Fault. Seismic

resilience has been a big focus of the city, as it is a big part of the Resilient Los Angeles report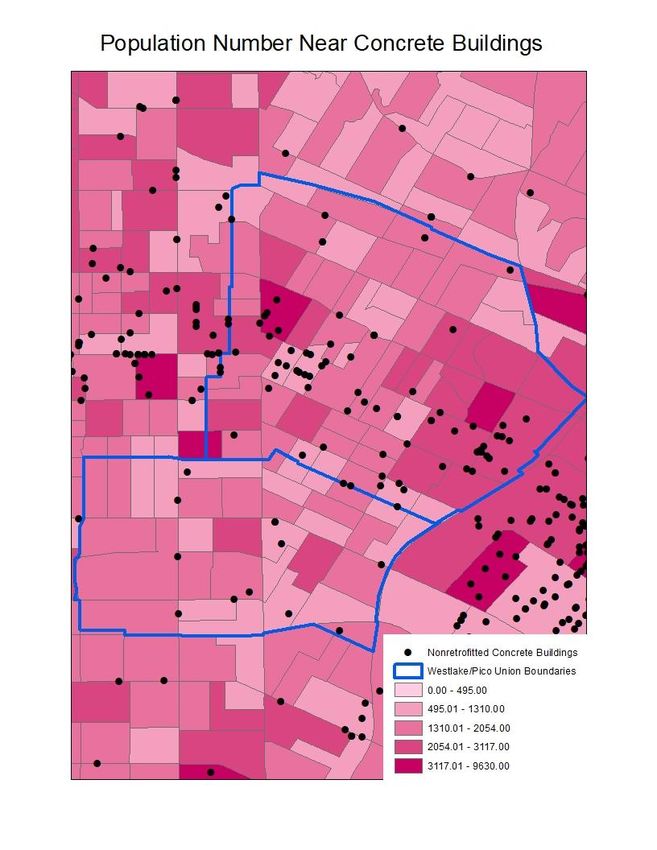
Desmian Alexander                                                                        PPD 631
GIS Report                                                                            Intro to GIS
released last year (City of Los Angeles, 2018). With that in mind, I wanted to examine

earthquake risk on a more localized level, namely in the community in which I live.

       Westlake and Pico Union are historic neighborhoods located in Central LA region, close

to Downtown Los Angeles. Both neighborhoods are home to historic sites and structures like

MacArthur Park, the Alvarado Terrace Historic District, and Temple-Beaudry (The Los Angeles

Times, 2019). These communities are also characterized by their higher level of density, their

high Latino populations, and their low incomes, with high percentages of households earning

less than $20,000/year (The Los Angeles Times, 2019). Given these demographics, many people

in these communities will be at risk if a major earthquake were to occur.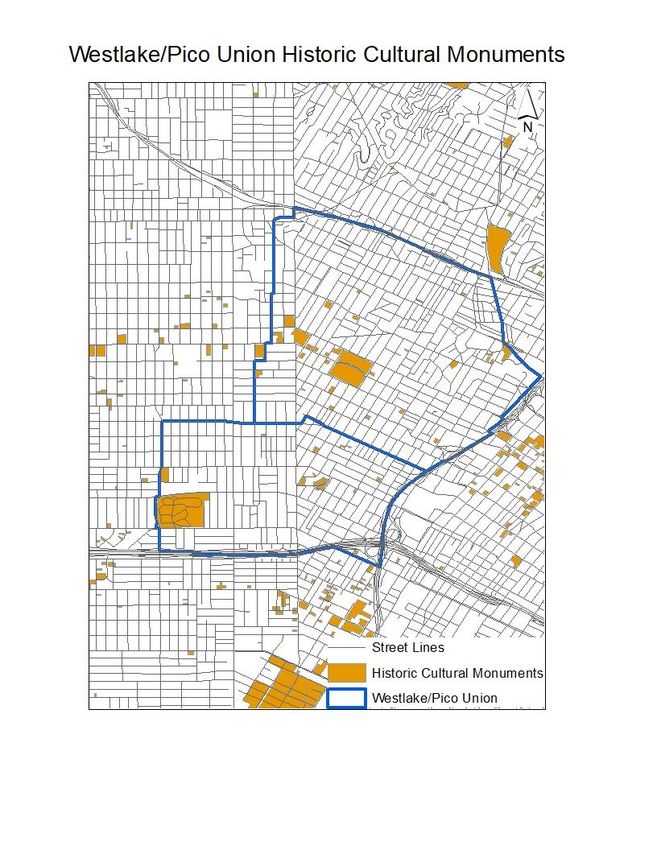
Desmian Alexander      PPD 631
GIS Report          Intro to GIS
Desmian Alexander      PPD 631
GIS Report          Intro to GIS
Desmian Alexander                                                                          PPD 631
GIS Report                                                                              Intro to GIS
Analysis

       When looking through my community, I decided to focus first on any threats posed to my

home. I live in Pico Union along the Historic Alvarado Terrace, which is home to several

residences and one church that were built at the turn of the 20th century. My home is within the

Westlake Community Plan area, but since it is also represented by the Pico Union Neighborhood

Council, I thought it best to represent both communities (Zimas, 2019). Through examining

Zimas, I learned that my home is not in any landslide or liquefaction zone, meaning that there

will probably not be any major changes in the solidity of the soil in the event of an earthquake.

Zimas Data of Home.

       My home lies within the Puente Hills Blind Thrust fault zone, discovered in the late

1990s (Field et al, 2005). It lies directly underneath Los Angeles is called a “blind” thrust

because it is covered by about 3 kilometers of sediment (Field et al, 2005). Due to the nature of

the fault, a moderate-level earthquake would cause as much damage as a large-scale earthquake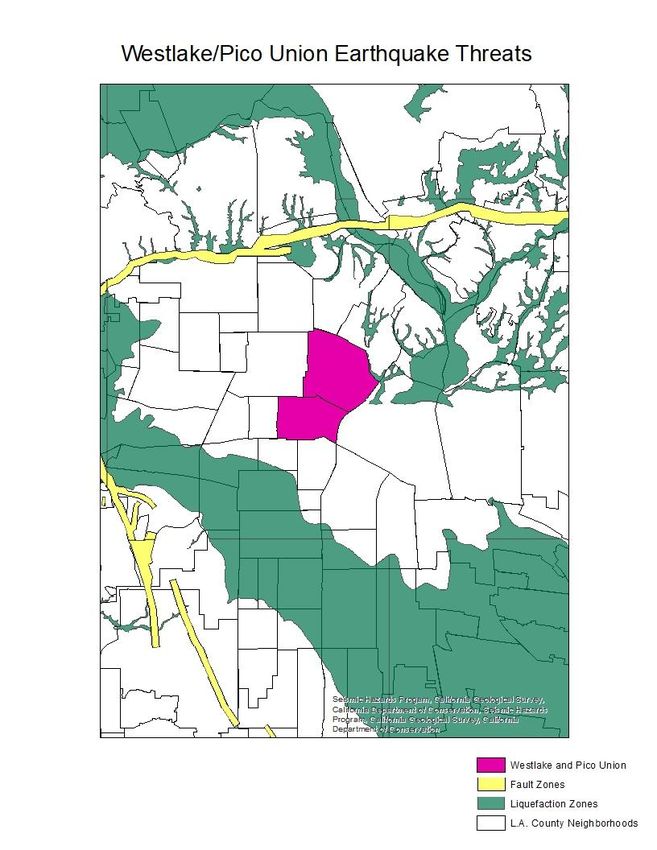
Desmian Alexander                                                                           PPD 631
GIS Report                                                                               Intro to GIS
on another fault (Field et al, 2005). If it were to fully rupture, the estimated losses would be as

follows:

           •   Economic Loss: Between $82 and $252 billion
           •   Fatalities: 3,000-18,000
           •   Displaced Households: 142,000-735,000
           •   Short-Term Public Shelter Needed: 42,000-211,000
           •   Tons of Debris Generated: 30,000-99,000 (Field et al, 2005)

Luckily, a full Puente Hills rupture is estimated to be very rare, happening once every 3,000

years (Field et al, 2003), making it highly unlikely that this type of event will occur during the

time I live in the community.

       Upon seeing that my home was not at risk for major earthquake effects, I then decided to

examine Westlake and Pico Union as a whole to see if there are any major known earthquake

hazard risks. After searching several sources, I came upon two maps from the California

Geological Survey which showed active fault zones and liquefaction areas within Los Angeles

County. To isolate Westlake and Pico Union, I used data collected by the Los Angeles Times on

the boundaries of Los Angeles neighborhoods. The results of the analysis showed that there are

no active fault zones or liquefaction zones that intersect Westlake or Pico Union.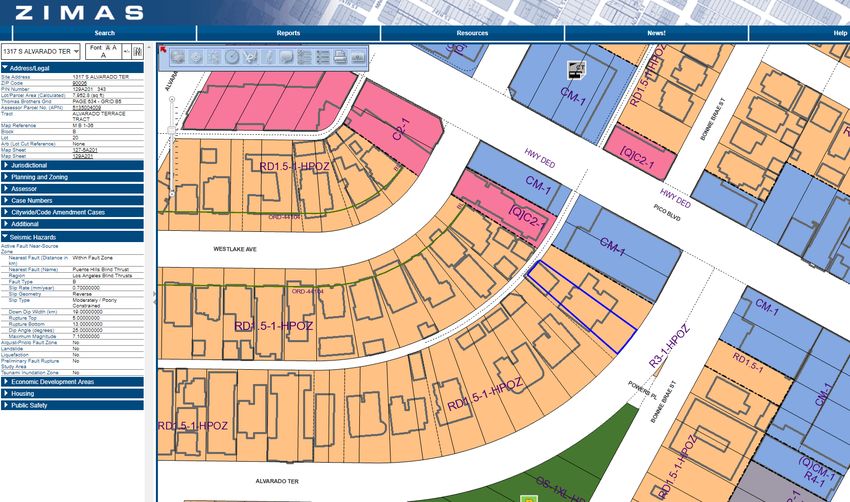
Desmian Alexander      PPD 631
GIS Report          Intro to GIS
Desmian Alexander                                                                           PPD 631
GIS Report                                                                               Intro to GIS

       While it was a relief to learn that certain hazards were not present within my community,

I still wanted to examine what other structures would be at risk for damage in the event of a

citywide earthquake. Considering I live within a historic home, I wanted to get some perspective

on the other historic structures in the community. Upon reaching out to a staff member with the

City of Los Angeles, I was able to obtain a shapefile of all historic structures within the city.

Layering this data with the LA County Neighborhoods dataset, an LA County Streets dataset

(LA County, 2015) enabled me to isolate the 50 historic structures were located in the

community (See Below). The majority of these buildings are labeled as historic residences and

churches, but it is unknown how many people occupy these spaces at any given time. Although

Westlake and Pico Union are home to many historic structures, areas outside of those boundaries

have more historic buildings and much more history at risk in the event of an earthquake.
Desmian Alexander PPD 631 GIS Report Intro to GIS
Desmian Alexander      PPD 631
GIS Report          Intro to GIS
Another subject I researched was what types of buildings were particularly susceptible to
collapse during an earthquake. Older concrete structures built pre-1976 were cited as particularly
vulnerable due to the fact that there is not enough steel in their supports to reinforce them in the
event of an earthquake (The Los Angeles Times, 2014). Since the foundation of my home is
concrete, I spoke with my landlord to see if any retrofitting of the building had been done to
secure the foundations of the home (Davis, 2019). He informed me that although the foundation
has not been upgraded, the level of masonry in the house required the foundation system to be
built with thicker concrete, meaning that the foundation will not move in the event of any type of
earthquake (Davis, 2019).
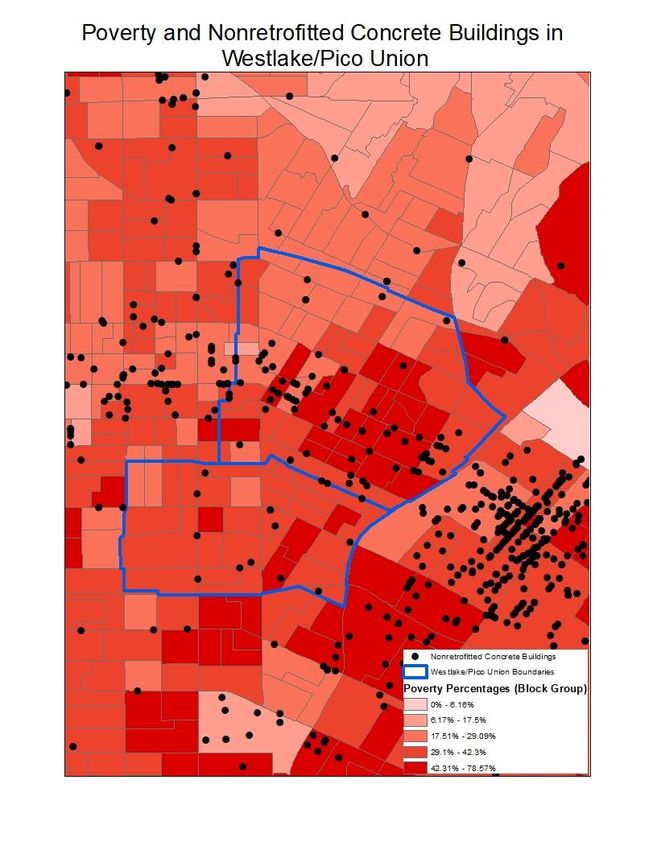
To get a better sense of the other concrete structures within the community, I used a
dataset from the Los Angeles Times which had a list of every non-retrofitted concrete structure
within the area. Since this file was a CSV, I geocoded the layer in order to have it display with
my LA County Neighborhoods layer. I then selected the polygons I wanted by location within
the Westlake/Pico Union boundaries, discovering that there were 93 non-retrofitted concrete
buildings within those boundaries. Examining the occupancy column, I deduced that 19 of those
structures were residential buildings, some going as high as 13 stories; 22 were office buildings;
and 6 of the buildings were schools. Although this data is from 2014 and some of these structures
may have been retrofitted since then, it was alarming to discover that so many of these buildings
would make many adults and children vulnerable if an earthquake were to occur.
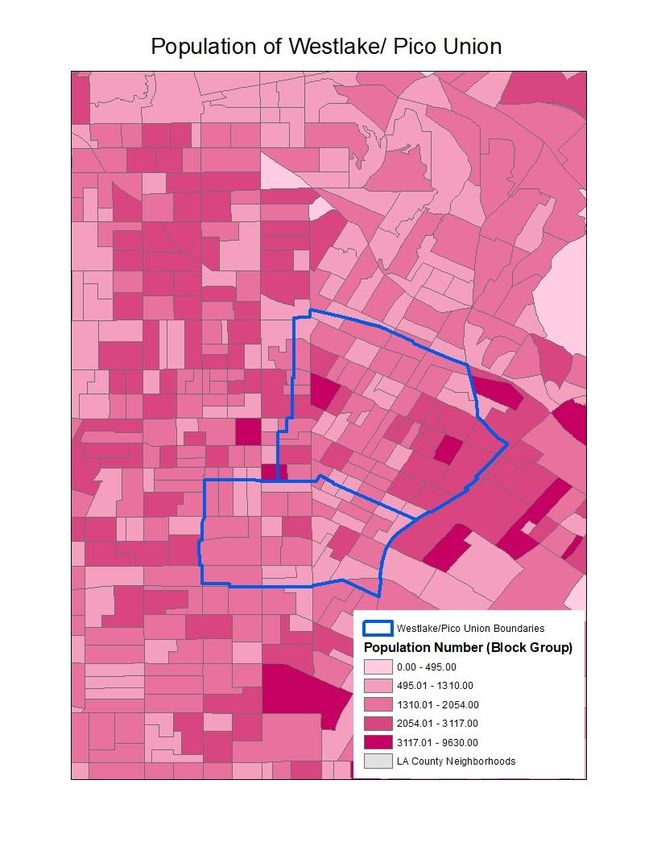
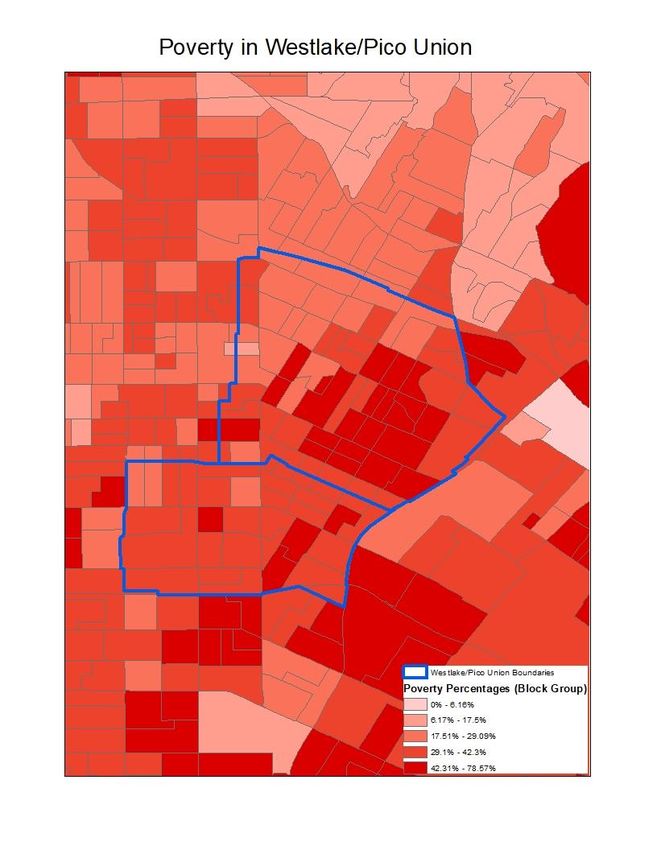
I also used population and poverty data from SimplyAnalytics to get a sense for both how
many people lived in the neighborhoods with these buildings, and the average incomes of those
who would be affected if they collapsed. Although there were 19 residential buildings selected,
most of them were not located in densely populated areas. Also, since many of the at-riskDesmian Alexander PPD 631 GIS Report Intro to GIS buildings were for majority daytime uses, the population at risk during an earthquake would vary depending upon the time of day. The poverty levels where these buildings were was relatively high but due to many of them being used for daytime purposes, it is difficult to determine how many poor people would be at risk of financial ruin if they were to be near one of these structures.
Desmian Alexander      PPD 631
GIS Report          Intro to GIS
Desmian Alexander      PPD 631
GIS Report          Intro to GIS
Desmian Alexander                                                                             PPD 631
GIS Report                                                                                 Intro to GIS
Conclusion

           My initial goal with this project was to get a sense of the earthquake risk of my home and

the greater community around it. This was initially inspired by my home’s history and the desire

to know what other historic structures would be at risk. My home does not face threats like

liquefaction, landslide, or being close to an active fault zone, but is still vulnerable to collapse in

the event of a very strong earthquake. I also learned that my home is one of 50 historic structures

within the community that is in danger of being seriously damaged in the event of an earthquake.

More frightening still, there are over 90 non-retrofitted concrete structures in my community that

could harm many people if an earthquake hit at the right time of day. While I am not able to

conclude definitively what would specifically happen to my home or the vulnerable structures

within my building, the research and subsequent analysis has allowed me to get a greater

perspective for the seismic vulnerability in my community. If provided more time for this

analysis, I would have liked to obtain more data that would have been better able to predict likely

effects.
Desmian Alexander PPD 631
GIS Report Intro to GIS
References and Datasets
California Department of Conservation. (n.d.). Frequently Asked Earthquake Questions.
Retrieved April 17, 2019, from
https://www.conservation.ca.gov/cgs/Pages/Earthquakes/earthquake-faq.aspx.
California Geological Survey. Earthquake Zones of Required Investigation. Retrieved April 8,
2019, from https://maps.conservation.ca.gov/cgs/EQZApp/app/.
Field, E. H., Eeri, M., Seligson, H. A., Gupta, N., Gupta, V., Jordan, T. H., & Campbell, K. W.
(2005). Loss Estimates for a Puente Hills Blind-Thrust Earthquake in Los Angeles,
California. https://doi.org/10.1193/1.1898332.
Los Angeles County GIS Data Portal. L.A. County Street & Address File. Retrieved on April 08,
2019 from http://egis3.lacounty.gov/dataportal/2014/06/16/2011-la-county-street-
centerline-street-address-file/.
Los Angeles Times. (2014). Older concrete buildings in Los Angeles - Los Angeles Times.
Retrieved April 8, 2019, from http://graphics.latimes.com/la-concrete-buildings/.
Los Angeles Times. (2015) L.A. County Neighborhoods (V6) - Mapping L.A. Boundaries API -
Data Desk - Los Angeles Times. Retrieved April 08, 2019, from
http://boundaries.latimes.com/set/la-county-neighborhoods-v6/.
SimplyAnalytics. Los Angeles # Population, 2018. Retrieved on April 13, 2019 from https://app-
simplyanalytics-com.libproxy2.usc.edu/index.html.
SimplyAnalytics. Los Angeles % Population in Poverty, Total, 2018. Retrieved on April 8, 2019
from https://app-simplyanalytics-com.libproxy2.usc.edu/index.html.You can also read


