Bankia Overview January 2014 1Q 2013 - April 2013
←
→
Page content transcription
If your browser does not render page correctly, please read the page content below
Bankia Overview

January 2014 1Q 2013

April 2013

Disclaimer
         This document has been prepared by Bankia, S.A. (“Bankia”) and is presented exclusively for information purposes. It is not a
         prospectus and does not constitute an offer or recommendation to invest.

         This document does not constitute a commitment to subscribe, or an offer to finance, or an offer to sell, or a solicitation of offers to
         buy securities of Bankia, all of which are subject to internal approval by Bankia.

         Bankia does not guarantee the accuracy or completeness of the information contained in this document. The information contained
         herein has been obtained from sources that Bankia considers reliable, but BANKIA does not represent or warrant that the
         information is complete or accurate, in particular with respect to data provided by third parties. This document may contain
         abridged or unaudited information and recipients are invited to consult the public documents and information submitted by Bankia
         to the financial market supervisory authorities. All opinions and estimates are given as of the date stated in the document and so
         may be subject to change. The value of any investment may fluctuate as a result of changes in the market. The information in this
         document is not intended to predict future results and no guarantee is given in that respect.

         Distribution of this document in other jurisdictions may be prohibited, and therefore recipients of this document or any persons who
         may eventually obtain a copy of it are responsible for being aware of and complying with said restrictions. By accepting this
         document you accept the foregoing restrictions and warnings.

         This document does not reveal all the risks or other material factors relating to investments in the securities/transactions of Bankia.
         Before entering into any transaction, potential investors must ensure that they fully understand the terms of the
         securities/transactions and the risks inherent in them. This document is not a prospectus for the securities described in it. Potential
         investors should only subscribe for securities of Bankia on the basis of the information published in the appropriate Bankia
         prospectus, not on the basis of the information contained in this document.

2 of 21/ January 2014
Bankia Highlights 2013…

                                        2013: Restructuring year for Bankia

            1           FEBRUARY – Agreement with Labour Unions (ERE)

            2           MARCH – IT Integration Completed

            3           APRIL – 1Q results: Normalization of Results

            4           MAY – Recap Process finalized. Capital increases completed at Bankia

             5          NOVEMBER – Finalization of the Network Restructuring

             6          DECEMBER – Bankia is included in the IBEX 35

3 of 21/ January 2014
Bankia Highlights 2013: Accomplishment of the Strategic Plan
Strategic Plan Targets 2012 - 2015
1 Recap & Balance Sheet strengthening 2012
2 Restructuring 2013
IN
3 Profitability & Commercial approach 2014 - 2015 PROCESS
4 of 21/ January 20141 Recap & Balance Sheet strengthening
Recapitalization completed
Solvency Asset Quality Liquidity
• €15.6bn of new Capital • Low exposure to RE assets: • Liquid assets cover ~76%
into the Group 3.4% of credit portfolio of total wholesale
• Free float represents 32% • High coverage of total maturities
of shareholders structure credit portfolios 8.5% and • Reduction of commercial
• Organic generation of 15.7% coverage of total gap by -55% after the
capital during 9M 2013 SMEs gross book recapitalization process
• 62.6% coverage of NPLs • LTD reduced to 116.7%
EBA Core Capital Gross Loans LTD Ratio
11.06% Coverage 136.3%
9.6%
Total NPLs 62.6% 120.4%
116.7%
5.0% LLR / Total
8.5%
Portfolio
Restructured
Loans 24%
2012 PF
4Q2012 post recap 3Q2013 4Q2011 4Q2012 3Q2013
5 of 21/ January 20142 Restructuring
100% of the branch restructuring already accomplished …
RETAIL BRANCH RESTRUCTURING CUMULATIVE CLOSURE SCHEDULE
~3,100 -38%
100%
~1,900 81%
58%
Dec 2012 Dec 2013 17%
1Q13 2Q13 3Q13 4Q13
Branch closures, accounting for 38% of the former network, finalized in November 2013, significantly
ahead of original schedule (2015)
Bankia remains a leading financial institution in traditional home territories, with market shares
around 15%.
6 of 21/ January 20142 Restructuring
… and workforce restructuring ahead of Strategic Plan…
REDUCTION OF WORKFORCE
Agreement with the trading
unions was signed during 1Q 2013.
EMPLOYEES LEAVING THE GROUP AS
6,000 6,000 employees will leave the
OF PLAN
group before 2015. Out of those,
1,500 employees will be part of
COMPLETED TO NOV 30 4,649
outsourcing processes or will leave
the Group due to the disposal of
% OF TARGET (1) 77% subsidiaries.
The divestment of City National
Bank as well as the outsourcing of
2,912 employees out of the 4,649 adhered to the RE servicing unit (pending of
workforce agreement (ERE) and 1,737 are leaving regulatory approval), will reduce
the group due to divestments and others the workforce in Bankia by almost
900 employees.
(1) Figures pro-forma including CNB and Plataforma divestments, currently subject to regulatory approval
7 of 21/ January 20142 Restructuring
… without material impact to the High Value Customer Base or Market Shares
Network and workforce restructuring Clients (Dec’12-Sep’13)
High
value
-38% 4%
-8.0% Medium
-22.6% value
15%
Low
value
# Clients 81%
# BRANCHES # EMPLOYEES
(Dec 13) (Nov 13) Corporates & SMEs Market Shares
Total Credit (OSR) Credit to SMEs and Corp.
(OSR)
9.23% 9.45%
5.55% 5.78%
Despite the reduction of branches and staff :
Loss of -8.0% of total clients but Dec 2012 Sep 2013 Dec 2012 Sep 2013
concentrated in the segment of "Low
Value” Deposits market share Mutual funds market share
Good performance of the market share in 9.08% 8.68%
strategic areas 4.83%
4.39%
Dec 2012 Sep 2013 Dec 2012 Sep 2013
Source: Bankia, ECB and Bank of Spain
8 of 21/ January 20143 Focus on Profitability & Commercial approach
Strategic Plan Targets
A Active COMMERCIAL strategy
B Reinforced NPL MANAGEMENT and ASSET QUALITY
C DISPOSAL of Non Strategic Assets
D Continued improvement of LIQUIDITY AND SOLVENCY
In order to achieve by 2015 COMPETITIVE ROEs AROUND 10%
9 of 21/ January 2014A Active Commercial Strategy
Focus on the improvement of interest margin
Based on customers relationship
Pricing Policies
Risk Adjusted pricing policies
Opportunities in mutual funds and bancassurance
Levers on Fees
Payment systems
Growth in existing clients scorings
Consumer Finance
Focus on “pre-approved” credits
New Commercial Specialization of the network and relationship managers
Model for SMEs Low penetration in this segment as of today
10 of 21/ January 2014A Active Commercial Strategy
Resulting in higher demand in our branches
INITIAL CHANGES IN OUR COMMERCIAL MODEL
Transactional Centres “Oficinas Ágiles” Recovery and Liquidation Centres (CLRs)
A total of 28 Recovery and Liquidation
Segmentation of the network and
Centres (CLRs) will be in place in the areas
opening of a new branch model, already
with lower presence (non-natural
started.
territories).
Intensive follow up and recovery activities of
Low value/ high frequency simple operations
NPLs
Sale of low complexity products (credit cards,
Redirectioning of high value clients to branches
term deposits, etc.)
Extended opening hours Liquidation activities
Allows for commercial focus in branches nearby
11 of 21/ January 2014A Active Commercial Strategy
Net interest and fee income – Bankia
Growth in Net Interest Income Positive fee performance
762 (1)
731(1)
18
633(1) 643
91 242
601(1)
237
53 225
89 226 225
3Q12 4Q12 1Q13 2Q13 3Q13 3Q12 4Q12 1Q13 2TQ3 3Q13
(1) Actual
numbers, adjusted for the finance cost associated with the subordinated loan from
BFA to Bankia, which was cancelled on 23 May.
Change in net interest income trend initiated in 1Q 2013 is confirmed
Reduction in customer deposits cost
Fees improvement vs. previous quarters
Bankia Group data. €m
12 of 21/ January 2014A Operating Expenses
Operating expenses – Bankia
Quarterly trend in operating expenses Operating expenses/ Gross income (ex tr. income)
-17.1%
63.3%
62.1% 62.1%
560 553 -4,9%
494 60.1%
488
464
54.2%
3Q 2012 4Q 2012 1Q 2013 2Q 2013 3Q 2013 3Q 2012 4Q 2012 1Q 2013 2Q 2013 3Q 2012
(1) Cost-to-income ratio excluding trading income and exchange differences
Reduction of expenses by 5% from the previous quarter
Bankia Group data. €m
13 of 21/ January 2014A 3Q 2013 results
Profit before tax - Bankia
Bankia Group data. €m 1Q 2013 2Q 2013 3Q 2013 Accum
Pre-provision profit 463 470 481 1,414 (1)
Recurring cost
Provisions (272) (585) (294) (1,151) of credit risk
accumulated
Profit from sales and other profit 0 296 21 317 at September
≈ 74 bps
Recurring profit from discontinued
0 32 (2) 21 (2) 53 (2)
operations
Profit before tax 191 213 229 633
Cumulative pre-tax profit is €633 million
(1) Includes €89 million in 1Q and €53 million in 2Q of net interest income due to impact of subordinated loan
(2) Includes recurring profit of Aseval
14 of 21/ January 2014B Reinforced NPL Management & Asset Quality
NPLs reduced in the 9M 2013 by €0.8bn
Evolution of NPLs and NPL coverage Reduction in NPLs (€bn)
19.8 NPLs Dec 2012 19.8
19.6
19.3
19.0
+ Gross additions + 3.0
NPLs (€bn)
- Recoveries - 3.4
Net additions - 0.4
Total assets 152.5 149.6 144.5 140.3
- Written off -0.4
NPL rate 13.0% 13.1% 13.4% 13.6%
NPLs Sept 2013 19.0
NPL
61.8% 61.9% 63.0% 62.6%
coverage
4Q 2012 1Q 2013 2Q 2013 3Q 2013
Reduction of NPLs continues, with a cumulative decrease during the year of €786 million
Bankia Group data. €bn
15 of 21/ January 2014B Reinforced NPL Management & Asset Quality
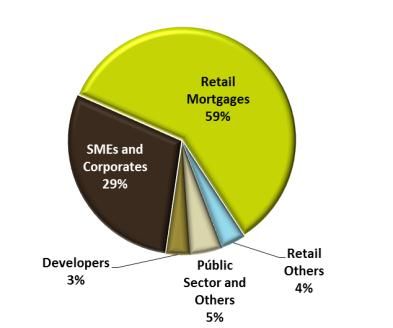
Credit quality
Gross loans and provision coverage ratios
Dec 2012 Sept 2013
Gross Provisions as Gross Provisions as
Portfolios amount % gross loans amount % gross loans
Developers 4.8 44.8% 4.5 52.5%
Corporates and SMEs 43.0 14.8% 39.1 15.7%
Retail 87.6 3.3% 83.5 3.4%
Total loan portfolio 145.8 8.0% 133.2 8.5%
Total excluding developers 141.0 6.7% 128.7 7.0%
Constant improvement of provision coverage ratios
The refinanced loans maintain a coverage rate of 24%
Bankia Group data. €bn
16 of 21/ January 2014C Disposal of Non Strategic assets
DIVESTMENT PLAN
CASH GENERATED FROM COMPLETED SALES OF CASH GENERATED FROM SALES OF INVESTEES
INVESTEES PENDING APPROVAL
1,133
ESTIMATED LIQUIDITY 779
715 Others
More than 70 sales and liquidations completed
by the end of 3Q 2013
To 30 June To 30 Sept
More than €1,900 million of cash generated from sale of investees
Amounts in € million
17 of 21/ January 2014D Continued improvement of liquidity and solvency
Self-sustainable model of capital and liquidity generation
Commercial gap LTD ratio
33.3 - 17.1% 120.4% - 3.7%
118.2% 116.7%
29.6
27.6
4Q 2012 2Q 2013 3Q 2013 4Q 2012 2Q 2013 3Q 2013
Bankia Group data. €bn
Continued reduction in the Commercial gap despite headwinds:
Acceleration of branch closures (already ~ 37% reduction in the network of dec. 2012)
Transfer of deposits to investment funds seeking higher returns
Change in policy on deposit interest rates
Commercial gap: Net loans – mediation loans – retail commercial paper – strict customer deposits
LTD ratio: (Net credit / (retail commercial paper + strict customer deposits + ICO/EIB deposits + single-certificate covered bonds)
18 of 21/ January 2014D Continued improvement of liquidity and solvency
Bankia re-entered the wholesale market in 2014
EUR1bn 5-year Senior Unsecured Debt Offering – Jan 2014
Regional breakdown
2% • Bankia’s first senior unsecured transaction since the
3%
5% formation of the Bankia Group
3% UK
Spain Strong international interest and allocation:
5%
France Order book closed at 3,5bn (3,5x oversubs.)
10% Italy +240 accounts
57% Switzerland
85% of the book outside Spain
15% Germany & Austria
The strength of demand allowed for a reduction of
Benelux
15bps In spread, ultimately pricing a €1bn
Others
transaction at MS+235 bps
Back to normalization in wholesale financing
19 of 21/ January 2014D Continued improvement of liquidity and solvency
Capital generated organically
Bankia Group – CORE TIER I EBA
11.06%
+ 17 bp
+ 20 bp
+ 37 bp
10.32%
9.62%
Gener. organically: Gener. organically: + 74 bp
+ 70 bp
↓RWAs ↑Prof. (1) SMEs
Dec 2012 PF JUN 2013 SEPT 2013
BIS II RATIO
9.84% 10.52% 11.27%
Bankia increases its Core Tier I EBA by 74 bp to more than 11%. Year to date Bankia has generated 144
bp of core capital
Note (1): Profit includes income attributable to the Group (161.5 million) during the quarter, plus other adjustments of Core Capital in an amount of 22 million.
20 of 21/ January 20142014: Focus on P&L
Strategic Plan Targets for 2014
Commercial focus to reinforce Gross Margin
Active management of NPLs and Asset Quality
Organic generation of Capital and Liquidity
In order to achieve by 2015 COMPETITIVE ROEs AROUND 10%
21 of 21/ January 2014You can also read