Rebuilding a Better Melbourne The rise of trackless road transport - Vicinity Centres
←
→
Page content transcription
If your browser does not render page correctly, please read the page content below
Vicinity Centres

  Rebuilding a Better Melbourne
The rise of trackless road transport
            Bernard Salt AM

              19 May 2021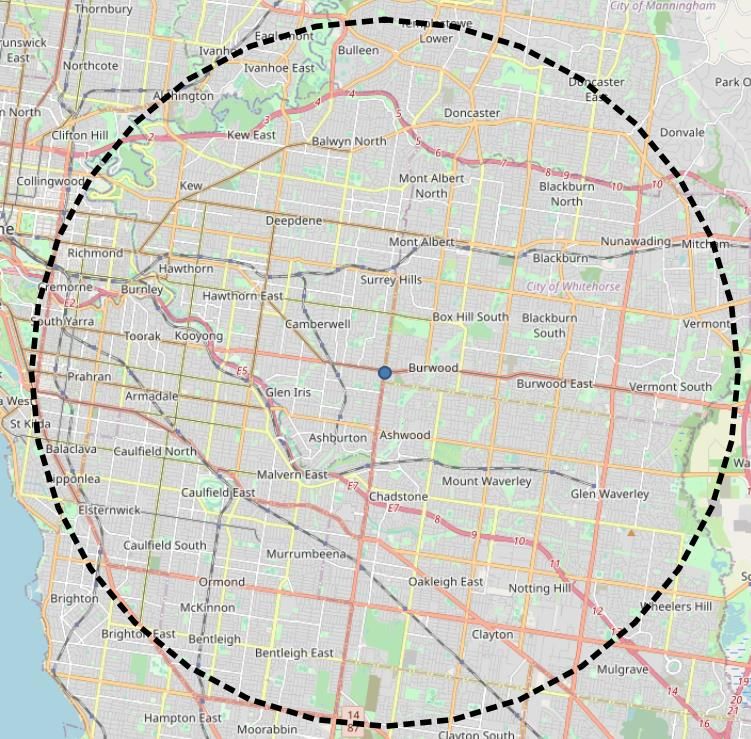
Australia spends wealth on housing, lifestyle & infrastructure

     1.           2.       3.         4.                            5.                       6.
United States   China    Japan     Germany                   United Kingdom                India
   20,933       14,723   5,049      3,803                         2,711                    2,709
    (-2%)       (+3%)     (-2%)      (-2%)                                 (-4%)           (-6%)

      7.           8.       9.        10.                              11.                  12.
   France        Italy   Canada   South Korea                         Russia               Brazil
    2,599       1,885     1,643      1,631                            1,474                1,492
    (-4%)       (-6%)     (-6%)      (-1%)                             (-13%)              (-24%)

   13.           14.      15.                                              Top 15 countries by GDP 2020
 Australia      Spain    Mexico                                              (in USD bn) & percentage
  1,359         1,278    1,076                                                   change 2019-2020
    (-2%)       (-8%)    (-15%)      Source: IMF; The Demographics Group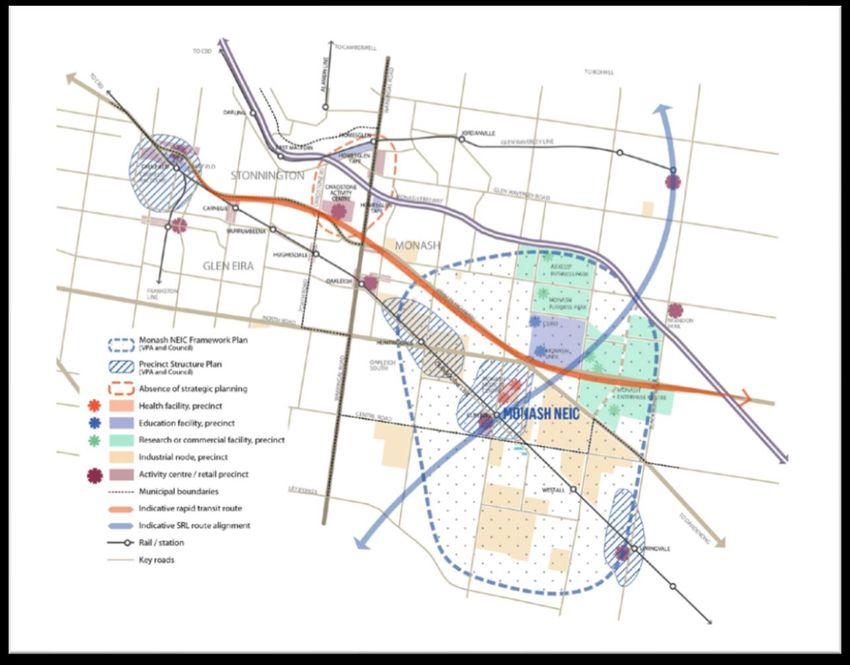
However the pandemic has halted Australia’s access to skilled labour

          1900              1920              1940            1960           1980                            2000                             2020
                                                                                                                          Big
350,000
                                                                                                                        Australia
                           ANZACs                                                                                                              Covid-19
                                                                                                                         peak
300,000                     return                                                                                                             pandemic

250,000
                                                     US
200,000                                            soldiers
                                                  returning
150,000          ANZACs                             home
                  depart               Great
100,000                              Depression
 50,000

      -

 -50,000

-100,000

-150,000
           1901
           1903
           1905
           1907
           1909
           1911
           1913
           1915
           1917
           1919
           1921
           1923
           1925
           1927
           1929
           1931
           1933
           1935
           1937
           1939
           1941
           1943
           1945
           1947
           1949
           1951
           1953
           1955
           1957
           1959
           1961
           1963
           1965
           1967
           1969
           1971
           1973
           1975
           1977
           1979
           1981
           1983
           1985
           1987
           1989
           1991
           1993
           1995
           1997
           1999
           2001
           2003
           2005
           2007
           2009
           2011
           2013
           2015
           2017
           2019
           2021
           2023
            Historical net overseas migration in Australia from 1901 to 2019 and budget forecasts to 2024
                                                                            Source: ABS 3105, 3101 and 3222; Australian Federal Budget 2021; The Demographics Group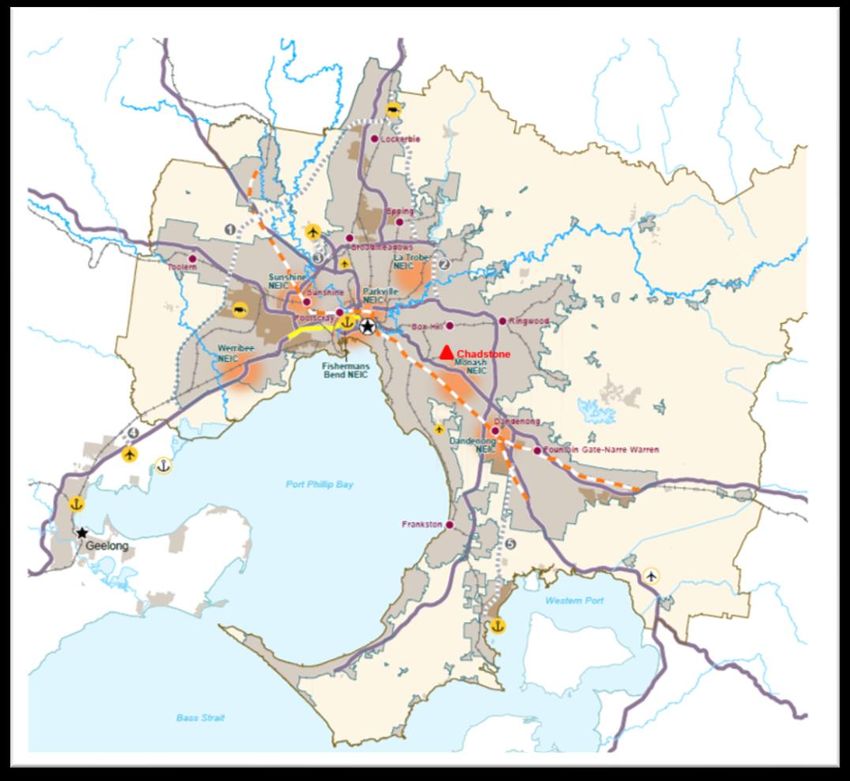
And Australia depends highly on access to foreign skills and labour
            Melbourne                69%                           Sydney               72%                                  Australia                              74%

  Workforce Growth 2011-                              Workforce Growth 2011-                              Workforce Growth 2011-
           2016                                                2016                                                2016
1.      Australia                 58,000            1.     Australia                 58,400            1.        Australia                                   160,000
2.      India                     34,000            2.     China                     30,900            2.        India                                       100,000
3.      China                     22,000            3.     India                     27,600            3.        China                                          72,000
4.      Philippines                7,000            4.     Nepal                     11,900            4.        Philippines                                    37,000
5.      New Zealand                7,000            5.     Philippines                 8,000           5.        Nepal                                          22,000
6.      Sri Lanka *                7,000            6.     South Korea                 7,500           6.        South Korea                                    19,000
7.      Vietnam                    6,000            7.     Thailand *                  6,100           7.        New Zealand                                    18,000
8.      Pakistan                   6,000            8.     Vietnam                     5,700           8.        Vietnam                                        17,000
9.      Malaysia *                 5,000            9.     Pakistan                    5,600           9.        Pakistan                                       16,000
10.     Iran *                     3,000            10.    Bangladesh *                4,300           10. South Africa                                         14,000
Total Melbourne                 187,000             Total Sydney                    209,400           Total Australia                                        626,000
* denotes country not in national top 10… % is proportion labour comprised by overseas-born workers   Source: Based on Australian Bureau of Statistics data; The Demographics Group
Megatrends drive demand for knowledge workers and for tech skills
Feb 2000 – Feb 2021
Agriculture/
250 Jobs grown: +1,023,000 Forestry
200
Jobs contracted: -49,000 & Fishing
Net jobs added: 974,000
150
100 Manufacturing
('000)
50
0
-50
-100 Prof./ Education Transport/ Financial & Electricity/ Rental/ Info Media & Other
Scientific/ & Training Postal/ Insurance Gas/Water Hiring & Telecoms Services
Tech. Warehouse & Waste Real Estate
Healthcare Construction Retail Trade Accom. & Arts & Wholesale Mining
& Social Public Food Recreation Admin & Trade
Assistance Admin Support Greater
& Safety Melbourne
up 1.0m
(1.6m to 2.6m)
Jobs added/lost by industry in Greater Melbourne between February 2000 and February 2021
Source: Based on Australian Bureau
Source: Basedof
onStatistics data;
Australian Bureau The Demographics
of Statistics Group
data; The Demographics GroupMelbourne 2050 plan shows a Monash skills, research & business hub
Source: Plan Melbourne 2017-2050Source:
Department of Environment, Land, Water & Planning
Based on Australian Bureau of Statistics data; The Demographics GroupHolmesglen-Chadstone is positioned near the heart of AU suburbia
10 km Residents Jobs
Darryl Kerrigan
Coolaroo
Skyhooks
1,067,000 517,000
Edna Everage
Overseas Australian
Burwood Neighbours
Visitors Visitors
20,000 25,000
Holmesglen
Chadstone
Kath &
Hipster cafe Kim
Monash Fountain
Foreign Hotel
Lakes Students Rooms
39,000 2,779
Source: © OpenStreetMap
contributors; Base map and data
from OpenStreetMap and Key metrics driving Melbourne suburbia (10km radius from Burwood) based
OpenStreetMap Foundation; other
visuals by The Demographics Group on ABS 2016 Census and tourism accommodation (2016) data-8.0
-6.0
-4.0
-2.0
0.0
2.0
4.0
6.0
% change
Dec-1970
Oct-1971
Aug-1972
Jun-1973
Apr-1974
Feb-1975
Dec-1975
Oct-1976
1970s
Aug-1977
Jun-1978
Whitlam
Apr-1979
Feb-1980
Dec-1980
Oct-1981
Aug-1982
Jun-1983
Apr-1984
Feb-1985
Dec-1985
Oct-1986
Fraser
Aug-1987
Jun-1988
1980s
Apr-1989
Feb-1990
Dec-1990
Oct-1991
Aug-1992
Jun-1993
Hawke
Apr-1994
Feb-1995
Dec-1995
Oct-1996
Aug-1997
Jun-1998
1990s
Apr-1999
Feb-2000
Dec-2000
Oct-2001
Aug-2002
GST
Jun-2003
Apr-2004
Feb-2005
Dec-2005
Oct-2006
Aug-2007
Jun-2008
GFC
2000s
Apr-2009
Feb-2010
Dec-2010
Oct-2011
Aug-2012
Jun-2013
Apr-2014
Feb-2015
Dec-2015
The long boom has created a culture of lifestyle expectation
Oct-2016
Aug-2017
Jun-2018
-7%
COVID-19
2010s
Apr-2019
June 2020
Feb-2020
Per cent change in Australia’s gross domestic product quarter-to-quarter growth rate (constant prices) from 1970 to 2020
Dec-2020
Dec
2020
Source: ABS, Australian National Accounts (Cat. 5206, released Mar 2021), The Demographics Group
+3.1%The pandemic has triggered a work from home movement…
Before Lockdown Next
Source: Visualised by The Demographics Group… and the rise of the 20-minute city
Pre-Corona Fried Egg City Post-Corona 20-minute City
Home
“Suburbia” Work
Work CBD
Home “Inner-City Home
CBD Yolk”
Suburban
Hub
Home
Transport links
to provincial
cities
Source: The Demographics GroupThe Holmesglen-Chadstone & Monash training, business & activity hub
Source: HolmesglenSource:
Chadstone Structure
Based on Australian Plan
Bureau Positioning
of Statistics data; The Paper Dec20
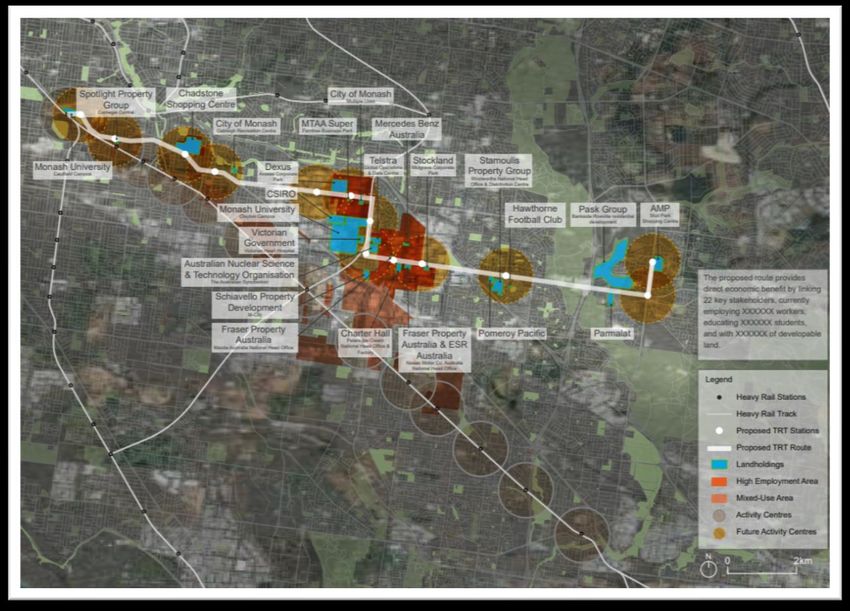
Demographics GroupTRT connects the components of the training, business & activity hub
Source:
Source: Based on Australian Bureau Landholders
of Statistics TRT Map
data; The Demographics GroupKey points in rebuilding a better Melbourne
1 2 3
Melbourne is a prosperous The pandemic has The suburban sprawl to
city that has developed in a triggered the rise of work Melbourne's east resulted in key
lop-sided manner leaving from home and has institutions and businesses falling
large swathes of Middle resulted in closed borders between the radial railway lines...
Australia without convenient at a time when the solution is to invest in and
local access to training, infrastructure spending is build skills capacity by connecting
skills and business surging... the pathway Holmesglen with Chadstone and
opportunity... and especially forward requires greater Monash, between the lines, by
in the Monash precinct skills development in threading a TRT line between
which is planned to places like Monash and Caulfield and Rowville via
eventually connect into the Holmesglen Monash and Holmesglen-
OML Chadstone
Source: The Demographics Groupwww.tdgp.com.au
© 2021 NumberStory Pty Ltd, trading as The Demographics Group (“TDG”). All rights reserved.

The use of any TDG name or logo or Bernard Salt’s name or image are prohibited without TDG’s prior written consent.

The information contained in this document and in this presentation (Information) is of a general nature and is not intended to address the objectives, financial situation or needs
of any particular individual or entity. It is provided for information purposes only and does not constitute, nor should it be regarded in any manner whatsoever, as advice and is not
intended to influence a person in making a decision, including, if applicable, in relation to any investment decision or financial product or an interest in a financial product. The
Information is not to be relied upon for any particular purpose. Those relying on the Information assume all risk and liability arising from such reliance. Appropriate professional
advice should be sought from a suitable person with full knowledge and consideration of the specific circumstances of each individual or entity.

This presentation may contain forecasts or projections. Forecasts and projections are inherently uncertain and TDG and Bernard Salt make no guarantee, assurances or
representations as to the accuracy, reliability or certainty of such forecasts. TDG its associated entities and Bernard Salt shall not be liable for any loss or damage suffered by
persons, including third parties, who may use or rely on these forecasts or projections.

Although we endeavour to provide accurate and timely Information, TDG makes no warranties, express or implied, regarding the accuracy, correctness, completeness, timeliness
or reliability of the Information as of today, or in the future. TDG is under no obligation in any circumstance to update this presentation, in either oral or written form, for events
occurring after the presentation. No reliance should be placed on additional oral remarks provided during the presentation.

To the extent permissible by law, TDG, its associated entities and Bernard Salt shall not be liable for any errors, omissions, defects or misrepresentations in the Information or for
any loss or damage suffered by persons, including third parties, who may use or rely on such Information (including (without limitation) for reasons of negligence, negligent
misstatement or otherwise).

TDG have indicated within this presentation the sources of the information provided. TDG has not sought to independently verify those sources unless otherwise noted within the
presentation.

The views and opinions expressed within this presentation are those of the presenters, and do not necessarily reflect the official position of TDG, or any other organisation.

These slides are not for commercial use or redistribution. TDG owns the Information and any associated intellectual property. The Information is subject to copyright and is
provided solely for the benefit of the presentation attendees. It must not to be copied, quoted or referred to in whole or in part without TDG’s prior written consent.
You can also read