Battery metals EV supply chain: key factors bottlenecking ramp-up over the next five years - Vault
←
→
Page content transcription
If your browser does not render page correctly, please read the page content below

Battery metals
EV supply chain: key factors bottlenecking ramp-up over the next five years
14 September 2022

Disclaimer
FORWARD LOOKING STATEMENTS
The information in this presentation may contain forward-looking statements within the meaning of the “safe harbour” provisions of the United States Private Securities Litigation Reform Act of 1995.
These forward-looking statements, including, among others, those relating to Sibanye-Stillwater Limited’s (“Sibanye-Stillwater and, together with its subsidiaries, the “Group”) and senior management
and directors of Sibanye-Stillwater and/or SFA Oxford financial positions, business strategies, plans and objectives of management for future operations, are necessarily estimates reflecting the best
judgment of the senior management and directors of Sibanye-Stillwater.
All statements other than statements of historical facts included in this presentation may be forward-looking statements. Forward-looking statements also often use words such as “will”, “forecast”,
“potential”, “estimate”, “expect” and words of similar meaning. By their nature, forward-looking statements involve risk and uncertainty because they relate to future events and circumstances and
should be considered in light of various important factors, including those set forth in this disclaimer. Readers are cautioned not to place undue reliance on such statements.
The important factors that could cause the Group’s actual results, performance or achievements to differ materially from those in the forward-looking statements include, among others, our future
business prospects; financial positions; debt position and our ability to reduce debt leverage; business, political and social conditions in the United States, South Africa, Zimbabwe and elsewhere;
plans and objectives of management for future operations; our ability to obtain the benefits of any streaming arrangements or pipeline financing; our ability to service our bond instruments; changes
in assumptions underlying Sibanye-Stillwater’s estimation of their current mineral reserves and resources; the ability to achieve anticipated efficiencies and other cost savings in connection with past,
ongoing and future acquisitions, as well as at existing operations; our ability to achieve steady state production at the Blitz project; the success of Sibanye-Stillwater’s business strategy; exploration
and development activities; the ability of Sibanye-Stillwater to comply with requirements that they operate in a sustainable manner; changes in the market price of gold, PGMs and/or uranium; the
occurrence of hazards associated with underground and surface gold, PGMs and uranium mining; the occurrence of labour disruptions and industrial action; the availability, terms and deployment
of capital or credit; changes in relevant government regulations, particularly environmental, tax, health and safety regulations and new legislation affecting water, mining, mineral rights and business
ownership, including any interpretations thereof which may be subject to dispute; the outcome and consequence of any potential or pending litigation or regulatory proceedings or other
environmental, health and safety issues; power disruptions, constraints and cost increases; supply chain shortages and increases in the price of production inputs; fluctuations in exchange rates,
currency devaluations, inflation and other macro-economic monetary policies; the occurrence of temporary stoppages of mines for safety incidents and unplanned maintenance; the ability to hire
and retain senior management or sufficient technically skilled employees, as well as their ability to achieve sufficient representation of historically disadvantaged South Africans in management
positions;         failure      of        information        technology           and        communications             systems;       the        adequacy           of       insurance          coverage;
any social unrest, sickness or natural or man-made disaster at informal settlements in the vicinity of some of Sibanye-Stillwater’s operations; and the impact of HIV, tuberculosis
and the spread of other contagious diseases, such as coronavirus (“COVID-19”). Further details of potential risks and uncertainties affecting Sibanye-Stillwater are described in Sibanye-Stillwater’s
filings with the Johannesburg Stock Exchange and the United States Securities and Exchange Commission, including the Integrated Annual Report and the Annual Report on Form 20-F.
Certain statements and metrics included in this presentation, including those relating to market forecast, outlook and pricing, have been prepared by the management of SFA Oxford and may differ
from the views and expectations of Sibanye-Stillwater’s management.
These forward-looking statements speak only as of the date of the content. Sibanye-Stillwater and SFA Oxford each expressly disclaim any obligation or undertaking to update or revise any forward-
looking statement (except to the extent legally required).
NON-IFRS MEASURES
The information contained in this presentation may contain certain non-IFRS measures, including adjusted EBITDA, AISC and AIC. These measures may not be comparable to similarly-titled measures
used by other companies and are not measures of Sibanye-Stillwater’s financial performance under IFRS. These measures should not be considered in isolation or as a substitute for measures of
performance prepared in accordance with IFRS. Sibanye-Stillwater is not providing a reconciliation of the forecast non-IFRS financial information presented in this report because it is unable to
provide this reconciliation without unreasonable effort.
WEBSITES
References in this presentation to information on websites (and/or social media sites) are included as an aid to their location and such information is not incorporated in, and does not form part of,
this presentation.
                                                                                                                                                                                                         1
Introductions
James Wellsted, Head of Investor relations & Corporate affairs
Programme

    SFA(Oxford) introduction                     – Henk de Hoop

    Battery basics                               – Lakshya Gupta

    Power train and EV battery trends            – Lakshya Gupta

    Lithium                                      – Lakshya Gupta

    Sibanye-Stillwater
    – Unique, global portfolio of green metals   – James Wellsted

    Q&A

                                                                    3
SFA(Oxford) - Consulting analysts in
tomorrow’s commodities and technologies
Henk de Hoop, CEO

5
         SFA’s client network
         Long-term relationships with significant players across the mine to market supply chain

Confidential: SFA (Oxford)
Battery basics
                             Lakshya Gupta, SFA (Oxford)

Confidential: SFA (Oxford)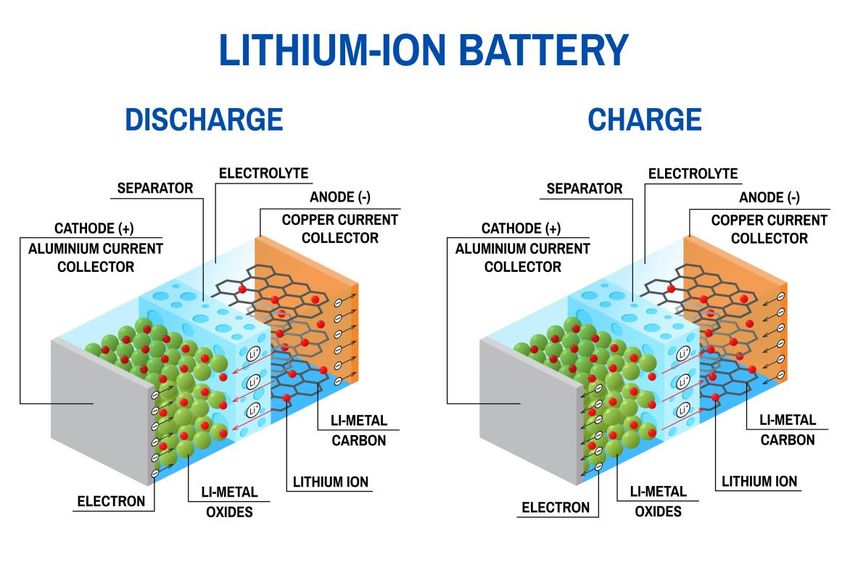
7

                             Disclaimer, copyright & intellectual property

                             SFA (Oxford) Limited has made all reasonable efforts to ensure that the sources of the information provided in this
                             document are reliable, and the data reproduced are accurate at the time of writing. The analysis and opinions set out in the
                             document constitute a judgment as of the date of the document and are subject to change without notice. Therefore, SFA
                             cannot warrant the accuracy and completeness of the data, and analysis, contained in this document. SFA cannot be held
                             responsible for any inadvertent occasional error, or lack of accuracy or correctness. SFA accepts no liability for any direct,
                             special, indirect, or consequential losses or damages, or any other losses or damages of whatsoever kind, resulting from
                             whatever cause through the use of, or reliance on, any information contained in the report. The material contained herein
                             has no regard to the specific investment objectives, financial situation or particular need of any specific recipient or
                             organisation. It is not to be construed as a solicitation, or an offer to buy or sell any commodities, securities or related
                             financial instruments. The recipient acknowledges that SFA is not authorised by the Financial Conduct Authority to give
                             investment advice. The report is not to be construed as advice to the recipient or any other person as to the merits of
                             entering into any particular investment. In taking any decision as to whether or not to make investments, the recipient
                             and/or any other person must have regard to all sources of information available to him. This report is being supplied to the
                             recipient only, on the basis that the recipient is reasonably believed to be such a person as is described in Article 19
                             (Investment professionals) or Article 49 (High net worth companies, unincorporated associations etc.) of the Financial
                             Services and Markets Act 2000 (Financial Promotion) Order 2005.

                             © Copyright reserved. All copyright and other intellectual property rights in any and all reports produced from time to time
                             remain the property of SFA, and no person other than SFA shall be entitled to register any intellectual property rights in any
                             report, or claim any such right in the reports, or the information, or data on the basis of which such reports are produced.
                             No part of any report may be reproduced or distributed in any manner without the written permission of SFA. SFA
                             specifically prohibits the redistribution of this document, via the internet or otherwise, to non-professional or private
                             investors, and accepts no liability whatsoever for the actions of third parties in reliance on this report.

Confidential: SFA (Oxford)
8
         Battery 101
         Lithium-ion has become the industry standard

         •   Lithium-ion batteries have the highest potential performance   •   Performance is determined by composition of cell components.
             relative to other commercial rechargeable batteries.           •   Ions move through the separator during normal operation, between the
         •   Required in BEVs to have acceptable performance, based on          two electrodes of the cell.
             consumer expectations from ICE cars.

Confidential: SFA (Oxford)                                                                                                  Source: SFA (Oxford)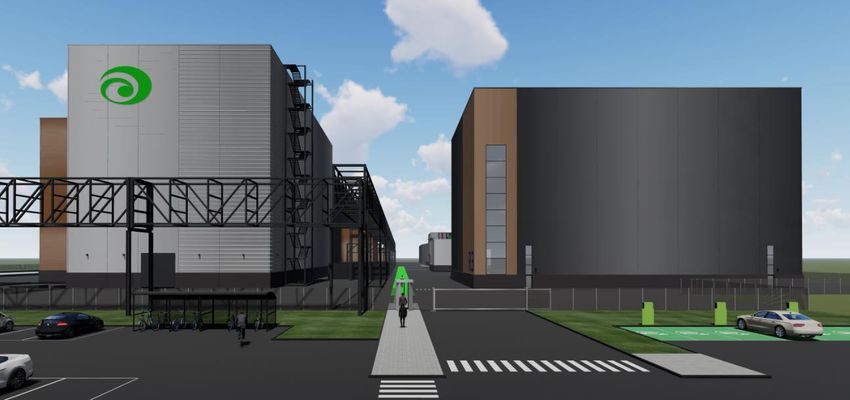
9
         EV battery chemistries
         Cathode metals make up bulk of battery bill of materials

                                                  2021
                Battery pack                    commodity                  Contained value in one tonne of cells
                component          Commodity      price       NMC111   NMC532     NMC622        NMC811          NCA                                       LFP

                Casing             Steel          $849/t       $127     $127               $127                 $127                 $127                 $127

                Current selector   Aluminium     $2,476/t      $124     $124               $124                 $124                 $124                 $124

                                   Copper        $9,318/t      $652     $652               $652                 $652                 $652                 $652

                Anode              Graphite      $2,472/t      $447     $447               $447                 $447                 $447                 $447

                Cathode            Lithium       $14,162/t     $326     $326               $326                 $326                 $326                 $198

                                   Nickel        $18,459/t    $1,200   $1,791             $2,141               $2,843               $2,880                   -

                                   Cobalt        $51,393/t    $3,341   $2,004             $2,004                $976                $1,490                   -

                                   Manganese     $3,934/t      $240     $216               $142                  $71                    -                    -

                                   Aluminum      $2,476/t       -         -                   -                    -                  $10                    -

                                   Iron           $259/t        -         -                   -                    -                    -                 $29

                                                Total value   $6,457   $5,687             $5,963               $5,566               $6,056              $1,577

                                                                                                                                    Source: SFA (Oxford), Bloomberg.
Confidential: SFA (Oxford)                                                     Note: 2021 average prices are used to avoid distortions from steep price rises in 2022.
Powertrain and EV battery trends
Lakshya Gupta, SFA (Oxford)
Confidential: SFA (Oxford)11
BEV light-vehicle production revisions
BEV outlook more than doubled globally within two years
Global BEV production forecasts 2026 BEV forecast revisions by region
million units m units
20 20.0
18 Q1'22 2026 production forecast up
Q4'21 120% in two years (+10m units)
19.5
16 Q3'21 19.3
Q2'21
14 Q1'21
19.0
Q4'20
12 Q3'20
18.6
Q2'20
10 18.5
Q1'20
8
18.0
6
4
17.5
2
0 17.0
2015 2016 2017 2018 2019 2020 2021 2022 2023 2024 2025 2026 Q1'22 North Western China RoW Q2'22
forecast America Europe forecast
• BEV production appear to be weathering the global component supply disruptions better than ICE vehicle production.
• Most recent upgrades driven by North America, as multiple OEMs commit to upgrading production footprint in the region. This has since been further
accelerated by the passing of the Inflation Reduction Act.
Confidential: SFA (Oxford) Source: SFA (Oxford), GlobalData12
Global BEV sales: H1’22
Strong consumer demand for EVs globally
Light-duty vehicle sales: H1'22 BEV sales excl. China: H1'22
Year-on-year change, % Total BEV '000 units
USA
Global-15 -10%
77%
China -2% Germany
100%
USA -18% UK
62%
Germany France
UK
South Korea
France BEV sales
Sweden m units
South Korea
Netherlands
Sweden
Netherlands Canada
Global 3.1
Canada Italy
Italy Belgium
Belgium
Japan
China 1.9
Japan
Spain
Spain
Australia
Australia 0 1 2 3 4
Poland Poland
-40% -20% 0% 20% 40% 60% 80% 100% 120% 0 50 100 150 200 250 300 350 400
• BEV sales in China doubled in H1’22, capturing 61% of global sales over the period.
• Almost all of the top 15 EV markets registered positive year-on-year growth in BEV sales, despite declining overall vehicle sales.
Confidential: SFA (Oxford) Source: SFA (Oxford), EV-Volumes13
Commodity price impact
Are EV sales inelastic to raw material prices?
Global BEV sales Cathode active material bill of materials
'000 units Indexed, Jan 2021 = 100
800 250
2022 CAM
price
700
200 So far in 2022, EV sales have appeared inelastic to battery metal prices. This
600 could be due to a number of factors:
• Strong demand pull
500 • OEMs not passing on rising production costs
2022 BEV 150
sales 2021 CAM • Boost in EV demand as a result pent-up savings post Covid
price (rhs)
400
• OEMs prioritising EV production during chip shortages
100 Reality is likely a combination of these but weighted towards the first two
300 2021
BEV points as…
sales
… the latter two do not justify EVs outperforming the rest of the automotive
200 sector.
50
100
0 0
Jan Feb Mar Apr May Jun
Confidential: SFA (Oxford) Source: SFA (Oxford), Bloomberg, EV-VolumesLithium – The ubiquitous battery metal
Lakshya Gupta, SFA (Oxford)
Confidential: SFA (Oxford)15
Market summary
Prices may have peaked; set to stabilise at historically high levels
Lithium supply-demand balance
LCE kt
$/t
88 65,500
100
47 54
36
8 10 10 16
60,000
0
-68 -8
-100 -59 50,000
Current balance
-195 -139
Incl. probable projects
-200 -178
37,000 40,000
Incl. low risk possible
-300 Li₂CO₃ price (rhs)
-308 30,000
-401
-400
18,645 26,000
20,000
-500
-615 10,000
-600
6,383
-700 0
2020 2021 2022 2023 2024 2025 2026
• Prices may have peaked, but they remain at extremely high levels for both lithium carbonate (Li2CO3) and lithium hydroxide (LiOH).
• The lithium market is forecast to move to mounting deficits from next year onwards, but supply from ‘probable’ and ‘low-risk possible’ projects could
potentially keep the market balanced through to 2025.
• Prices are likely to reach a floor in 2024, before starting to rise to incentivise higher-risk projects.
Confidential: SFA (Oxford) Source: SFA (Oxford), Bloomberg.16
Production costs
Very healthy margins in 2022; high royalties for Chilean operations
Operating costs excl. royalties: 2022 Operating costs incl. royalties: 2022
US$/t LCE US$/t LCE
Quartile 1 Quartile 2 Quartile 3 Quartile 4 Quartile 1 Quartile 2 Quartile 3 Quartile 4
10,000 30,000
Hard rock 2022F Li2CO3 price: $65,500/t Hard rock 2022F Li2CO3 price: $65,500/t
Brine Brine
25,000
8,000
20,000 Royalties up to 36%
6,000
15,000
4,000
10,000
2,000
5,000
Chile Chile Australia Australia Australia Chile
0 0
Production (LCE tonnes) Production (LCE tonnes)
Argentina Argentina
Confidential: SFA (Oxford) Source: SFA (Oxford)17
Lithium supply vs. demand
Supply stagnates as BEV demand proliferates
Lithium supply Lithium demand
LCE kt LCE kt
Probable
projects 512 2021 465
Low-risk
possible
projects 654 2022 647
Medium-risk
possible
projects 750 2023 818 +24.8% p.a.
804 2024 999
813 2025 1,214
1,707 1,231 1,101 794 +282 kt 2026 +944 kt BEVs = 73% of growth 1,409
Australia Chile Argentina Japan USA W. Europe China
+159 kt +98 kt +24 kt +59 kt +104 kt +216 kt +351 kt
Greenbushes +69 kt Carmen +62 kt Olaroz +21 kt +40 kt BEVs +83 kt BEVs +179 kt BEVs +276 kt BEVs
Wodgina +56 kt La Negra +37 kt +19 kt MHEVs +31 kt PHEVs
Pilgangoora +29 kt +21 kt HDEVs
Mt. Marion +26 kt
Mt. Cattlin -20 kt
Source: SFA (Oxford). Note: Regional demand figures exclude non-automotive
Confidential: SFA (Oxford) battery demand. Chart figures may not sum owing to independent rounding.18
Battery recycling
Rapidly growing but does not displace requirements from new mines
Cathode metal value contained in scrapped BEVs (global)
US$ bn, 2021 avg. commodity prices
6
5.4
5
Lithium
3.9
4
Nickel
3 2.6
Cobalt
1.7
2
1.1
1 0.67
0.39
0.11 0.21
0.02 0.05
0
2020 2021 2022 2023 2024 2025 2026 2027 2028 2029 2030
Scrapped LiBs by source - Europe
GWh EoL EVs
120 Gigafactory scrap
100
80
60
40
20
0
2021 2022 2023 2024 2025 2026 2027 2028 2029 2030
Confidential: SFA (Oxford) Source: SFA (Oxford), Bloomberg19
The fallout
Project execution risks could jeopardise 15 million BEVs (48%) in 2030
Lithium demand vs. supply in 2030 incl. projects
LCE kt
2% 6%
16%
High risk 20%
2,000 possible 6% 16%
Potential supply Higher 20% Potential supply
Higher risk supply by project type risk by deposit type
≈15.4 million 49% 2030 supply 2030
Medium risk 51%
BEVs
possible 58%
Projects
32 million BEVs in 2030
1,500 98% 58%
BEVs
Low risk possible Expansions & restarts Brine (continental) Hard rock (spodumene)
Lower risk supply
≈11.2 million Projects Higher risk Hard rock (other) Brine (geothermal)
BEVs
Probable
1,000
Recycling
35%
45% Potential supply Lower Potential supply
by project type risk by deposit type
2030 55% supply 2030
500
Hybrids Mainly fulfils
Existing 65%
hybrids and
mines
other demand
Other
0
Demand Supply
Source: SFA (Oxford).
Note: Other hard rock deposits include lepidolite,
Confidential: SFA (Oxford) petalite, zinnwaldite, and various clay minerals.20
Conclusion
EV trends
• BEV sales continue to surprise to the upside, despite significant macro and logistical headwinds
• Important to appreciate regional differences in fleet penetration
• OEMs keep upgrading EV production targets, committing large sums of capital to transition to EVs
• Governments continue to influence consumers through a carrot and stick approach
Lithium markets
• Incoming structural impediments could slow growth rates from mid-decade
• Significant execution risk perceived in lithium project pipeline
• Total potential impact of roughly 15m BEVs by 2030
• This could provide a longer tail to cleaner ICE cars, and hence PGM demand, in the 2nd half of the decade
Confidential: SFA (Oxford)Sibanye-Stillwater – Unique, global portfolio of green metals James Wellsted
Sibanye-Stillwater – diverse commodity portfolio across five continents

Listings
JSE Limited share ticker: SSW
NYSE ADR ticker: SBSW

Market cap
R153bn / US$10bn1
Precious metal output in 2021

3.6Moz 6E PGMs
and 1.07Moz gold

   A diverse portfolio of mining and processing operations and projects and investments across five continents
Source: Company information                                                                                      22
Notes: 1. Rounded up as per close on 29 April 2022
Considered, deliberate progress on battery metals strategy
• Geographical and commodity diversification creates a more robust and sustainable business
2021 – New Century
(tailings retreatment)
2021 – Rhyolite-Ridge Project (Li)
2021 – Sandouville (Ni) 3 28 27 25
2021 – Keliber (LiOH) Li
Lithium
Ni Co Mn
Nickel Cobalt Manganese
2 years 2019 – SFA (Oxford)
92 29
planning Green metals 4 Recycling U
Uranium
Cu
Copper
Tailings
retreatment
Growth
PGM 46 78 45
Recycling Pd Pt Rh
2 years 2017 Palladium Platinum Rhodium
Stillwater
planning 3 2019
US PGMs Lonmin
46 78 45 77 44
SA PGMs 2
2016
Aquarius
2016
Rustenburg
Pd
Palladium
Pt
Platinum
Rh
Rhodium
Ir
Iridium
Ru
Ruthenium
Tailings
retreatment
SA
gold 2013 2018 2020
2013 DRDGOLD
Cooke DRDGOLD 92 79
1
Wits Gold
U
Uranium
Au Gold
Tailings
retreatment
Time
Our value creation benefits all stakeholders in multiple jurisdictions
Source: Company information
23Securing our value position in unique Keliber lithium project
Keliber is an advanced Lithium Hydroxide project in Finland
• Aiming to be the 1st fully integrated European lithium producer with direct
access to the European BEV market
• Investment to date and estimated funding
- Investment to date of €176m for our 50%+1 shareholding in Keliber
- Maximum amount to buy out minorities to increase shareholding from 50%+1 ~>80% is
estimated at €196m - to be completed by Oct 2022
- Finnish Minerals Group considering to retain ~20%
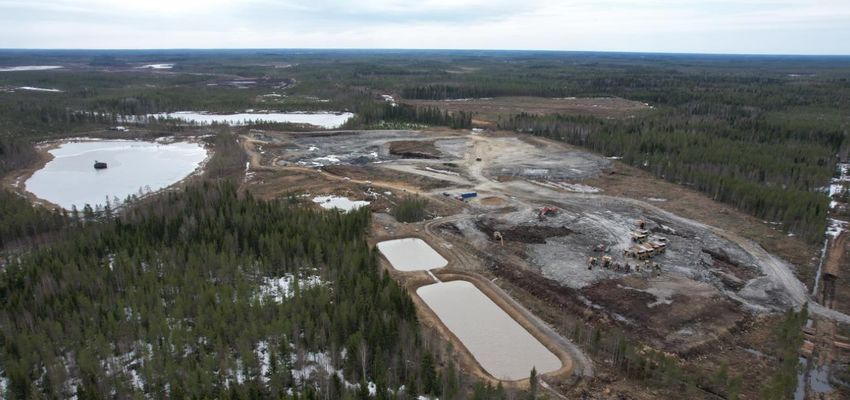
Syvajarvi mining area
- Sibanye-Stillwater to underwrite a further €104m equity raise
- Post these investments Keliber would have raised €250m in equity and will then
raise minimum of €250m of debt to ensure the project is fully funded
• Definitive feasibility study (DFS) and 31% increase in ore reserves confirms
quality and value
• Continued improvement in lithium market outlook
• Permit approvals progressing well with the Kokkola Processing plant
environmental permit granted
Planned Kokkola lithium chemical plant
Enhancing our green metals footprint in Europe
24Positioning for value – supplying critical metals into key regional ecosystems
SANDOUVILLE (Nickel refinery in France)
Acquired 100% on 4 Feb 2022 for €85m. Ramping up nickel products & cobalt
production
Prime location- Europe’s industrial heart - Le Havre, France’s 2nd largest industrial port
Planned scoping studies for Nickel sulphate, PGM autocat recycling and battery metals
recycling facilities subject to feasibility studies
RHYOLITE RIDGE (strategic lithium project in the US)
Post granting of permits and conditions precedent - will acquire a 50% interest in project –
7.1% share in ioneer acquired in Oct 2021 for US$70m
Boric acid credits position project as first quartile cost producer
Offtakes secured – Ford (5-year from 2025 - 35% of production) & South Korean battery
maker Eco
Unique global portfolio of green metals
25Strategically well placed for future scenarios
✓ Positive fundamental outlook for battery metals – strong demand pull & supply challenges 3. STRATEGIC DIFFERENTIATORS
✓ PGM business well placed for extended ICE cycle and developing hydrogen economy
Recognised as a force for good
✓ Green metals portfolio positioned for supply of critical metals into chosen regional supply
chains
Unique global portfolio of green
✓ Establishing key partnerships and investments in strategic ecosystems to further our impact metals and energy solutions
that reverse climate change
as a force for good
✓ Unique, diversified portfolio ensures balance & risk mitigation and solid financial position
Inclusive, diverse and bionic
provides significant optionality
Instrumental in building
pandemic-resilient ecosystems
26Questions? Email: ir@sibanyestillwater.com James Wellsted +27(0)83 453 4014 Henrika Ninham +27(0)72 448 5910 Tickers: JSE: SSW and NYSE: SBSW Chris Law +44(0)792 312 6200 Website: www.sibanyestillwater.com
Appendix
Nickel & Cobalt

Confidential: SFA (Oxford)
30
         Nickel market summary
         Surging supply to keep nickel price subdued

                                                                                                    Nickel supply-demand balance
          •   The nickel market is predicted to return to surplus this year (258 kt).               kt                                                                                      $/t
                                                                                                                                                   Outlook
                                                                                                    350                                                                                   30,000
          •   Refined nickel production is forecast to rise by 18% to 3.1 mt this year, lifted by                                              319
              rapid expansion of NPI and HPAL production in Indonesia.
                                                                                                    300

          •   The pressure on class 1 nickel is easing.                                                                             258                    252
                                                                                                    250                                                                                   25,000
          •   Net nickel demand is forecast to expand by 4% to 2.9 mt in 2022.                                                                                        222

                                                                                                    200
          •   SFA forecasts an average price of $25,000/t in 2022.
                                                                                                              146
          •   The price risks are to the downside as the economic outlook has deteriorated.         150                                                                                   20,000

                                                                                                    100

                                                                                                     50                                                                                   15,000
                                                                                                                                                                                   27

                                                                                                         0

                                                                                                     -50                                                                                  10,000

                                                                                                    -100

                                                                                                                         -116                  Refined balance              Price (rhs)
                                                                                                    -150                                                                                  5,000
                                                                                                             2020        2021       2022       2023       2024       2025         2026

                                                                                                                                              Source: SFA (Oxford), Bloomberg.
Confidential: SFA (Oxford)                                                                                   Note: Balances exclude supply from probable and possible projects.
31
Cobalt market summary
Surplus market in 2022 as supply response arrives
Cobalt supply-demand balance
• The cobalt market is predicted to shift to a 7 kt surplus this year, as supply growth kt $/t
outpaces demand. Outlook
20 80,000
• Automotive battery demand continues to increase rapidly, adding 28 kt (+60%) 12
10 7
this year to 75 kt (65 kt from BEVs). 70,000
0
• The market is projected to slip back into deficit in 2023.
-4 60,000
-10
• The price is forecast to average $66,750/t in 2022. -8
• The risk of recession in Europe or the US adds some potential demand downside. -20 50,000
-25
• Price risks are to the downside owing to inflationary pressures and slowing economic -30
growth. 40,000
-40
-50 30,000
-51
-60
20,000
-70
Balance
10,000
-80
-79
Price (rhs)
-90 0
2020 2021 2022 2023 2024 2025 2026
Source: SFA (Oxford), Bloomberg.
Confidential: SFA (Oxford) Note: Balances exclude supply from probable and possible projects.You can also read