BAV MAGAZINE SPECTROSCOPY - OF THE GERMAN ORGANIZATION & WORKING GROUP VARIABLE STARS BAV
←
→
Page content transcription
If your browser does not render page correctly, please read the page content below
BAV Magazine
      SPEcTRoscopy

of the German Organization
             &
      working group
     Variable stars BAV
                    Editor
      Bundesdeutsche Arbeitsgemeinschaft
       Für Veränderliche Sterne e.V. (BAV)
               Munsterdamm 90
                 12169 Berlin

        Issue NO. 05   06/2019 ISSN 2566-5103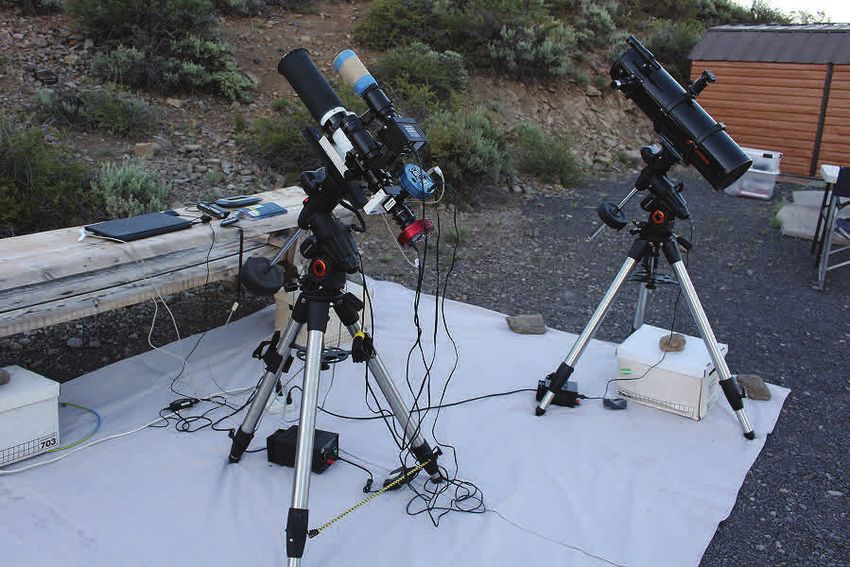
BAV Magazine
                            SPEcTRoscopy

Imprint
The BAV MAGAZINE SPECTROSCOPY appears half-yearly from June 2017. Responsibilty
for publication: German Working Group for Variable Stars e.V. (BAV), Munsterdamm 90,
12169 Berlin

Editorial
Ernst Pollmann, 51375 Leverkusen, Emil-Nolde-Straße 12, ernst-pollmann@t-online.de
Lienhard Pagel, 18311, Klockenhagen Mecklenburger Str. 87, lienhard.pagel@t-online.de
Roland Bücke, 21035 Hamburg, Anna von Gierke Ring 147, rb@buecke.de
The authors are responsible for their contributions.
Cover picture: stargazerslounge.com

Content                                                                        Page

E. Pollmann: Editorial                                                           1

R. Berry: Student Spectrophotometry of the Planets: What Worked
and What Did Not                                                                2

M. Bröcker & S. Striewski: Hochauflösende Spektroskopie
des Doppelsterns β Aurigae                                                      16

M. Trypsteen: Determination of Planetary Rotation Velocities (Part II)          25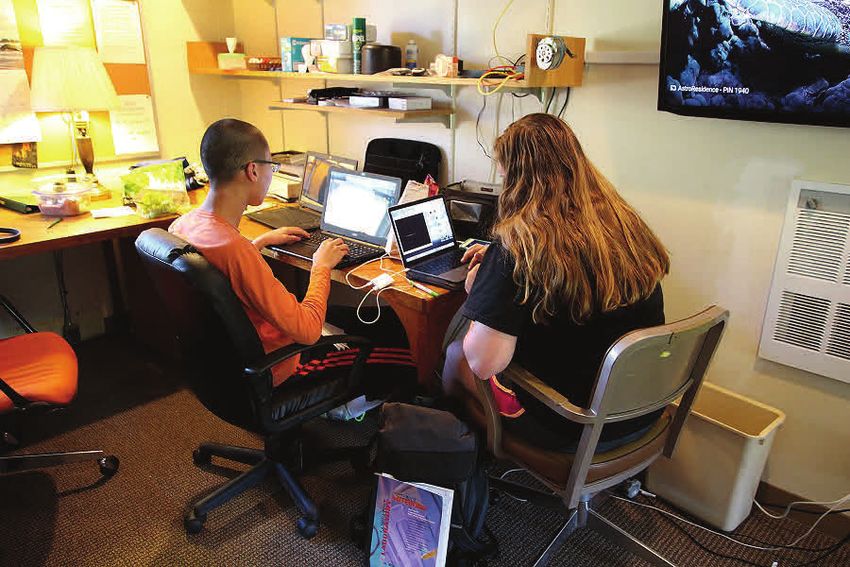
BAV Magazine
                                 SPEcTRoscopy

                                          EDITORIAL

     From the stars we basically receive only their electromagnetic radiation of different
wavelengths, and we “see” essentially only the surface of the radiating bodies. By evaluating the
light, we obtain information about:

   •   the direction of the radiation (positions and movement of the stars)
   •   the quantity of the radiation (brightness)
   •   the quality of the radiation (color, spectrum, polarization)

   For amateurs, only the narrow band of visible light is easily accessible. In this spectral region,
however, both the brightness (photometry) and the spectra of the objects can be examined.
Today's amateur astronomy, with its instrumental and computer-assisted equipment, enjoys
observation possibilities that were reserved exclusively for professional astronomers until a few
years ago.

   Thanks to the development of CCD technology, the types of observational perspectives have
become much more varied. For example, in the area of variable star observation, there are many
new possibilities in addition to already existing approaches.

   Professional variable star research employs techniques and observation methods to study the
physics and atmospheres of the stars in a holistic manner, considering all aspects and
occurrences. Thus, this means that the collected radiation must be understood as a complex
storage medium of the physical processes on and in the observed star.

   This is appropriate for the intensity of the light, as well as for its spectral composition. The
linking of brightness measurements and spectroscopy, a matter of course in professional
astronomy, reflects this connection.

   Along with brightness changes that occur in variable stars (which can occur quite frequently)
variable changes in the state of the stars also can take place and often are revealed in the
corresponding spectrum.

Ernst Pollmann

                               BAV MAGAZINE SPECTROSCOPY                                                1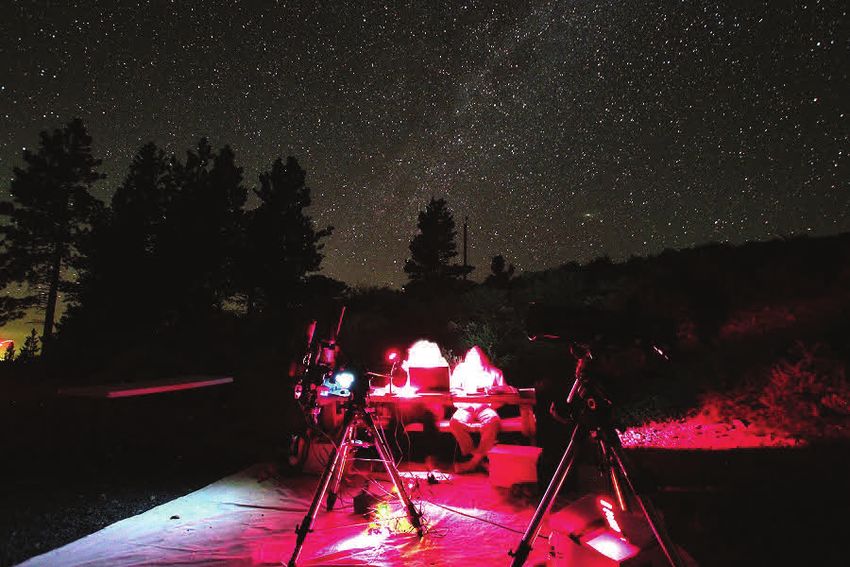
BAV Magazine
                               SPEcTRoscopy

   Student Spectrophotometry of the Planets: What Worked and What Did Not
             by Richard Berry, Berry, Alpaca Meadows Observatory, Lyons, Oregon

                      Abstract
                      In summer 2016 I worked with two high-school students on a relatively
                      advanced spectrophotometry project at the University of Oregon’s Pine
                      Mountain Observatory. My plan had been to use an ALPY 600
                      spectrograph on a 65 mm refractor to do an introductory survey of stellar
                      spectral types. But when the small telescope’s mount died, I asked the
                      students what they wanted to do. They said: Let’s do planets! Since Pine
                      Mountain Observatory’s 24-inch f/13 Cassegrain was available, we put
the ALPY on the 24-inch, and shot spectra of Jupiter, Mars, Saturn, Titan, Uranus, Neptune,
Triton, and the Moon. Everything worked perfectly (the success part!), but understanding what
the data meant required more chemistry, physics, math, and software skills than the students
could begin to absorb (i.e., not a success).
   Introduction
   We will hear a lot of success stories at this meeting. But I’m going to tell you about an
experience that I had about a year ago that was a good part of my motivation for coming to this
meeting. Let me paint a picture: we’re at the University of Oregon’s Pine Mountain
Observatory, at 6,500 feet elevation, doing a four-day summer astronomy workshop for high-
school students. The students stayed in an adjacent campground an easy walk from the
observatory.

   The workshop was put on by six amateur astronomers who served as mentors. The six of us
who did this felt the need to pay back the experiences we’d had in the 50s and 60s that got us
interested in astronomy or interested in computers, and ultimately led us to science-related
careers. The projects were based on what those of us

   involved were interested in, or into, or excited by. Each of us mentored two to four high-
schoolers; two were assigned to me. Projects included taking pretty pictures, asteroid orbit
determination, and measuring scintillation noise. Since I had been playing with a new
spectrograph, I planned to introduce my two students to stellar spectroscopy.

   Although Pine Mountain Observatory has a 24-inch f/13 Boller and Chivens Cassegrain
reflector, all of the mentors brought their own equipment, much of it high-end amateur gear.
For example, the guy doing asteroid orbits brought a heavy-duty AstroPhysics mount with a 120
mm Takahashi refractor. The different projects were spread along the walkway between the 24-
inch dome and the 32-inch dome (the 32-inch was not functioning).

                             BAV MAGAZINE SPECTROSCOPY                                            2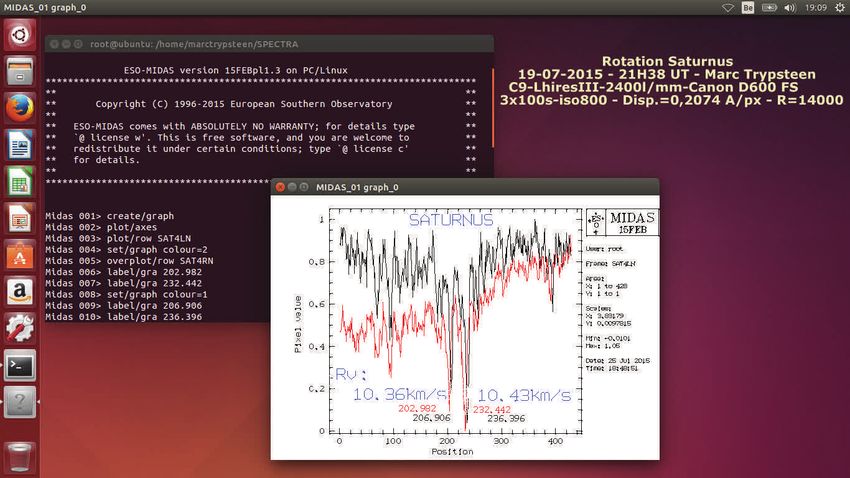
BAV Magazine
                                 SPEcTRoscopy

                                             Student Spectrophotometry of the Planets: Richard Berry
   We had four beautifully clear and moonless nights in a row. Each group of students was
expected to give an afternoon presentation on their activities on the lastday of the workshop.
Mentors gave talks in the mornings. In addition to producing an “instant talk,” some students
expected to use the data we collected in a senior-year project at their high schools. The younger
of my two was just entering tenth grade, but the older would be in her senior year that fall. My
plan – to introduce stellar spectroscopy – was that we would collect spectra from a list of “Oh Be
A Fine Girl Kiss Me” stars so the kids would see what is involved in taking astronomical data.
While still under the stars, we would take a quick look at each spectrum, and it would be clear
that the spectra of stars vary. We could discuss what we were seeing, and during the day I hoped
that we would have time to reduce the data and then attempt to arrange the spectra in some
logical order, just as astronomers did in the early 20th Century.

   The equipment I brought was rather modest: an ALPY 600 spectrograph mounted on a 65
mm f/6.5 refractor and Celestron AVX mounting. The ALPY is a compact design that provides a
spectral resolution of 500 over a range from 375 to 750 nanometers —the whole visual
spectrum. The ALPY has two CCD cameras: one to capture the spectra and one to view the slit
of the spectrograph. With large telescopes, seeing enlarges the star images, so only a fraction of a
star’s light enters the spectrograph. The beauty of using a spectrograph on a small refractor is
that the refractor forms tiny, clean star images, so nearly all the light from a star goes into the
ALPY’s 23-micron slit. Relative to expectations, the small system outperforms larger ones
because all the light gets used. When you are guiding, you can see that the entire star image
disappears into the slit.

Fig. 1: Our original observing plan employed a 65mm refractor with a Shelyak ALPY 600
spectrograph. Observers were seated at apicnic table on the north side of thetelescope. The
second instrument was asmall Newtonian telescope for recreational visual observing during
longer exposures.

                              BAV MAGAZINE SPECTROSCOPY                                                3
BAV Magazine
                                 SPEcTRoscopy

                                             Student Spectrophotometry of the Planets: Richard Berry

   We set up the telescope, mount, and spectrograph on a graveled area, and located the
students and a computer with control software on a picnic table beside it. Once everything was
working - at least in theory - the mount, spectroscope, and CCD cameras could be run remotely
from the computer ten feet away. We got started quickly enough; we soon had spectra of bright
stars of different types.

    I sat with them and made sure everything kept working. I may have helped them too much by
finding the stars for them, but they quickly picked up the skills for centering stars, guiding on the
slit, starting exposures, and saving spectra to the hard drive. Well, it got cold on the mountain.
No matter what you tell high-school kids, they don’t believe the temperature might drop to 32
degrees with a 15 mile an hour wind in the middle of summer. So they were freezing to death,
and they were not used to staying up late at night. By midnight they were miserable and their
brains had stopped working, so we called it quits.

   The next morning I found the students had already begun to prepare their presentation. They
hadmined Wikipedia for stuff about stars, and the question they had for me was, “What is our
hypothesis?” The Scientific Method, they had been taught, involved framing a hypothesis that
wewould test using our observations. We had a long discussion during which I learned about the
older student’s project from the previous year that involved the dissolution of coins in various
acids and solvents. Collecting an O-B-A-F-G-K-Msequence did not fit into a scientific method
scheme, so I suggested we try something different: “Let’s look at M stars, the red ones with the
bumpy spectra.

   Fig. 2: Even when the screens were reduced to their lowest intensity, the laptop computer
screens effectively blinded the observers controlling the CCD spectrum and guide camera.
Thenight was clear and became quite chilly, so the student observers, who sat whileoperating the
CCD camera from thecomputer, became very cold.

                               BAV MAGAZINE SPECTROSCOPY                                                4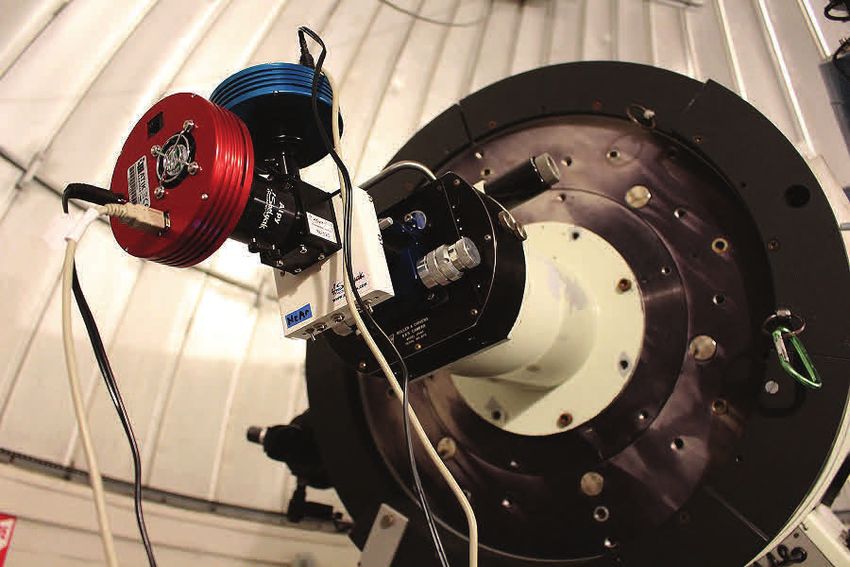
BAV Magazine
                                   SPEcTRoscopy

                                               Student Spectrophotometry of the Planets: Richard Berry
   We can look for stars with different amounts of carbon, oxygen, and nitrogen.” It was not a
very good idea, but I hoped we could put together something that would be suitable for her
senior project.

   It proved tough to come up with a list of suitable type M stars. They needed to be oddballs,
and they needed to be reasonably bright for the small aperture of the telescope. The evening
started fairly well. After the first several stars, I left the kids gathering spectra and went off to see
what the other groups were up to. When I came back, I noticed that the telescope was pointing
far from the nominal target. A quick check showed that the spectra they had taken were not M
stars at all. For some reason, the mount was pointing at anything but the target stars. Added to
that, it was cold again.We gave up some time after midnight.

   What Did Work
   The next morning I took a walk with the students. I said, “You guys, we’ve got nothing . . .
we don’t have a hypothesis with this project. We’ve collected some spectra of stars around the
sky. It’s like a collection of leaves from different trees. We don’t know enough about trees or
leaves to make a hypothesis.”

   “However,” I said, “We have two more nights, so at least we ought to have some fun. What
would you like to do?” And they said, “We want to do some planets!” Mars, Jupiter, and Saturn
had been temptingly lined up across the southern sky that July, shining brilliantly, and, for most
people, planets are more familiar and comprehensible than stars. So I said. “Okay. I’ll see
whether we can hang our spectrograph on the 24-inch telescope, and I don’t think anyone else is
using it. It will be fun. Besides, it’ll be warmer inside the dome than it is outside in the breeze.”

    So we hung the tiny ALPY spectrograph on the rear of the huge 24-inch Cassegrain, and
strung the control wires to the students sitting at a folding table beneath the telescope. As
darkness fell, we aimed the big telescope at Jupiter. With its 8 meter focal length, Jupiter was
fully half the height of the slit. Although the seeing was not great, and cloud bands were visible in
the guide camera image. We carefully aligned the ALPY so the slit ran along the Jovian equator,
and then shot a series of 10-second exposures. That’s when the serendipity kicked in: three of
the Jovian satellites were visible.

   We grabbed a 300-second exposure of each one, and then moved the telescope over to Mars.
Since the polar caps were visible, we captured a series of 5-second spectra from the polar caps as
well as the east and west limbs of the planet. I explained that I did not know whether our spectra
would show any differences in the light reflected from the planet’s red deserts and icy polar
regions, but if we took the spectra, we would find out.

                                BAV MAGAZINE SPECTROSCOPY                                                   5
BAV Magazine
                                SPEcTRoscopy

                                            Student Spectrophotometry of the Planets: Richard Berry
    Saturn proved to be a delight. With the slit running along the equatorial axis, spectra of the
ball of theplanet were flanked by spectra of the rings. Each Saturn exposure required 60 seconds.
All three of the parallel spectra showed Fraunhofer lines, but only the ball of the planet showed
obvious dark absorption bands. More serendipity: there was Titan, a satellite with an
atmosphere! Would wesee methane there, too? The best thing that happened that night – at least
it was fun for me –
occurred after we finished Saturn.

   The younger student had already conked out. I checked anephemeris, and proposed to the
older student, “Do you think you have the energy to wait for Neptune to come around? We’ve
done two giant planets, Jupiter and Saturn, but Neptune is another giant planet.” Would it be
like Jupiter and Saturn, or would it be different?

    Fig. 3: The compact ALPY 600 spectrograph worked extremely well on Pine Mountain
       Observatory’s 24-inch f/13 Cassegrain telescope. All functions of the ALPY were
          controlled “by wire” by the observers seated at a table below the telescope.

   “Well, maybe,” she said. “It’ll be up in two hours, so why don’t we do some calibration
spectra on stars?” So the two hours went by quickly as we gathered spectra of some type A stars
that were high in the sky. When Neptune came around, we did ten five-minute exposures and
got some nice Neptune data. We even tried one of Triton, the eighth-magnitude satellite of
Neptune. Then I sprung it on her: “In another hour, we can get Uranus,” and when it rose we
spent another hour taking 5-minute exposures of Uranus’ spectrum.

                              BAV MAGAZINE SPECTROSCOPY                                               6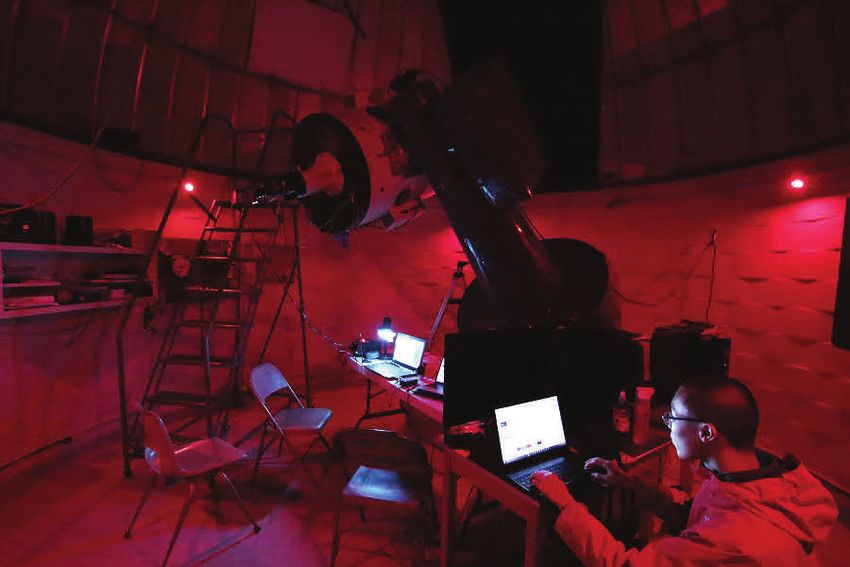
BAV Magazine
                                SPEcTRoscopy

                                            Student Spectrophotometry of the Planets: Richard Berry
   By now, dawn was coming and the sky had begun to brighten. I looked out the dome slit and I
saw that the Moon was coming up. “Look, we can get a calibration spectrum that will fill the
entire slit, and it’s a solar spectrum from an airless body, modified only by passage through the
Earth’s atmosphere.” We pointed the telescope at the Moon as soon as it cleared the dome wall,
and got some fine lunar spectra for calibration.

   We parked the telescope and closed the dome a little before the Sun came up. We had ended
up with beautiful spectra of Jupiter, Saturn, Uranus and Neptune, Mars, and the Moon – as well
as three of the Galilean satellites of Jupiter, and Saturn’s moon Titan. We had beautiful data.
Wehad methane and ammonia bands on the giant planets, and when we had done Mars we also
had the equatorial regions versus the polar caps. The following night, the last night, we shot
more images of Saturn in the early evening and left the CCDs taking bias frames dark frames
until dawn.

 Fig. 4: The younger student, seated at his computer, attempted to process spectra in real time.
      With more compatible computers and software, this could have worked very nicely.

   Because we undertook making planetary spectra in the spirit of fun, the students seemed to
enjoy the process much more than they had the previous nights of taking stellar spectra for a
scientific presentation. It helped that it was relatively warm in the dome. Also, I think the 24-
inch was closer to their conception of “telescope,” and the planets were more varied and “sexy”
than stars. Both students mastered focusing the image using the in/out focus motor, centering
objects on the slit,guiding to keep an object on the slit, setting exposure times, taking
exposures, savingexposures, as well as keeping a written log of the objects, exposures, and
context data.

                             BAV MAGAZINE SPECTROSCOPY                                                7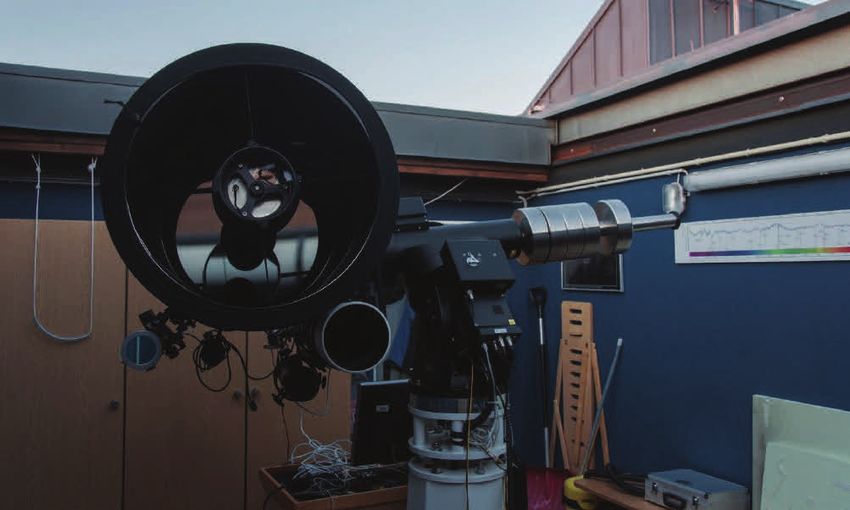
BAV Magazine
                                SPEcTRoscopy

                                            Student Spectrophotometry of the Planets: Richard Berry
   We had a lot of time in the dimly lit dome to discuss what we were doing, and made informal
scribbles on a legal pad. The younger student fell asleep at midnight, but before he did, he had
taken his turns guiding the telescope. I had enough time to find out how much (and how little)
they already knew, and how we might be able to shape their presentation to report what we had
accomplished.

    Fig. 5: The screen of the computer we used to control the spectrograph displayed images
from the spectrum camera (on the left) and the slit-monitor and guide camera (on the right). The
      students used the telescope control paddle to center and guide images of the planets.

   I won’t delve into the science of spectrophotometry,except to explain, in as few words as
possible, what we got. The Sun illuminates the planets, and ist spectrum is the classic Fraunhofer
spectrum, full of spectral absorption lines. When sunlight reflects from a body in space, the body
modifies the solar spectrum. The straight reflectance spectrum of Saturn combines the effects of
the solar spectrum with the reflectance spectrum of Saturn. The gas giant planets Jupiter and
Saturn, and the water giant planets, Uranus and Neptune, absorb energy due to the molecular
absorption bands of methane and possibly ammonia. We were fortunate in getting a beautiful set
of reflectance spectra of the Moon, which has no atmosphere, so its spectrum consists of the
sunlight that is only slightly yellowed by the minerals in the lunar surface. When you divide
Saturn’s spectrum by the lunar spectrum, the Fraunhofer lines common to both divide out and –
BINGO – you see the absorption lines standing out loud and clear on the ball of the planet, but
no such features on the rings. The younger student quickly became adept at usingImageJ. When
he asked me how to extract aone-dimensional profile from a spectrum, I told him I did not
know, but it was such a basic operation that Image. I was sure to do it.He figured it out on his
own in about five minutes.

                              BAV MAGAZINE SPECTROSCOPY                                               8
BAV Magazine
SPEcTRoscopy
Student Spectrophotometry of the Planets: Richard Berry
What Didn’t Work
Computers. I had a PC. They had Macs. Software? The program I had intended to use for
reducing the spectra, Tom Fields’ RSpec, did not at that time run on Macs. I like RSpec: it’s easy
to use, has a short learning curve, and it teaches as you learn to use it1 But there’s nothing magic
about extracting a one-dimensional profile from a two-dimensionalimage. I fished up and
installed ImageJ, a flexible image-processing program that ran on their Macs as well as on my
PC. The younger student was clearly impressed with its capabilities. So that turned out okay.
The students knew all about Google Drive; I had only heard about it. I logged in and fifteen
minutes later we were in business. We used Google Drive to move our data from my computer
to theirs, and various Google apps to prepare their presentation. Although the Internet
connection on the mountain was slow, it was fast enough to let us locate and download ImageJ,
and it allowed us to work effectively with Google apps. It also gave the students access to
Wikipedia, which they considered essential to preparing the presentation expected of them.
Fig. 7: With the help of Google Docs and Google Show, the students reduced the data and
prepared their presentation. The younger student, on the left, using ImageJ, produced
intensity profiles, while the older student researched spectroscopy and prepared slides.
That, in fact, highlights the mismatch in thinking between the students and me. The students
felt pressured to get the “right” results. They were acutely aware they would be speaking to
other bright high-school kids, to their teachers, and to the other mentors.But I had gone out with
the attitude: I’m not sure what we’re going to get with these planets.
BAV MAGAZINE SPECTROSCOPY 9BAV Magazine
SPEcTRoscopy
Student Spectrophotometry of the Planets: Richard Berry
I knew in general what we would get —methane in the giant planet atmospheres would
surely be unmissable —but I had only a rough idea what the exposures would be required for
planets on the big telescope, or how good our data would be. Basically, I was improvising and
learning as we went. We would shoot a spectrum, measure the pixel values in it, and try another
exposure. That initially freaked them out. They wanted me to be the expert; someone who
could guide them safely through a mysterious process, someone who was going to tell them what
was going to happen next.
Fig. 8: Saturn demonstrates reflectance spectroscopy of the planets. At right, the image of Saturn
rests on the slit of the spectrograph, while the spectrum appears on the left. The solar Fraunhofer
spectrum appears in the spectrum of the ball and the rings of the planet, but methane absorption
bands appear only in the spectrum of the ball.
I think that the younger student understood the idea first: try an exposure, measure the
result, adjust the exposure, try again. The enormous size of the planetary images from the big
telescope —two millimeters across Saturn’s ring system —meant that only a tiny fraction of the
planet’s light entered the 23-micron slit of the spectrograph. It turned out that our Saturn
spectra required 60 seconds, but we needed only 300 seconds for its very much dimmer satellite
Titan, courtesy of Titan’s compact star-like image. That was a nice surprise!
In a school setting, you’d have a month or so to teach students about light, what a spectrum
is, etc.:
all that background needed to comprehendspectroscopy. In a four-day workshop setting, with
one student going into tenth grade and one goinginto twelfth grade, they were unsure in their
knowledge of the solar system and which planetswere which.
BAV MAGAZINE SPECTROSCOPY 10BAV Magazine
SPEcTRoscopy
Student Spectrophotometry of the Planets: Richard Berry
Astronomy is not taught in Oregon schools, but in the popular media, characters routinely fly
off to planets and galaxies with equal ease. Given what they see and hear, it’s not hard to
understand why basic astronomy is confusing.
What They Learned
It’s difficult to assess - and partly speculation on my part - what the students actually learned
from their experience at Pine Mountain Observatory. Based on the presentation they gave for the
otherstudents, their teachers, and the other mentors, as well as on comments they made at the
time, I offer the following:
It gets cold on a mountain at night.
The big telescope was fun to use!
Data are precious.
When you try to find a star, they all look alike.
Five-minute exposures take forever.
You must guide to keep Saturn on the slit.
Data does not analyze itself by itself.
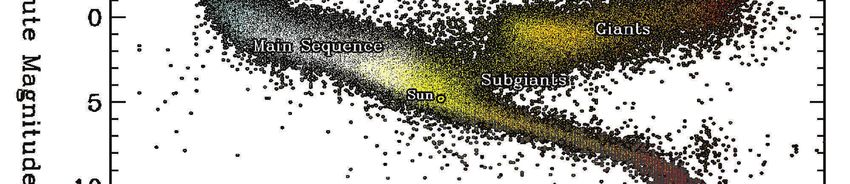
Spectra are smeary streaks.
Spectrum data is a bumpy line.
Some of the bumps mean Jupiter has gas.
“Some of the bumps mean Jupiter has gas.” Well, you have to admit that although it may
sound simplistic, that statement is true enough. So in some respects, they did grasp the basic
rationale for what we were doing. The younger student, who did the bulk of the work extracting
spectral curves from the spectrum images, may have gained a better understanding, but the older
student prepared most of their presentation. What they didn’t get in the presentation is the big
picture. In their presentation, they did not explain that the Sun has a spectrum with Fraunhofer
lines in it, that the Sun shines on the planet, the planet modifies the spectrum when reflects the
sunlight, and that, we, viewing the planet through the Earth’s atmosphere, can, through clever
manipulation of the spectral data that we took, deduce something about the properties of the
planet’s surface. They did not even come away from the experience, I think, with a sense of joy
from getting out there and looking closely at some aspect of the real Universe. They were trying
to force-fit their “doing science” experience into their understanding of the scientific method,
with a hypothesis and so on. They were aware that astronomers already have textbook answers,
and they were concerned about getting the right answers. During those hours in the 24-inch
dome, I stressed, “There is no right answer. What we observe here and now is what is actually
out there.” I don’t think they really understood that what we do as astronomers and observers
informs the textbooks, not the other way around.
BAV MAGAZINE SPECTROSCOPY 11BAV Magazine
SPEcTRoscopy
Student Spectrophotometry of the Planets: Richard Berry
Afterword
I closed my talk at the RTSRE conference saying, “If we’re going to do these summer research
projects more effectively, we must adopt better methods and better thinking. In the six months
since that time, I have thought about this a good deal. The very simplest change would be to
meet with the students two or three weeks ahead of the workshop, and spend a day talking
through what the projects would be and what doing them would involve. Given a basic
grounding, the opportunity to ask questions, and some time to do some on-line research, they
could arrive both prepared and ready for the direct experience.It may be difficult, but I think we
owe it to potential scientists to tell them that the scientific method is a high-level description of a
process that working scientists usually honor only in the breach.
ig. 9: Our spectra from Pine Mountain Observatory show gas absorption bands for the giant
planets. In each case, the raw reflectance spectrum has been calibrated and then divided by the
reflectance spectrum of the Moon, thereby removing the solar Fraunhofer lines. Jupiter shows
both methane and ammonia bands, Saturn’s ball shows methane and weak ammonia bands while
the rings display no absorptions. The spectra of Uranus and Neptune show very deep methane
absorption.
We work, we think, we discuss, we make observations, we get inspirations — and
afterwardwe write it up as if it had been a systematic process. The reality is that we muck around
exploring the territory, making observations just to see what’s going on. In an observational
science like astronomy, this often occurs when we get new instruments or observing tools.
BAV MAGAZINE SPECTROSCOPY 12BAV Magazine
SPEcTRoscopy
Student Spectrophotometry of the Planets: Richard Berry
This open pattern of exploration is what I planned to do with the students and the
spectrograph: “Let’s look at a bunch of stars and see what is out there.” Of course, I wanted the
spectra we took to include every type of star, not just the common A, F, G, and K stars, so I had
salted the list with the relatively rare O, B, and M-type stars.
Once we think we understand the territory, scientists tend to standardize methods of
collecting data. That is more or less what the students and I did with our spectra of the planets.
Instead of searching, we followed an observing protocol to make scientific measurements. Much
of ordinary science consists of doing this type ofbread-and-butter observation; filling in gaps,
populating databases, and keeping our eyes openfor anything out of the ordinary. A formal
scientific method is far from our minds most days; we’re working inside a well-established body
of knowledge, decorating the walls with more stuff that fits the prevailing meme.
So when does the scientific method come into play? In my experience, we drag it out and
apply it when the going gets sticky. We have observations that don’t fit. We have a hunch that
might explain what’s going on. The purely creative process breaks down, and we start writing
things down. We make a list of hunches. We run gedanken experiments. We do the math. We
need access to a bigger telescope, so we write a proposal to the timeallocation committee, and
have to get everything down on paper. I think that when we explain how science really works —
a creative endeavor that is both loosy-goosy and extremely demanding —we’ll find that more
students will get excited and want to join in playing this grand game.
It’s important to point out that I’m a 70-year-old guy who has been playing with telescopes
and gadgets for 58+ years, so I have a lot of experience to fall back on when things go awry. For
example, I had no qualms about operating PMO’s 24-inch Cassegrain telescope with ten minutes
instruction from the observatory’s tech support guy. I knew that a nominally f/5 spectrograph
would work happily on the f/13 telescope, and I knew enough to know that a focal-ratio
mismatch could have been a problem. I knew enough to get the telescope focused despite a
quirky focus motor. I’ve had enough experience with both PCs and Macs to recognize that we
could use ImageJ on both, and was delighted to discover the existence of AstroImageJ. Finally,
I’m not in the teaching profession. I’m having fun doing this. I have no skin in this game. I can be
wrong and it doesn’t matter.
I was greatly intrigued by the Freed and Genet ”communities of practice” concept. Although
not intended as a teaching environment, between my junior and senior year in high school I was a
summer “observer” at Yale University’s Bethany Station near New Haven. My job was to operate
a20-inch telescope with a four-channel spectrophotometer.
BAV MAGAZINE SPECTROSCOPY 13BAV Magazine
SPEcTRoscopy
Student Spectrophotometry of the Planets: Richard Berry
This meant running all systems from rewinding the weight-driven clock drive to servicing the
photomultiplier tube coolant loop each night with dry ice. I was in hog heaven! On clear nights
we observed possible flare stars all night long. On cloudy nights we observed the dark current in
the photomultiplier tubes all night long. During the days, I was free to annoy the graduate
students operating radio telescopes observing Jovian decametric radiation (it had been recently
found to be modulated by Io) with endless questions.
Since the RTSRE conference, I have had a very positive experience working with four
undergraduate physics student from Portland Community College. The project was to recreate
the Eddington Experiment of 1919 using modern amateur equipment during last summer’s solar
eclipse. Although their professor has no practical experience in observational astronomy, he is
good at getting grants, and had spotted this project as a good one. I was recruited, in part,
because my property and my observatory were nearly on the center line. T
hese students are ”non-traditional” in different ways. Two are in their early 30s, one in his late
30s, and one is a home-schooled high-school-age student who has been taking college-level
courses for several years. Four months before the eclipse, even before the RTSRE conference,
we had set up a small telescope with a CCD camera on my property. Two students trained on
that telescope and the other two trained with a portable telescope.
We had more than a dozen sessions together. We worked through a large number of
problems to be able to carry out high-precision astrometry with small telescopes. About three
days before the eclipse, I pulled back and let the students work out the details between
themselves. I could see they were a bit scared, but during the eclipse, when there would be no
time to ask questions, they had to be self-sufficient.
They captured excellent data — in focus and properly exposed — consisting of 23 eclipse
images and 10 astrometric reference images. Our next challenge would be to reduce these
images to determine whether the gravitational deflection predicted by Einstein’s General
Relativity agrees with the deflections we measured this summer.
However, we had failed to consider how complex data reduction would prove to be. I
proposed writing reduction software using Python’s NumPy, SciPy, and AstroPy libraries —
only to learn that not one of the students had any prior experience writing software, and at that
point I was just beginning to learn Python. Not surprisingly, progress has been slow; a few key
routines are now written and we have produced a few pretty charts.
BAV MAGAZINE SPECTROSCOPY 14BAV Magazine
SPEcTRoscopy
Student Spectrophotometry of the Planets: Richard Berry
Fig. 10: Jupiter divided by lunar spectrum.
But the students have regular spring-semester classes, and the Eddington Experiment is a non-
class activity that does not even offer them extra credit. I am hoping to rouse their interest this
coming summer, to complete the data reduction. My suspicion is that no amount of theory or
classroom work could have prepared these students for this experiment as doing the grunt work
and solving the practical problems we encountered. The “hands-off” nature of robotic telescopes
worries me. Observational astronomy seems to require a certain “gut feel” for the costs and
pitfalls of gathering actual data. You get cold. You get sleepy. A technician puts the wrong filter
in the filter wheel. You erase the wrong directory. Power supplies fail. Only after teachers and
their students experience the good, the bad, and the ugly of working hands-on with the tools of
their trade, can they properly love, appreciate, trust, and distrust aremote robotic telescope.
Acknowledgements
I would like to thank the Pine Mountain Observatory, its Director, Scott Fisher, and Alton
Luken, Operations Manager, for opening the Observatory and its facilities to volunteer
educational activities. Pine Mountain Observatory, located 34 miles southeast of Bend, Oregon,
isperched atop a mountain at an elevation of 6,300 feet. The observatory’s location is well placed
tomake the most of the dark skies that the Eastern Oregon high desert provides. The observatory
isoperated by the University of Oregon, Department of Physics, under a special use permit from
theDeschutes National Forest. The observatory’sprimary function is research and other
astronomical observations, including basic andadvanced scientific research. However education
atall levels is also an important function andobjective of the observatory. The current schedule of
activities is located at https://pmo.uoregon.edu.
Vie
BAV MAGAZINE SPECTROSCOPY 15BAV Magazine
SPEcTRoscopy
Hochauflösende Spektroskopie des Doppelsterns β Aurigae
von Marius Bröcker & Samuel Striewski (Teil I)
Einleitung
Es ist erstaunlich, dass Astronomen seit Anbeginn der Wissenschaft
Erkenntnisse über weit entfernte Sterne und Sonnensysteme gewinnen
konnten, ohne unseren Heimatplaneten je verlassen zu haben. Selbst
heutzutage, wo Raumfahrt seit langer Zeit Wirklichkeit geworden ist, ist
es uns immer noch unmöglich, entfernte Sterne zu bereisen. Um dennoch
den Rätseln unseres Universums auf den Grund zu gehen, haben wir uns
dazu entschieden, den Projektkurs Astronomie zu wählen und die
Chancen der Sternforschung wahrzunehmen. Nachdem wir uns
ausführlich mit der Spektralanalyse beschäftigt hatten, sind wir zu dem Entschluss gekommen,
uns in unserer Projektarbeit ebenfalls mit Spektroskopie zu beschäftigen. Nach erfolgreichen
Messungen und guten Ergebnissen fiel die Entscheidung, mit dem Projekt zusätzlich bei Jugend
forscht teilzunehmen.
In unserer Arbeit haben wir uns mit einem Doppelsternsystem namens β Aurigae beschäftigt,
da gerade in der Spektroskopie Doppelsterne ein hochinteressantes aber anspruchsvolles Thema
dar-stellen. Zudem stand β Aur zum Zeitpunkt unserer Messungen günstig am östlichen Himmel
und bot sich daher zur beispielhaften Bestimmung der systeminternen Parameter an. Das Ziel
unseres Projek-tes war, mit den gegebenen Messinstrumenten möglichst nah an die Ergebnisse
von professionellen Astronomen heranzukommen und damit die Qualität der Messinstrumente
sowie die korrekte Messweise zu erlernen. Das ausgewählte Sternsystem β Aur ist ein
sogenannter spektroskopischer Doppelstern. Die beiden Sterne sind gravitativ
aneinandergebunden und nur mit Hilfe von Spektroskopie auffindbar, da sie für uns nicht optisch
auflösbar sind. Im Falle von β Aur handelt es sich in Wirklichkeit um ein Dreifachsternsystem.
Allerdings leuchtet der dritte Stern neben β Aur A und B sehr schwach und ist weit entfernt von
seinen Geschwister-Sternen, so dass er für die folgende Messung keine Rolle spielt und man das
Sternsystem weiterhin als Doppelstern ansehen kann.
Zur Berechnung waren zunächst Aufnahmen von mehreren Spektren nötig, die über einen
längeren Zeitraum die Umkreisung der Sterne umeinander dokumentieren sollten. Da die
beiden Sterne um einen gemeinsamen Massenschwerpunkt kreisen, bewegen sie sich in
regelmäßigem Abstand auf den Beobachter hin und wieder von ihm weg. Durch den Doppler-
Effekt ist bekannt, dass sich die Wellenlänge von Licht verändert, wenn sich die Lichtquelle
relativ zum Beobachter bewegt. Somit können wir auch von der Erde aus, durch zeitliche
Veränderungen der Wellenlängen im Doppelstern-Spektrum, auf die Geschwindigkeit der
Sterne zu jedem Zeitpunkt Rückschlüsse ziehen.
BAV MAGAZINE SPECTROSCOPY 16BAV Magazine
SPEcTRoscopy
Spektroskopie des Doppelsterns β Aurigae
Hieraus kann man anschließend Erkenntnisse auf die Eigenschaften der Umlaufbahnen beider
Sterne ableiten und diese folglich recht genau bestimmen. Zu diesen Eigenschaften bzw. zu
diesen Parametern gehören beispielsweise die Umlaufzeit der Doppelsterne, die Entfernung
zueinander und ihre Massen, die Exzentrizität der Umlaufbahn usw.
Theoretische Grundlagen
Herleitungen aus dem Gravitationsgesetz
Aus den Messergebnissen, die im Verlauf dieser Arbeit entstanden sind, solle die Masse der
einzelnen Sterne M1 und M2, sowie deren Abstand r zueinander berechnet werden. Die
benötigten Formeln für diese Berechnung lassen sich mit Hilfe des Gravitationsgesetzes von Isaac
Newton und der Skizze aus Abb. 1 herleiten:
Die Massen der beiden Sterne des Dop-
pelsternsystems werden mit M1und M2
bezeichnet. In einer ersten einfachen An-
nahme bewegen sich die beiden Sterne auf
Kreisbahnen mit den Radien r1 und r2 um
den gemeinsamen Massenschwerpunk S.
Dabei ist r die Summe von r1 und r2.
Für jeden der beiden Sterne gilt, dass die
Gravitations-Wechselwirkung mit dem
jeweils anderen Stern eine Zentralkraft
darstellt, die den Stern auf einer Kreisbahn
um S hält.
Abb. 1: Skizze zur Massenbestimmung von Damit wird die Zentralkraft Fz durch die
Doppelsternen Gravitation Fc verursacht und es gilt folg-
lich für jeden der beiden Sterne:Fz=Fc
Aus der Definition von Fz und Fc folgen damit die beiden Gleichungen:
I. und II.
BAV MAGAZINE SPECTROSCOPY 17BAV Magazine
SPEcTRoscopy
Spektroskopie des Doppelsterns β Aurigae
ω steht für die Winkelgeschwindigkeit des Sterns. G ist die Gravitationskonstante, eine
Naturkonstante mit dem Zahlenwert 6,67408·10-11 m3 kg-1 s-2. Nun lässt sich in den Formeln I und II
M1 bzw. M2 wegkürzen. Ersetzt man nun in einem weiteren Schritt ω durch 2π/T
( T = Umlaufszeit des Sterns in Sekunden), so erhält man folgende Gleichungen:
III. und IV.
Nun gilt T1 = T2 = T, da sich wegen der Konstanz der Abstände r1 + r2 = r beide Sterne mit
derselben Winkelgeschwindigkeit um ihren gemeinsamen Schwerpunkt bewegen. Um zwei
„bequeme“ Formeln für die Massen M1 und M2 zu erhalten, werden im nächsten Schritt die
Formeln III und IV addiert bzw. dividiert. Zunächst die Addition von III + IV:
V.
Es gilt: r1 + r2 = r (siehe Abb. 1). Durch weiteres Umstellen der Formel V erhält man so:
VI.
Dividiert man die Formeln III und IV durcheinander, so erhält man das Massenverhältnis der
beiden Sterne aus dem umgekehrten Verhältnis der Abstände zum Schwerpunkt:
VII. daraus folgt:
Nun haben wir zwei Gleichungen (VI und VII) mit zwei Unbekannten (M1, M2). Die beiden
letzten Gleichungen VI und VII gelten übrigens auch für Doppelsternsysteme mit elliptischen
Umlaufbahnen, wenn man anstatt der Abstände r1 und r2 die entsprechenden Bahnhalbachsen
wählt. Da die Abstände der beiden Sterne im (spektroskopischen) Doppelsternsystem β Aur
optisch mit unseren Teleskopen an der Schulsternwarte nicht auflösbar sind, kann r und das
Abstandsverhältnis r1/r2 nicht ohne weiteres bestimmt werden. Mit Hilfe der Spektroskopie und
dem Dopplereffekt können jedoch Aussagen zur Geschwindigkeit gemacht werden, daher
müssen wir die Abstandsangaben mit Hilfe der Beziehungen der elementaren Kreiskinematik
durch Bahngeschwindigkeiten ersetzen. Mit dem Zusammenhang = ω* r = (2π/T) * r kann
der Radius, den die Kreisbahn besitzt, durch r = T * /2π ersetzt werden.
BAV MAGAZINE SPECTROSCOPY 18BAV Magazine
SPEcTRoscopy
Spektroskopie des Doppelsterns β Aurigae
Die spätere Auswertung unseres Spektroskopie-Experimentes ergibt zwei Sinusfunktionen,
die von der Geschwindigkeit und dem Winkel i ,der die Inklination, also den Neigungsgrad
gegenüber dem Beobachter angibt, abhängen. Beide Kurven besitzen jeweils einen Maximalwert
K1 bzw. K2, der durch die Gleichung K = * sin (i) ausgedrückt werden kann. Formt man diese
nach um und setzt es anschließend in die Gleichung für den Radius der Kreisbahn vom
vorherigen Absatz ein, so erhält man:
VIII.
Abstandsberechnung
Setzt man nun für die Radien die Formel VII ein, kürzen sich T und 2π * sin (i) weg und es bleibt
als Gleichung das Massenverhältnis zum umgekehrten Verhältnis der Maximalwerte K2 und K1:
IX.
Beide K-Werte sind als maximale Radialgeschwindigkeiten aus dem Graphen ablesbar und
somit kann bereits durch die Messpunkte das Massenverhältnis der Sterne im Doppelsternsystem
β Aur bestimmt werden. Um absolute Werte für die Massen der Sterne berechnen zu können,
wird der Winkel i benötigt. Die Rechnung geht aus dem oben bereits umgeformten
Gravitationsgesetz (VI) hervor. Der Gesamtabstand r wurde als r1 + r2 definiert und mit VIII
eingesetzt in VI folgt:
X. bzw. XI.
Formt man IX. nach M1 um und setzt es in X. ein, erhält man den absoluten Wert von M2:
XII.
BAV MAGAZINE SPECTROSCOPY 19BAV Magazine
SPEcTRoscopy
Spektroskopie des Doppelsterns β Aurigae
Massenformel
Gleichermaßen gilt nach Umformung für M1:
XIII.
Abgesehen vom Neigungswinkel können alle weiteren Schritte zur Berechnung der
Massenverhältnisse und der absoluten Werte für die Masse ohne äußere Zusatzwerte vollzogen
werden. Lediglich die Umlaufdauer T und die Grenzgeschwindigkeiten K1 und K2 müssen nun
bestimmt werden, wofür zunächst mit der Aufnahme eines Sternspektrums von β Aur zu
beginnen ist.
Radialgeschwindigkeit
Die Radialgeschwindigkeit eines Himmelskörpers, in unserem Fall die von β Aur, bezeichnet
die Geschwindigkeitskomponente des Objekts relativ zum Beobachter, also der Erde.
a: Große Halbachse der Bahn
e: nummerische Exzentrizität
i: Bahnneigung (Inklination)
r: Radiusvektor
: wahre Anomalie
ω: Periastronwinkel
Ω: Länge des aufsteigenden Knotens
P: Periastron
A: Apastron
t: Epoche des Periapsis-Durchgangs
M: Zentrum der Ellipse
γ: Richtung zum Frühlingspunkt.
Dieser ist der Schnittpunkt von
Äquator und Ekliptik beim
Durchgang der Sonne von Süden
nach Norden.
Abb. 2: Bahnelemente und ihre Parameter
BAV MAGAZINE SPECTROSCOPY 20BAV Magazine
SPEcTRoscopy
Spektroskopie des Doppelsterns β Aurigae
Definiert ist sie als positiv, wenn sich das Himmelsobjekt in Richtung der Sichtlinie des
Beobachters entfernt. Ist das der Fall, so tritt auch die sogenannte Rotverschiebung im Spektrum
auf, da sich die Wellenlängen durch den Doppler-Effekt strecken und –mathematisch gesehen –
größer werden. Die genaue Messung der Radialgeschwindigkeit bietet letztendlich Aufschluss
über die systemrelevanten Bahnparameter von β Aur. Für die Umlaufbahn eines Sterns gelten
die Parameter neben Abb. 2. Das zweite Keplersche-Gesetz zeigt, dass die
Oberflächengeschwindigkeit konstant ist: Der zweite Stern bewegt sich also beispielsweise
schneller, wenn er sich näher am ersten Stern befindet. Mathematisch drückt sich dieser
Sachverhalt folgendermaßen aus:
I.
Der Abstand r zwischen beiden Sternen wird angegeben als:
II.
Schließlich folgt aus dem dritten Keplerschen-Gesetz der Zusammenhang zwischen der
Gesamtmasse M des Systems (in Sonnenmassen) und der großen Bahnhalbachse a (in
astronomischen Einheiten) und der Umlaufzeit T (in Jahren):
III.
Die ersten beiden Keplerschen-Gesetze implizieren: In einem Doppelsternsystem wird zur
Beschreibung der Umlaufbewegung der globalen Systemgeschwindigkeit Vy eine periodische
Radialgeschwindigkeit Vr hinzugefügt.
IV.
Formel der Radialgeschwindigkeit
Die Hälfte der Amplitude, genannt K1 (für den i-ten Stern) wird berechnet aus:
V.
Dabei ist a1 die Bahnhalbachse der Umlaufbahn um den Massenschwerpunkt. Im Falle von
spektroskopischen Doppelsternsystemen, wie β Aurigae, ist neben K1 auch K2 im Spektrum
messbar. So ist es uns möglich, die Parameter über die Radialgeschwindigkeit zu bestimmen.
BAV MAGAZINE SPECTROSCOPY 21BAV Magazine
SPEcTRoscopy
Spektroskopie des Doppelsterns β Aurigae
Das Schülerlabor
Die Messungen wurden im
Schülerlabor Astronomie auf
dem Dach des Carl-Fuhlrott-
Gymnasiums (CFG) durchge-
führt (Abb.3). Neben 6 weite-
ren Stationen steht auch eine
Aufnahmestation, die Station 7,
mit einem CDK-20 Teleskop
zur Verfügung, welches für die
Aufnahmen genutzt wurde.
Abb. 3: Die Sternwarte auf dem Dach des CFG
Bei dem CDK 20 in der Station
7 handelt es sich um ein Spiegel-
Teleskop mit einer Öffnung von
20.5 Zoll, was einem Durch-
messer von 520.7 mm ent-
spricht (Abb.4). Die Lichtsam-
melleistung des Teleskops liegt
bei circa 5250 und signalisiert,
dass sie 5250 mal so viel Licht
wahrnehmen kann wie das
menschliche Auge.
Abb. 4: Auf der Sternwarte am CFG ist das CDK-20 fest auf
der parallaktischen Montierung GM 4000 HPS II montiert.
Die Brennweite von 3454 mm und das Öffnungsverhältnis f/6,8 ordnen das CDK 20 zu den
schnellen Optiken ein. Für weit entfernte Deep-Sky-Objekte oder Sterne wie β Aur eignet es
sich daher besonders gut, da durch die größere Sammelleistung die Belichtungsdauer kurz wird
und man schärfere Bilder erhält. Sowohl der elliptische Hauptspiegel mit einem
Öffnungsverhältnis von f/3 und einem Durchmesser von 520.7 mm, als auch der sphärische
Fangspiegel mit 190.5 mm Öffnung ist aus austemperiertem Pyrex gefertigt und qualitativ sehr
hochwertig, besonders für eine Sternwarte, die von Amateurastronomen, wie uns Schülern,
genutzt wird.
BAV MAGAZINE SPECTROSCOPY 22BAV Magazine
SPEcTRoscopy
Spektroskopie des Doppelsterns β Aurigae
Eine Optik allein reicht für erfolgreiche Beobachtungen jedoch noch nicht aus. Damit man
Objekte präzise ansteuern und nachführen kann, wird eine gute Montierung benötigt, welche
sowohl Stabilität für das schwere Teleskop bietet, als auch uneingeschränkte Schwenkmobilität
gewährleistet, in unserem Fall die parallaktische Montierung GM 4000 HPS II (High Precision
and Speed) (Abb. 3).
Abb. 5: Die Celestron Skyris und die SBIG Kamera installiert am BACHES-Echelle Spektrograf.
Um die hochwertige Qualität von Teleskop und Montierung angemessen nutzen zu können,
wurde die Aufnahmekamera SBIG STF 8300 M verwendet (Abb. 5). Damit bei den
Spektralaufnahmen überprüft werden konnte, ob der Stern nach wie vor an der richtigen
Position stand, nutzten wir die Guiding Kamera Celestron Skyris 274 M (Abb. 5).
Das eigentliche Kernstück der Arbeit ist die Aufnahme der Spektren. Diese wurden mit dem
hochauflösenden BACHES-Echelle Spektrograf aufgenommen (Abb. 5). Durch ein
Sprossengitter, auch genannt Echelle-Gitter, wird das eintreffende Licht in seine Wellenlängen
zerlegt und auf ein zweites Gitter reflektiert.
Da die einzelnen Sprossen im Größenbereich der Wellenlänge des sichtbaren Lichtes liegen,
sind sie vergleichbar mit vielen Einzelspalten, sog. Ordnungen, für die Wellenlängen im Bereich
von 392 nm bis 800 nm. Für diesen Bereich wird durch das zweite Gitter ein durchgehendes
Spektrum erzeugt, welches in Abschnitten übereinander geordnet ist (Abb.6). Daraus folgt eine
vielfach größere Auflösung des Spektrums, notwendig für unsere Messungen.
BAV MAGAZINE SPECTROSCOPY 23BAV Magazine
SPEcTRoscopy
Spektroskopie des Doppelsterns β Aurigae
Abb. 6: Zustandekommen der Ordnungen im BACHES-Echelle Spektrograf
Durchführung
Ablauf des Experiments
Das Ziel unseres Projektes war die Bestimmung möglichst vieler Bahnparameter des
Doppelsterns β Aur. Um eine erfolgreiche und vor allem eine auf eigenen Daten basierende
Auswertung zu erreichen, werden viele Datensätze benötigt. Ein Datensatz besteht aus drei
verschiedenen Messungen:
1. Erzeugung eines kontinuierlichen Flatfield-Spektrums mit Hilfe einer Halogenlampe.
Das Flatfield-Spektrum dient zur Ordnungserkennung des Sternspektrums sowie zur
Entfernung von eventuell vorhandenen Staubpartikeln.
2. Erstellung eines Referenzspektrums der Thorium-Argon-Lampe, mit welchem dem
Sternspektrum die zugehörigen Wellenlängen zugeordnet werden.
3. Aufnahme eines Spektrums von β Aur, dass nach der Kalibrierung mit dem Flatfield-
und dem Thorium-Argon-Spektrum ausgewertet wird.
Die Aufnahme dieser Spektren geschieht an dem CDK-20, an dem der BACHES-Echelle
Spektrograf angeschlossen ist. Über ein Faserkabel ist der Spektrograf an die Remote Calibration
Unit angeschlossen, welche manuell zuschaltbar ist. Anschließend werden die Spektren mit der
Astrosoftware MaxIm DL mit optimalen Belichtungszeiten aufgenommen. Danach erfolgt die
Aufnahme der Flatfield-Spektren und der Referenzspektren. Zuletzt werden die Doppelsterns
erfasst. (Wird fortgesetzt)
BAV MAGAZINE SPECTROSCOPY 24BAV Magazine
SPEcTRoscopy
Determination of Planetary Rotation Velocities
with BASS, VSpec and ESO-MIDAS (Part II)
by Marc Trypsteen
Abstract
The Doppler effect is used in astronomical spectroscopy to register the
movements of planets and stars along the line of sight. Here rotation
velocities of the planets Jupiter and Saturn were calculated. Spectra of
Jupiter have been recorded during the month of May 2015 and spectra of
Saturn during the month of July 2015. The equipment consisted of a
C9.25 F10 telescope coupled with a LHIRES III spectrograph equipped
with a 2400 L/mm grating and a 35 μm slit.
As a user of the Linux distribution "Ubuntu" I highly recommend this Debian-based operating
system as a working platform for ESOMIDAS. It is preferable to install an Ubuntu LTS (Long
Term Support) release because these versions are supported for five consecutive years. Currently
version 18.04 LTS is operational and will be supported until 2023. Former versions can be
upgraded to a more recent LTS version. [10]
A major advantage of Ubuntu is that Canonical, the company and software house behind the
Ubuntu distributions, has provided an integrated system for installing software packages more
smoothly and correctly, automatic updates included. Fig.8 illustrates how the latest version of
ESO-MIDAS (currently version 17.02pl1.2) is obtained from the Ubuntu software center.
Alternatively the ESO-MIDAS package can be downloaded directly from the Ubuntu launchpad.
[11].
Fig. 8: ESO-MIDAS download from the Ubuntu Software center
BAV MAGAZINE SPECTROSCOPY 25BAV Magazine
SPEcTRoscopy
Determination of Planetary Rotation Velocities, M. Trypsteen
The evolution of the available ESO-MIDAS Debian packages, more specifically data on the
version number, the possibilities, the stability, etc. can be consulted online [12].After a
successful installation of the operating system and ESOMIDAS, one types "Terminal window" on
activities or right- click on the desktop and select “terminal”. On the terminal window, username
@ ubuntu: - $ or similar is displayed. With the command "ls" you will get a quick overview of
the files and the directories or folders. The program can be executed as user or as "root". In the
latter case, the command "sudo SU11 is entered followed by the correct password.
For a good operation of ESO-MIDAS, it is best to work from the directory or folder
containing the files of the spectra. For this purpose it is necessary to create in advance a folder
with a suitable name, using the command "mkdir new folder name".With the "cd folder name"
command, one is working from the correct directory. Pay attention that the entered names of
searched files or folders are either upper or lower case sensitive. From the folder containing the
recorded spectra, enter the start command for ESO-MIDAS "inmidas". The opening window
appears with the version number at the top.On the next line the cursor is ready after the entry
"Midas 001>" (Fig.9).
Fig.9: Start screen for ESO-MIDAS
ESO-MIDAS uses its own language, the MCL (Midas Command Language). Besides executing
commands , it also features programming options that result in the so-called MIDAS procedures.
Additionally one can also write (small) programs or adjust existing scripts for ESO-MIDAS to
execute. The typical basic structure of the program assignment consists of a "command" and a
so-called "qualifier" separated by a slash /. These commands are insensitive to upper or lower
case letters, so commands such as "COMMAND / QUALIFIER" are as valid as "command /
qualifier". Examples of commands are load, create, plot, center, set, label, etc. Qualifiers
describe the object of the command such as image, graph, axes, gauss, row, etc ...
BAV MAGAZINE SPECTROSCOPY 26BAV Magazine
SPEcTRoscopy
Determination of Planetary Rotation Velocities, M. Trypsteen
The first task is to create a graphical frame with the commands "create / graph" and "plot /
axes" to add the horizontal and vertical axes. The size and location of the frame can be
individually adjusted by entering coordinates. Here we use the default settings of ESO-MIDAS.
A next step is now to load the recorded spectrum with "load / image filename". Here, the file
name "SAT4.fit" is used as an example.
Remark: Before starting ESO-MIDAS it is useful to display the contents of the folder with the
recorded spectra using the command "ls". It is then easier to scroll upwards later to check the
correct spelling of a filename. In the right part of Fig.10 the command "load / image SAT4.fit"
represents the recorded high-resolution spectrum of Saturn in the area around the Sodium
Doublet. On the left, the spectrum is then graphically displayed with the command "plot / row
SAT4.fit".
Fig.10: High-resolution spectrum of Saturn in the area of the Sodium Doublet
Subsequently, normalization and Gaussian calculations can be performed. For normalization,
use the command "@a normalize filename normalized name" and for the Gaussian calculation of
the barycenter the assignment "center/gauss gcurs? a",where "gcurs" is the abbreviation of "get
cursor", the "?" Indicates that one can click the left mouse button on certain locations of the
spectral lines and the "a" indicates that it concerns absorption lines. The values of the barycenters
calculated by ESO-MIDAS are immediately displayed on the screen.With a right click this
"center / gauss" assignment is stopped. The Gaussian calculation of the barycenter can be used
here as the spectral lines show a good symmetry.Figure 11 represents the spectrum of the right
and left sides of Saturn with the calculation of the barycenter for both lines of the Sodium
Doublet.
BAV MAGAZINE SPECTROSCOPY 27You can also read