Bayside City Council

HEALTH & WELLBEING PROFILE
2021-2025
←
→
Page content transcription
If your browser does not render page correctly, please read the page content below
Bayside City Council HEALTH & WELLBEING PROFILE 2021-2025
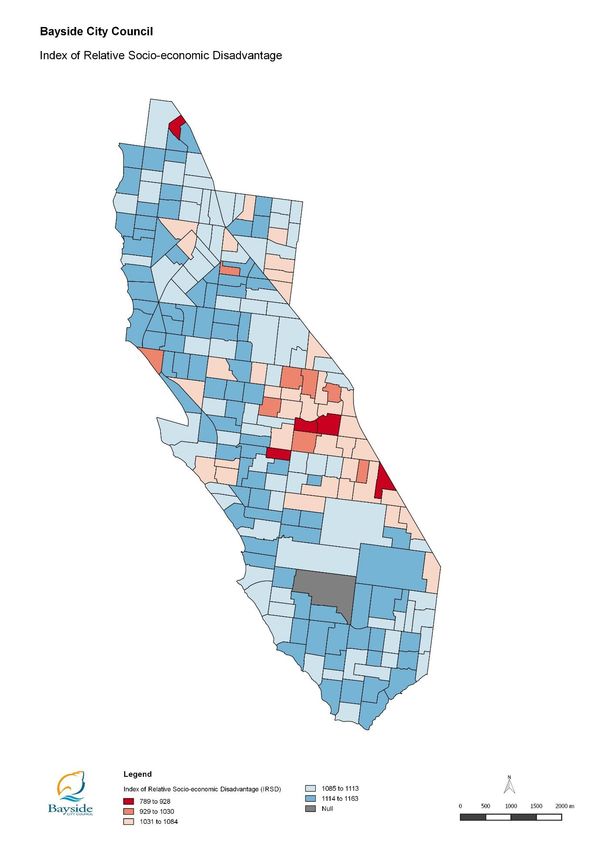
Table of Contents

     Summary of key findings ......................................................................................................................... 3
1.      The Bayside community .................................................................................................. 6
     1.1       Population ...................................................................................................................................... 6
     1.2       Age profile ..................................................................................................................................... 7
     1.3       Births and deaths ......................................................................................................................... 8
     1.4       Cultural diversity ........................................................................................................................... 8
     1.5       Indigenous population ................................................................................................................. 8
     1.6       Households ................................................................................................................................... 9
     1.7       Income ......................................................................................................................................... 10
     1.8       Education ..................................................................................................................................... 11
     1.9       Unpaid child care ........................................................................................................................ 11
     1.10      Occupations and industries of employment ........................................................................... 12
2.      Vulnerable populations.................................................................................................. 13
     2.1       Relative disadvantage in Bayside neighbourhoods .............................................................. 13
     2.2       People with a disability and carers .......................................................................................... 13
     2.3       Low income households ............................................................................................................ 15
     2.4       Social and public housing ......................................................................................................... 17
     2.5       Income support recipients ......................................................................................................... 17
     2.6       Unemployment............................................................................................................................ 18
     2.7       Homelessness ............................................................................................................................ 19
     2.8       Disengaged young adults ......................................................................................................... 20
     2.9       Emergency relief or assistance ................................................................................................ 20
3. Physical health and wellbeing ......................................................................................... 21
     3.1       Self-reported physical health status ........................................................................................ 21
     3.2       Body weight ................................................................................................................................. 21
     3.3       Nutrition........................................................................................................................................ 22
     3.4       Physical activity .......................................................................................................................... 23
     3.5       Alcohol and drug use ................................................................................................................. 24
     3.6       Chronic disease and illness ...................................................................................................... 28
     3.7       Infectious diseases..................................................................................................................... 28
     3.8       Life expectancy and mortality ................................................................................................... 29
4. Mental health and wellbeing ............................................................................................. 31
     4.1       Self-reported mental health status ........................................................................................... 31
     4.2       Resilience and wellbeing ........................................................................................................... 31
     4.3       Young people and resilience .................................................................................................... 31

                                                                                                                                                                 1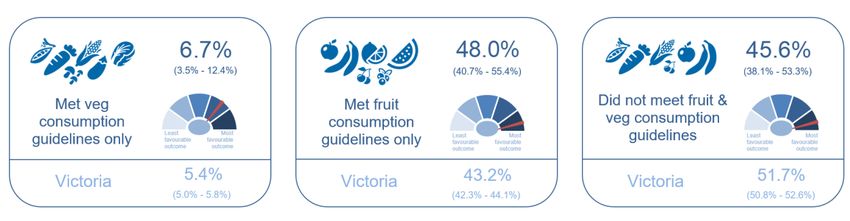
4.4       Volunteering and participation in community groups ............................................................ 32
   4.5       Community connectedness ...................................................................................................... 33
5. Preventative health ............................................................................................................ 33
   5.1       Immunisation ............................................................................................................................... 33
   5.2       Health screening and testing .................................................................................................... 34
6. Access to health services................................................................................................. 35
   6.1       Perception of access to health services ................................................................................. 35
   6.2       Use of Medicare-subsidised services...................................................................................... 36
   6.3       Participation in Maternal and Child Health Service ............................................................... 36
7. Community safety.............................................................................................................. 37
   7.1       Perception of safety ................................................................................................................... 37
   7.2       Criminal offences ........................................................................................................................ 38
   7.3       Anti-social behaviour ................................................................................................................. 39
   7.4       Family violence ........................................................................................................................... 40
8. Climate change .................................................................................................................. 41
Reference list ......................................................................................................................... 42

Note on Data Sources:

All data sourced was the most recent data available at the time of publication. Key Government
and peak body surveys on population health are published approximately two years following the
survey fieldwork. As a result, local government area health data is subject to significant ‘lag’ and
often does not align with the time period for the Municipal Public Health and Wellbeing Plan.

Please note the most recent available Census data was the 2016 Census, at time of publication.
In November 2020, Bayside City Council Commissioned Metropolis Research to conduct a
localised health and wellbeing survey with a representative sample of 400 residents.

                                                                                                                                                          2
Summary of key findings
In 2020, the global Coronavirus (COVID-19) pandemic had significant impacts on health and
wellbeing. The Bayside municipality, similar to that of the rest of Victoria lived
under strict social distancing legislation and recorded cases of the novel COVID-
19. It is anticipated that there will be ongoing health and wellbeing implications as
a result of COVID-19, in particular to those who are most vulnerable.
Bayside population characteristics
Bayside predominantly consists of families and lone older persons,
with the majority of residents Australian born. The municipality is
characterised by high income earners and tertiary qualified residents.
• A total population of 106,862 in 2019.
• 30% of residents aged 40-59 years.
• Ageing population with a high percentage of frail aged persons.
• Most common household type; couples with children (36.5%), followed by
couples without children (24.2%) and lone persons (23.3%).
• Majority of Australian-born residents (69.0%), however 12.1% of residents
born in a non-English speaking country. Greek, Italian and Russian are the
main non-English languages spoken, and a small but growing number of Mandarin speakers.
• 190 residents identified as Aboriginal or Torres Strait Islander in the 2016 Cenus.
• High income earners with 46.8% of the population earning $1,393 or more per
week.
• 39.1% of residents have tertiary qualification.
• Most popular employment type – Professionals (33.7%) and Managers (22.4%).
Vulnerable populations
There are areas of disadvantage in Bayside which include public housing estates, low income
earners and residents who hold pension concession cards. There are also many people who
have a disability and need assistance in their day-to-day lives.
• 2.9% of dwellings are public housing.
• 13.7% of households are low income households earning nil to $33,799 annually.
• 9% of Bayside residents live in poverty defined as ‘not having enough available income to
afford life’s necessities such as food, clothing and
healthcare’.
• 5, 689 residents have healthcare cards.
• 10,303 residents have pension concession cards.
• 3.7% unemployment rate.
• Over 13,923 people have a disability and 4,213 people need assistance in
their day-to-day lives because of a disability, long-term health condition or
old age.
3Physical health
The overall health status of residents in Bayside is very good with high life expectancy, high
levels of physical activity and lower than average chronic disease rates. However, sedentary
behaviour, obesity for males and risk of short-term harm from alcohol consumption are concerns.
• Life expectancy above Victorian average; 83 years male – 88 years female.
• 48.3% rated their physical health as excellent or very good.
• 42.3% of residents are considered overweight (pre-obese) or obese.
Males more likely than females to be considered overweight or obese.
• 79.1% of residents meet recommended fruit consumption per day.
• 61.3% of residents meet recommended vegetable consumption per day.
• 57.5% of babies 6 months old were breastfed. Fourth highest rate in southern metro region.
• 64.1% engage in physical activity four or more days per week. This is
higher than the Victorian average of 41.3%.
• 51.5% of residents sit for at least 5 hours or more per day.
• 45.7% of adult residents reported to have more than two standard alcoholic
drinks per day at least two to three times per week.
• Hospital admission for illicit drug use (mostly cocaine and cannabis) for
Bayside was at 37.5 per 10,000 people. Lower than Glen Eira (51.4 per 10,000 people) and
Port Phillip (51.9 per 10,000 people).
• Low smoking rates amongst males and females –9.8% are current
smokers in Bayside compared to the wider Metropolitan South Division
17.1% and Victoria 16.7%.
• Bayside has lower rates compared to Greater Melbourne and Victoria across all chronic
diseases and illnesses.
Mental health and wellbeing
• Bayside residents reported an average wellbeing score of 79.6 out of
100. This was higher than the Victorian average of 77.3.
• 83.2% of Bayside respondents rated their mental health as either
‘very good’ or ‘excellent’.
• Bayside residents reported an average resilience score of 6.62 out of
8.
• Young people in Bayside reported that they felt engaged in a club or sport group (90%), safe
and secure at school (92%), listened to by adults (89%), have not been bullied (93%) and
believe they can get on with people who are different from them (89%).
4• Areas of concern for Bayside youth include: feeling highly critical of themselves (33%), not
getting 8 hours sleep (26%), tendency to avoid their problems (26%), , and feeling nervous,
anxious and on edge (25%).
• 27.2% of residents reported volunteering regularly (once per month or more) and 36.7% of
residents reported volunteering sometimes (less than once per month).
• 69.1% of residents were satisfied with their community connections.
Multi-lingual speaking households rated satisfaction lower than
average and senior citizens rated satisfaction higher than the
average.
• 13.2% of residents reported feeling isolated and out of contact from others.
Preventative health and access to services
• Majority of Bayside residents (over 63%) reported to engage in screening
tests and examinations including blood pressure, cholesterol checks,
diabetes, breast screening, pap tests and skin checks.
• 93.3% of residents felt they had adequate access to local GP’s, dental services (89.1%) and
other medical health services such as physiotherapy, podiatry and psychologists (88.5%).
• In the 2019/20 year, the Bayside Maternal and Child Health service provided
8,685 child health consultations.
Community safety
• The majority of Bayside residents (96.1%) agreed that they felt safe
walking in the local area during the day, walking at night in the local
area (66.7%) and traveling on public transport during the day
(88.3%). Females and younger adults were most likely to feel
unsafe across all domains of activity.
• 5,386 criminal offences recorded in Bayside in 2019/2020, an increase of 11.2% from
previous year. In the 2019/20 year, the vast majority of offences in Bayside were classified
as crimes against property (69.1%). The remaining offences recorded in Bayside were
grouped into justice procedures (11.7%), crimes against the person (10.5%) and drug
offences (4.7%).
• 709 reported family violence incidents in Bayside in 2019/2020, this has stayed stable with
709 cases reported in 2018/2019. Compared to neighbouring local government areas,
Bayside had the lowest number of reported cases per 100,000 population (658.3) compared
to Glen Eira (662.7), Kingston (1013.8) and Port Phillip (1150.2).
51. The Bayside community
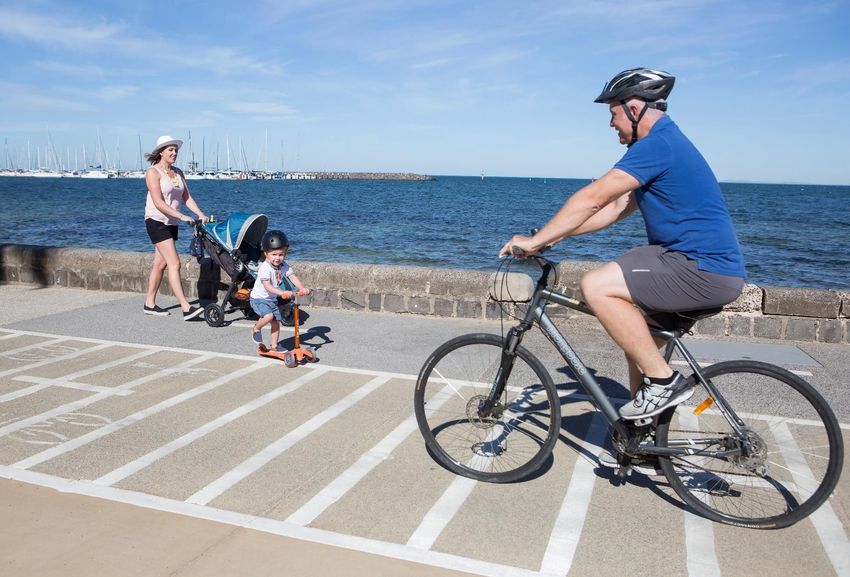
The City of Bayside is located 16 kilometres south-east of Melbourne along the coastline of Port
Phillip Bay. Bayside has a stunning foreshore, beautiful parks and open spaces, vibrant retail
centres and is considered one of Melbourne’s most attractive municipalities.
The City of Bayside is a leafy, predominately residential municipality and covers an area of 36
square kilometres. It incorporates the suburbs of Brighton, Brighton East, Hampton, Hampton East,
Sandringham, Black Rock, Beaumaris and parts of Highett and Cheltenham. The suburbs of Highett
and Cheltenham cross the City of Bayside boundary, into the City of Kingston. (1)
As part of the recent Bayside 2050 Community Vision consultation, residents identified the open
spaces and parkland, the beaches and foreshore and the tree-lined streets as the aspects of
Bayside they wished to retain into the future years. (2)
Map 1: City of Bayside municipality and suburbs
Source: Bayside City Council, 2020
1.1 Population
The estimated population of the City of Bayside was 106,862 people in June 2019, an increase of
1,117 persons (1.1%) from 2018.(1) Bayside has experienced an average annual growth of 1.2%
over the period from 2009 to 2019. Population growth (in terms of total numbers) occurred
predominately in the Brighton and the Sandringham-Black Rock statistical areas. The Cheltenham-
Highett West statistical area also experienced substantial growth, in percentage terms. (3)
Bayside’s population is forecast to grow steadily over the 2021-2025 period, increasing from 109,376
persons in 2021 to 113,427 persons, by the year 2025. Over this four-year period there will be an
estimated additional 1,933 households in the municipality. (4)
61.2 Age profile
In 2019, Bayside had a large group of residents who were aged between 40-49 years and 50-59
years, making up 30% of the total population. This is consistent with family households living in the
municipality, having a large group of parents aged 40-59 years (30%) and children aged 0-19 years
(25%). Like many Australian communities, Bayside is also an ageing community with 14% of
residents aged over 70 years. (5)
Chart 1: Population by Ten Year Age Cohorts, City of Bayside, 2019
15,794 15,655
14,993
11,861 12,115
11,015
10,532
8,743
6,154
0-9 yrs 10-19 yrs 20-29 yrs 30-39 yrs 40-49 yrs 50-59 yrs 60-69 yrs 70-79 yrs 80+ yrs
Source: Australian Bureau of Statistics, Regional Population by Age and Sex Australia, 2020
Bayside’s age profile differed significantly from the age profile across the Greater Melbourne area.
Greater Melbourne had much higher percentages of residents aged in their twenties, and thirties,
(32.5 per cent) compared to Bayside (20 per cent). Younger families with children tend to live in more
affordable areas of Greater Melbourne such as the urban fringe and outer suburbs. Bayside’s families
tend to be older with parents aged in their forties, with secondary school-aged children. Bayside had a
higher percentage of pre-retirees/retirees aged in their sixties and, elderly residents aged 80 years or
over. (5)
Chart 2: Population by Age Groups, City of Bayside and Greater Melbourne, 2019
Bayside Greater Melbourne
0-9 yrs 11.1%
12.5%
10-19 yrs 14.0%
11.5%
20-29 yrs 10.3%
16.6%
30-39 yrs 9.9%
16.3%
40-49 yrs 14.8%
13.1%
50-59 yrs 14.6%
11.4%
60-69 yrs 11.3%
8.9%
70-79 yrs 8.2%
6.1%
80+ yrs 5.8%
3.7%
Source: Australian Bureau of Statistics, Regional Population by Age and Sex Australia, 2020
7Over the 2021-2025 period, much of Bayside’s additional population growth will be of those aged in
their sixties and seventies with an additional 1,586 persons aged 60-79 years.(4)
1.3 Births and deaths
Births
Over the past decade birth notifications in Bayside have steadily decreased each financial year. In the
2019-2020 financial year there were 826 birth notifications in Bayside.(6) Births are forecast to steadily
increase over the 2021-2025 period, however this may change with the impact of the 2020 economic
recession yet to be factored explicitly into these assumptions.(4)
The average maternal age at birth for Bayside mothers has remained steady at 35 years. Bayside has
had only a small number of teenage mothers, on average five or fewer, each year.(7)
Deaths
The average number of deaths each year was 794 for the 2012-2019 period. In the 2019-calendar
year there was 849 death notifications in Bayside. Bayside had a standardised death rate of 4.3
deaths per 1,000 population, lower than the death rates for Glen Eira (4.4) and Kingston and Port
Phillip (4.7).(8)
1.4 Cultural diversity
Born overseas
Bayside residents were predominately Australian-born (69.0%). Overall, 25.3% of the Bayside
population was born overseas and 12.1% were from non-English speaking background countries.
Residents born overseas came primarily from the United Kingdom, China, New Zealand, South
Africa, the United States of America and India. (1)
Bayside residents who had arrived in Australia since 2006 were predominately from English-
speaking countries (United Kingdom, New Zealand, United States of America, South Africa and
Ireland); China and India. (15)
Eight out of ten Bayside residents spoke English only at home (80.2%)
and the main non-English languages spoken at home were Greek,
Mandarin, Russian and Italian. Over the 2011-2016 period there was a
substantial increase in the number and proportion of residents speaking
Mandarin. (1)
Migration
During the 2019 calendar year, the majority of migrants settling in Victoria came via the Skilled
migration stream (65.7%, primarily young adults), with the remainder entering via the Family stream
(27.9%) or Humanitarian stream (6.4%). For Bayside during this period, there was a higher
proportion of migrants entering via the Skilled migration stream (70.4%), 29.6% via the Family
stream and only a very small number of residents coming via the Humanitarian stream (0.7%).(9)
Religion
In 2016, 54.8% of Bayside residents nominated a religion (49.5% Christian, 5.3% non-Christian) and
36.0% said they had no religion. The largest single religion in Bayside was Catholic (22.7% of the
population). Compared to Greater Melbourne, there was smaller proportions of Bayside residents
who nominated Islam, Buddhism and Hinduism as their religion. (1)
1.5 Indigenous population
There were 190 persons in Bayside who identified themselves as indigenous, in the 2016
Census. This makes up 0.2% of the total population of Bayside. (1) Consistent with national
trends, the indigenous population of Bayside is younger than the non-indigenous population with
8larger proportions of children and young people, and a substantially smaller proportion of persons
aged 65 years and over. (10)
Chart 3: Indigenous Status by Age Group, City of Bayside, 2016
Non-Indigenous Aboriginal and/or Torres Strait Islander
19.0%
65 years+
8.5%
29.4%
45-64 years
30.2%
21.0%
25-44 years
22.2%
11.5%
15-24 years
14.8%
14.0%
5-14 years
19.6%
5.2%
0-4 years
6.3%
Source: Australian Bureau of Statistics 2016, Aboriginal and Torres Strait Islander Peoples Profile
1.6 Households
There were 36,784 households in Bayside counted at the 2016 Census, living in occupied private
dwellings. Unoccupied private dwellings and non-private dwellings such as nursing homes make up
the additional 4,300 other dwellings in Bayside. (1)
A total of 70% of Bayside’s households were family households (where family is defined as people
living in a private dwelling who are related by blood or marriage). The dominant household types
were couples with children, followed by older couples without children. Lone person households
comprised 23.3% of all Bayside households in 2016. (1)
Table 1: Household Types, City of Bayside, 2016
Greater
Bayside Bayside
Household Types Melbourne
No. %
%
Couples with children 13,432 36.5 33.5
Couples without children 8,903 24.2 22.9
Lone person 8,559 23.3 22.0
One parent families 3,109 8.5 10.1
Other households 1,744 4.7 5.4
Group household 742 2.0 4.7
Total 36,784 100 100
Source: id consulting pty ltd, City of Bayside Community Profile, 2020
Comparing the household and family types in the City of Bayside to those in Greater Melbourne,
Bayside had a higher proportion of couple families with child(ren) as well as a lower proportion of
group households and one-parent families. (1)
Over the period between 2011 and 2016, the size of the average Bayside household was virtually
stable, being 2.55 persons in 2011 and 2.53 persons in 2016. The expected decrease did not
eventuate as more adult children in their twenties were living at home with their parents, due to
housing affordability or as a transition period after overseas travel or renting. (11)
9Council’s population forecast for the 2021-2025 period estimates a large increase in the number of
couple (no children) households. There will also be an increase in the number of lone person
households. (4)
Bayside’s housing stock corresponds with the household types, with the majority of housing being
separate houses primarily occupied by families with children, and couples. In medium density housing
in Bayside (townhouses, units, two storey apartments), lone persons and couples
make up the majority of residents. Similarly, residents living in three or four storey
apartments in Bayside are mostly lone persons and couples. (12)
Based on 2016 Census data, 6.5% of Bayside households with mortgage
repayments were in ‘mortgage stress’ defined as having mortgage repayments
greater than or equal to 30% of household income. A higher percentage (8.0%) of
Bayside households were in ‘rental stress’ defined as having rent payments greater than or equal to
30% of household income. (13)
In Bayside a very small percentage (1.4%) of private dwellings were considered ‘over utilised’ in terms
of the number of bedrooms required, with the actual number of bedrooms in the dwelling. The majority
of dwellings in Bayside had spare bedrooms (80.3%) and the remaining 18.3% of dwellings had a
suitable number of bedrooms for the household size. (13)
1.7 Income
‘Equivalised’ household income puts all Bayside households on an equal footing, independent of the
household size and composition, to enable a true comparison between areas and over time. It is a
broad indicator of the income resource available to a household of standard size and is the best
measure of the changing economic fortunes of households living in the City of Bayside. (1)
The levels of household income in Bayside were clearly much higher than those
across Greater Melbourne, with nearly twice as many earning $1400 a week and a
substantially lower proportion in Bayside earning under $500 a week. Over the
2011-2016 period, the highest income quartile group increased in both number and
proportion. (1)
Table 2: Equivalised Household Income Groupings, City of Bayside, 2016
Greater
Income quartile Bayside
(weekly income) Melbourne
group %
%
Lowest group $0 to $494 15.4 23.1
Medium lowest $495 to $864 16.7 23.6
Medium highest $865 to $1,392 21.0 25.4
Highest group $1,393 and over 46.8 28.0
Source: id consulting pty ltd, City of Bayside Community Profile, 2020
In 2016 the median weekly household income for Bayside was $2,138 and for Greater Melbourne,
it was a much lower $1,539 per week. As expected, Brighton had the highest household income
and Hampton East, the lowest. (11)
10Chart 4: Median Household Income, City of Bayside suburbs, 2016
Brighton $2,440
Hampton $2,257
Beaumaris $2,218
Brighton East $2,174
Sandringham $2,167
Black Rock $2,121
Highett $1,714
Cheltenham $1,706
Hampton East $1,421
Source: id consulting pty ltd, City of Bayside Social Atlas, 2020
1.8 Education
In 2016, 60.0% of Bayside residents (aged 15 years or over) had some type of post-school
qualification – 39.1% had a Bachelor or higher degree, 10.7% had a Diploma qualification and a
further 10.3% had a vocational (Certificate level) qualification. (1)
Compared to residents across Greater Melbourne, Bayside residents were more
likely to have a Bachelor or Higher degrees (39.1% Bayside, 27.5% Greater
Melbourne). Fewer Bayside residents had vocational qualifications (10.3%
Bayside, 15.3% Greater Melbourne) or, no qualifications (31.4% Bayside, 38.6%
Greater Melbourne). (1)
The City of Bayside has 30 schools across the municipality and caters for over 17,800 students from
Preparatory (Foundation) to Year 12. Several independent schools also have early learning centres
and kindergarten is offered in community settings for three and four year old children. (14)
In the 2019 half of all students attending Bayside schools attended a government primary or
secondary school, 29.9% attended an independent school and 19.3% attended a Catholic primary or
secondary school. (14)
1.9 Unpaid child care
The Census of Population and Housing asks about unpaid care to children under the age of 15,
in the two weeks prior to the Census week. This Census topic covers parental care, grandparent
care and informal caring arrangements between friends or relatives but does not include elderly
parental care of an adult child with a disability.
Just under one-third (31%) of Bayside residents aged 15 years and over provided unpaid child care,
predominately for their own children (22%).(1) Care of grandchildren commenced primarily when the
carers were aged in their sixties. One in five Bayside adults aged in their sixties or seventies were
caring for grandchildren in an unpaid capacity.(15)
11Chart 5: Unpaid Child Care by Age Group, City of Bayside, 2016
Cared for other child/children (and own) Cared for own child/children
70+ yrs
60-69 yrs
50-59 yrs
40-49 yrs
30-39 yrs
15-29 yrs
0 2,000 4,000 6,000 8,000 10,000
Source: Australian Bureau of Statistics, 2016 Census TableBuilder Pro
1.10 Occupations and industries of employment
Occupation
In 2016 the three most popular broad occupational groupings of employed Bayside residents were
Professionals (33.7%), Managers (22.4%) and Clerical and Administrative Workers (12.8%).
The most common generic job titles for Bayside residents were: advertising/public relations and sales
managers, chief executives/managing directors, accountants, retail managers, management and
organisation analysts, general clerks, advertising and marketing professionals, secondary school
teachers and general managers. (1)
Compared to residents across Greater Melbourne, Bayside residents were more likely to be working
as Managers and Professionals, and less likely to be Technicians/Trades Workers or Labourers. (1)
Industries
Residents of Bayside who also work in Bayside, made up 26.0% of employed residents in 2016.
Nearly a quarter (23.6%) of employed Bayside residents commute to offices located in Melbourne’s
central business district.(1) In addition to working primarily in ‘white-collar’ desk jobs, these Bayside
residents would also be likely to be commuting by car or train leading to many weekday hours spent
sitting or largely inactive.
As mainly ‘white-collar’ workers, Bayside residents were employed in these broad industry groupings
- Professional, Scientific and Technical Services (14.9%), Health Care and Social Assistance
(11.4%) and Education and Training (9.9%).(1) Bayside has a number of private and public hospitals
in the area, and a relatively large number of independent schools.
122. Vulnerable populations
2.1 Relative disadvantage in Bayside neighbourhoods
Disadvantage is a complex issue at a community level, arising from the social, economic and health
status of those individuals who reside in that local area. One summary measure of disadvantage
used to describe and compare communities is the Index of Relative Socio-economic Disadvantage,
published by the Australian Bureau of Statistics. A high score on the Index reflects a relative lack of
disadvantage rather than relative advantage.
In 2016, the City of Bayside had an Index of Relative Socio-economic Disadvantage score of 1097,
the second highest score of all Victorian local government areas. The high Bayside score indicates
that, overall, the municipality had a relative lack of disadvantage when compared to most other local
government areas in Victoria, and to metropolitan Melbourne.(1)
However, there are some important differences within the Bayside suburbs and local
neighbourhoods, with some pockets of Bayside having relatively low scores (a higher level of
disadvantage). The 2016 index scores show that Hampton East was the most disadvantaged
suburb in Bayside and, that the neighbourhoods with low scores closely matched the locations of
Bayside’s larger public housing estates.(1)
Appendix 1 shows a thematic map of the 2016 index scores for Bayside’s small neighbourhoods with
the dark red shaded areas representing the relatively low score (a higher level of disadvantage)
neighbourhoods which are public housing estates located in Hampton East, Brighton, Sandringham
and Highett. (16)
2.2 People with a disability and carers
Disability is a difficult concept to measure. The Australian Bureau of Statistics
conducts a national household sample survey which provides detailed
information at state and national levels. Modelled estimates of disability for local
government areas have been calculated using data collected in the 2018
National Survey of Disability, Ageing and Carers.
Across all age groups the proportion of Victorian persons with a disability was 17.0%. Rates of
disability in Victoria were strongly related to age group, with rates increasing as age increased. Older
adults become more susceptible to conditions or restrictions such as dementia, eye cataracts, hearing
impairment, heart disease, arthritis and osteoporosis. Some gender differences were apparent for
specific age groups – males aged 5-14 years and males aged 80-84 years had higher rates of
disability than females of the same age. (17)
For Bayside, the modelled estimates show that 13,926 persons had a disability (as defined by the
survey), which represents 13.3% of the population. It should be noted that this 13.3% is an estimate,
with the true percentage lying between 11.4% and 15.3%. (17)
Table 3: Estimates of Disability, City of Bayside, 2018
Age Group Males Males Females Females
No. %
(years) No. % No. %
0–14 626 6.3 367 3.7 993 5.0
15–24 473 7.3 434 7.1 907 7.3
25–34 231 5.2 237 4.9 468 5.0
35–44 297 4.9 457 6.5 754 5.7
45–54 677 8.6 878 9.8 1,555 9.3
55–64 1,029 15.4 1,150 16.0 2,179 15.7
65+ 3,094 35.8 3,908 38.1 7,002 37.1
TOTAL 6,427 12.8 7,431 13.7 13,858 13.3
13Source: Australian Bureau of Statistics, Modelled estimates of indicators from the 2018 Survey of Disability, Ageing and Carers for
Local Government Areas
Table 4: Estimates of Disability by Degree of Limitation, City of Bayside, 2018
Persons with Persons with
Age Group profound-severe moderate-mild
(years) core activity limitation core activity limitation
No. % No. %
0–14 751 3.8 206 1.0
15–24 400 3.2 254 2.0
25–34 133 1.4 163 1.7
35–44 165 1.3 360 2.7
45–54 363 2.2 790 4.7
55–64 511 3.7 1,200 8.6
65+ 2,061 10.9 4,067 21.5
TOTAL 4,389 4.2 7,018 6.7
Source: Australian Bureau of Statistics, Modelled estimates of indicators from the 2018 Survey of Disability, Ageing and Carers for
Local Government Areas
Chart 6: Number of Persons with a Disability by Age Group and Sex, City of Bayside, 2018
Males Females
8,000
7,000
6,000
5,000
4,000
3,000
2,000
1,000
0
0–14 15–24 25–34 35–44 45–54 55–64 65+
Age Group (years)
Source: Australian Bureau of Statistics, Modelled estimates of indicators from the 2018 Survey of Disability, Ageing and Carers for Local
Government Areas
The modelled estimates for Bayside show that 12,026 persons were caring for a person with a
disability (as defined by the survey), which represents 11.5% of the population. It should be noted
that this 11.5% is an estimate, with the true percentage lying between 9.0% and 13.9%. Overall,
there was a higher percentage of female carers (13.9% compared to 9.9% of males) and the
predominant carer age group was those aged 55-64 years.
14Chart 7: Percentage of Carers by Age Group and Sex, City of Bayside, 2018
Males Females
45
40
35
Percentage of population
30 24.4
16.8
25
20.8
20
15
11.9
10 7.6
6.1 17.2 18.2
13.3
5
6.1 6.9 7.1
0
0–14 15–24 25–34 35–44 45–54 55–64 65+
Age Group (years)
Source: Australian Bureau of Statistics, Modelled estimates of indicators from the 2018 Survey of Disability, Ageing and Carers for Local
Government Areas
In the last three annual Council surveys, residents have self-reported if anyone in the household
had a permanent or long-term disability – on average about 8% of Bayside residents said that a
household member had a disability. This survey research is conducted only with private dwellings
so does not access residents living in group housing or aged care. (18)
Need for Assistance measure
In addition, the five-yearly Census of Population and Housing asks Australian residents to
indicate their ‘need for assistance’ which is a proxy measure of disability. Self-assessment of
one’s need for assistance is problematic due to the subjective nature of perception of ability or
difficulty, and under-reporting due to social stigma or reporting of conditions that are episodic or
seasonal.
In the 2016 Census 4,213 people living in Bayside (4.3% of the population) reported that they
needed assistance in their day-to-day lives because of a disability, long-term health condition or
old age. Again, there was a clear relationship between disability and age, with 6.3% of 70-74
year olds needing assistance, 11.9% of 75-79 year olds and 21.4% of 80-84 year olds. (1)
2.3 Low income households
Using 2016 Census data, a household was defined as a ‘low income’
household if the combined gross income was less than $650 per week
(less than $33,799 per year). The amount of income a household
generates is linked to a number of factors, such as the number of workers
in the household, the percentage of people unemployed or on other
income support benefits and the type of employment undertaken by the
household members.
15Bayside had a smaller percentage of low income households, compared to Greater Melbourne.
Of the nine Bayside suburbs, Hampton East and Highett had the highest percentages of low
income households. Nearly one in four Hampton East households were low income households
(22.7 per cent). (1)
Chart 8: Percentage of low income households, City of Bayside suburbs and greater Melbourne,
2016
Hampton East 22.7
GRTR MELBOURNE 16.7
Highett 16.5
Cheltenham 14.4
CITY OF BAYSIDE 13.7
Brighton East 13.1
Black Rock 13.1
Hampton 12.4
Sandringham 12.2
Brighton 11.5
Beaumaris 10.9
% of low income households
Source: id consulting pty ltd, City of Bayside Community Profile, 2020
Estimates of Poverty
Research undertaken by the National Centre for Social and Economic Modelling (NATSEM),
commissioned by the Victorian Council of Social Services (VCOSS), has calculated estimated
poverty rates for local areas. The report defines poverty as “not having enough available income
to afford life’s necessities” such as food, clothing or healthcare. Across Victoria’s neighbourhood
areas most poverty rates are between 10 and 20%, with Beaumaris having the lowest rate (6%)
and Carlton the highest (40%). (19)
This research estimated that 7,500 (9%) of Bayside residents live in poverty, with the following
characteristics:
• women comprise the majority of Bayside adults living in poverty (57%)
• about a third of Bayside adults living in poverty have a disability (31%)
• 21% of all Bayside residents living in poverty were aged 65 years and over
• a quarter of Bayside adults living in poverty have a job – either part-time or full-time (26%)
• half of Bayside adults living in poverty were in owner-occupied homes (49%) – either owned
outright or mortgaged
• 42% of Bayside adults living in poverty live in families with dependent
children. (19)
16Table 5: Poverty estimates, City of Bayside and Statistical Area 2, 2015-16
Estimated No.
Geographic Area Poverty Rate of Persons*
City of Bayside 9% 7,500
▪ Beaumaris 6% 700
▪ Brighton 9% 1,500
▪ Brighton East 9% 1,100
▪ Cheltenham - Highett (West) 11% 900
▪ Hampton 10% 1,400
▪ Sandringham - Black Rock 7% 900
Greater Melbourne 12.6%
Victoria 13.2%
* rounded to nearest 100 people
Source: NATSEM, Institute for Governance and Policy Analysis (IGPA), University of Canberra.
2.4 Social and public housing
The majority of Bayside households are either homeowners (39.1%) or purchasing their own
home (31.6%). House prices and rental costs are high, with very little housing that is affordable to
lower income households. It is estimated that 1, 297 households in Bayside have an unmet need
for affordable housing - this represents 3.6% of all households. Of those households in need of
affordable housing, lone persons are the largest group in need (549 households), followed by
family households (390 households). (12)
There were 1,179 Director-owned (Victorian Government) and community-owned social housing
dwellings in Bayside as at June 2019. This represents 2.9% of Bayside’s private dwelling stock,
which is below the Melbourne metropolitan average of 3.2%. More than half of the public housing
dwellings are clustered in seven main housing estates comprising low-rise flats or medium
density blocks of flats. The remainder are scattered throughout the municipality in a variety of
housing forms. Following the closure of the New Street estate for redevelopment, the number of
available dwellings in 2020 would be approximately 1,052. (20)
The neighbouring municipalities of Port Phillip (7.0%) and Stonnington (3.4%) had a higher
proportion of public and community housing dwellings compared to Bayside, with several of their
suburbs having large high-rise estates in South Melbourne, St Kilda, Windsor and Prahran. (20)
2.5 Income support recipients
The COVID-19 pandemic has had an impact on the number and type of income support
recipients in Bayside.
JobSeeker Payment
JobSeeker is currently the main income support payment for people (aged 22 years up to pension
age) who have capacity to work now or in the near future, including people looking for work, who
temporarily cannot work or study because of an injury or illness. JobSeeker rates are a good
measure of socio-economic disadvantage in an area, providing an indication of suburbs most
affected by the impacts of COVID-19 containment measures. (1)
From late March 2020, JobSeeker Payment replaced Newstart Allowance, Bereavement
Allowance and Sickness Allowance. Table 6 shows the percentage of the local population aged
15-64 years who were eligible recipients of JobSeeker, or Youth Allowance. (1)
17Table 6: Percentage of Eligible Recipients of JobSeeker and Youth Allowances, City of
Bayside and Statistical Area 2, March – September quarters 2020
September June March
Geographic Area 2020 2020 2020
% % %
City of Bayside 4.9 4.9 1.6
▪ Beaumaris 4.2 4.4 1.0
▪ Brighton 4.0 3.9 0.9
▪ Brighton East 4.7 4.7 1.7
▪ Cheltenham - Highett (West) 6.8 6.8 2.7
▪ Hampton 5.5 5.6 2.3
▪ Sandringham - Black Rock 5.1 5.0 1.6
Greater Melbourne 8.7 8.4 3.9
Victoria 9.2 9.0 4.5
Source: id consulting pty ltd, City of Bayside Community Profile, 2020
Other Pensions and Benefits
The pensions and benefits with the highest number of recipients in Bayside,
as at June 2020, are listed in Table 7 below. (21)
Table 7: Income Support Recipients, City of Bayside, June 2020
quarter
Pension/Benefit No.
Age Pension 6,975
Family Tax Benefit A (assists with cost of children, income test) 1,823
Disability Support Pension 1,516
Family Tax Benefit B (assists single parents and some couples, income test) 1,451
Carer Payment (income support payment for constant carers) 322
Parenting Payment - Single 228
Concession Cards, Supplements and Allowances
Pension Concession Card (cheaper health care, medicines, some discounts) 10,303
Commonwealth Seniors Health Card (cheaper health care, some discounts) 3,466
Health Care Card (cheaper health care, medicines) 5,689
Commonwealth Rent Assistance (supplement payment for renters) 2,700
Carer Allowance (supplement payment for constant carers) 1,161
Low Income Card (cheaper health care, medicines) 682
Youth Allowance - students and apprentices 953
Source: Department of Social Security, June 2020
2.6 Unemployment
Over the past few calendar years, the quarterly unemployment rate had steadily decreased from an
average of 3.4% in 2017, to 3.1% in 2018 and 2.8% in 2019. It is expected that the COVID-19
pandemic will reverse this past trend, following the March 2020 rate of 3.0% and the June 2020 rate of
3.7%. (22)
Within the Bayside municipality, the June 2020 unemployment rate was highest in Cheltenham -
Highett West (5.8%) and Hampton (5.2%). Brighton had the lowest unemployment rate of 2.3%. (22)
18Chart 9: Unemployment Rate (%), City of Bayside Statistical Areas 2, June 2020 quarter
Cheltenham - Highett (West) 5.8
Hampton 5.2
Sandringham - Black Rock 3.7
Brighton East 3.4
Beaumaris 2.5
Brighton 2.3
Source: Department of Education, Skills and Employment, 2020
In comparison to the neighbouring local government areas, Bayside’s June 2020 unemployment
rate was relatively low - Kingston had an unemployment rate of 5.6%, Port Phillip 4.9% and Glen
Eira 4.2%. (22)
2.7 Homelessness
The Australian Bureau of Statistics defines homelessness broadly, not just as the visible persons
sleeping rough in public places. Their definition covers:
• persons living in improvised dwellings, tents, or sleeping out;
• persons in supported accommodation for the homeless;
• persons staying temporarily with other households (eg couch surfing);
• persons living in boarding houses;
• persons in other temporary lodgings; and
• persons living in 'severely' crowded dwellings. (23)
These homelessness figures are estimates only, derived from answers to Census questions.
For Bayside it was estimated that 167 persons were classified as being homeless on Census
night. Figures for Bayside have actually decreased since this figure was last estimated in 2011
(then 212 persons), despite population growth over those five years. This trend contrasts with the
national trend of increasing homelessness over the last decade.
Of these 167 persons, many were living in supported accommodation for the homeless (90
persons), staying temporarily with other households (40 persons) or were living in boarding
houses (21 persons). In addition 35 people in Bayside were living in other crowded dwellings and
as such, were estimated to be at risk of homelessness. (23)
Looking at these estimates on a per capita basis1, the rate for Bayside was 17 homeless persons
per 10,000 persons. This rate is substantially lower than the rates for Kingston (29 homeless
persons), Glen Eira (35) and Port Phillip (112).
Specialist Homelessness Services
Nearly 500 Bayside clients (488) were assisted by Specialist Homelessness Services agencies in
2018/19. This client number has decreased steadily in the past five years, from 712 clients in
2014/15 to 488 in 2018/19. Bayside clients were from a wide range of age groups, similar to the
1 Per capita rates calculated by Bayside City Council using ABS data
19proportions in the general community. A consistent trend for Bayside over the past five years has
been the gender differences. In 2018/19 62.9% of the Bayside clients were female, a slightly
higher proportion than observed Australia-wide. Specialist Homelessness Services clients were
more likely to have been originally residing in the Hampton-Hampton East areas, and the western
portion of Cheltenham-Highett. (40)
2.8 Disengaged young adults
The City of Bayside Community Profile provides an estimate of “engagement”/“disengagement” by
looking at both employment and education participation as measured in the 2016 Census. A person
who is employed full-time, or studying full-time, would be considered "Fully engaged". Part-time
students may be fully engaged if they are also employed, or partly engaged if they are not working.
In 2016, only 4.1% of the 15 to 24 year olds in Bayside were disengaged with employment or
education, compared to 7.5% across Greater Melbourne. (1)
Chart 10: Engagement in Education and Employment by 15-24 year olds, City of Bayside, 2016
Partially
engaged
Fully engaged
8%
84%
Disengaged
4%
Undetermined
4%
Source: id consulting pty ltd, City of Bayside Community Profile, 2020
2.9 Emergency relief or assistance
In the 2020 Bayside Health and Wellbeing Survey, residents were asked if any members of their
household had needed emergency relief or assistance in the last 12 months. Emergency relief or
assistance included food vouchers/packages, short term cash loans/grants and accommodation
relief. Only 2% of respondents identified members of their household needing emergency relief or
assistance in the last 12 months. (26)
Bayside Community Information and Support Services (BayCISS), is a not-for-profit community
organisation that provides a range of emergency relief and assistant services for Bayside community
members experiencing hardship including food assistance, utility and transport assistance, medical
expenses, housing support and counselling.
In the 2019/2020 financial year, BayCISS had 2235 Bayside residents present for emergency relief.
Reasons for seeking emergency relief included;
• 50% requiring food assistance due to financial hardship;
• 20% utility and transport assistance;
• 10% excessive medical expenses;
• 15% housing issues including homelessness, rent payments, loan repayments,
relocation; and
20• 9% financial issues including low income, no income, loss of income due to COVID.(44)
*Please note the above figures will not add up to 100% as many residents has multiple reasons for
seeking assistance.
Household type of those seeking emergency relief in Bayside comprised of residents living in public
housing (55%), those experiencing homelessness (21%), private rental (15%), home owners (2%)
and shared housing (2%). Majority of residents (90%) accessing services were also receiving
government payments or allowances.(44)
3. Physical health and wellbeing
3.1 Self-reported physical health status
Adult Physical Health
The 2017 Victorian Population Health Survey published data about local residents’ self-reported
physical health status. Nearly half of Bayside residents (48.3%) rated their health as excellent or
very good, slightly higher for Bayside females (50.5%). Only 10.8% of Bayside females and 11.5% of
Bayside males rated their health as “fair/poor”, both statistically significant differences compared to
the Victorian results. (27)
In the 2020 Bayside Health and Wellbeing Survey, adult residents were asked to rate their level
of physical health on a five-point scale of poor to excellent. The majority of Bayside residents
rated their physical health as ‘very good’ to ‘excellent’ (80.4%). This was higher than 2016, where
65% of residents rated their physical health as ‘very good’ or ‘excellent’. (26)
Children’s Physical Health
Data from the School Entrant Health Questionnaire (SEHQ) provides some insight into parents’
concerns and observations about their child’s health and wellbeing as they begin primary school
(Preparatory grade) in Victoria. Parents are asked to comment on whether their child’s general
health. In 2019, 78.7% of Prep. children in Bayside reported to be in excellent or very good
health as perceived by their parents. This result is consistent with results from previous years
(78-79%).(25)
3.2 Body weight
The 2017 Victorian Population Health Survey is the most recent
published dataset about the self-reported body weight of Bayside
residents. A total of 42.3% of residents in Bayside were considered
overweight (pre-obese) or obese, based on their reported height and
weight. The percentage of all Bayside adults in the pre-obese and
obese groupings in 2017 was consistent with the previous survey
results in 2014. (27)
Bayside females were more likely to be in the normal weight range (significantly higher than the
Victorian rates for females). Bayside females were less likely to be in the obese weight range
(significantly lower than the Victorian rates for females). For Bayside males, there was a very
different pattern. The largest body mass index grouping for Bayside males was “pre-obese” or
overweight (43.0%), with a smaller percentage of males considered “obese” (14.4% but a small
sample). (27)
Table 8: Reported Body Mass Index by Gender, City of Bayside, 2017
Underweight Normal Range Pre-obese Obese
Gender
(BMI < 18.5) (18.5 -Men - 36.3% 43.0% 14.4%*
Women 1.7%* 57.7% 23.3% 8.2%
Persons 1.8%* 47.8% 32.6% 10.6%
Source: Victorian Population Health Survey, 2017
* small sample size
3.3 Nutrition
Fruit and vegetable consumption
The 2017 Victorian Population Health Survey published data about local residents’ self-reported
consumption of fruit and vegetables and the infographic below shows these results.
The basic nutrition guideline is five serves of vegetables a day and two serves of fruit per day. A
substantially higher percentage of Bayside females (56.0%) were meeting the fruit consumption
guidelines, compared to Bayside males (40.2%). A gender comparison of vegetable consumption
was not available due to small sample sizes. (27)
Chart 11: Self-reported Fruit and Vegetable Consumption, City of Bayside, 2017
Source: Victorian Population Health Survey, 2017
In the 2020 Bayside Health and Wellbeing Survey, adult residents were asked to about their
consumption of fruit and vegetables. The majority of residents (79.1%) reported consuming at
least two serves of fruit per day and meeting the nutritional guidelines. Young adults (18 years to
34 years) were the mostly likely to meet the fruit guidelines (94.8%) compared to middle aged
adults (35 years to 54 years) who were the least likely (71%).There was no gender difference in
fruit consumption (26).
61.3% of adult residents also reported meeting the nutritional guidelines for vegetable
consumption of five serves per day. This had increased from 52.4% in 2016. Women were more
likely to consume five or more vegetables per day compared to males, 67.2% to 55.2 and multi-
lingual households were more likely to meet nutritional guidelines than only English speaking
households, 71.6% to 58.8% (26).
Soft drink consumption
Soft drink consumption is also an important indicator of a healthy diet, with high levels of
consumption being associated with weight gain, Type 2 diabetes and dental caries. The 2020
Bayside Health and Wellbeing Survey showed that majority (77%) of adult residents reported
drinking zero glasses or cans of soft drink, cordial, flavoured mineral water, energy drinks or
sports drinks per day whilst 17.9% reported drinking one to two glasses per day (26).
Breastfeeding
22As at June 2020, 57.5% of babies six months old were breastfed (fully and partly breastfed) with
27.1% of babies being fully breastfed and 30.4% partly breastfed. It should be noted
that the State Government definition of ‘fully breastfed’ means babies who are solely
breastfed, with no solid foods.
Over the past five financial years, the percentage of babies in Bayside fully breastfed
at six months has slowly decreased however the percentage of Bayside babies partly
breastfed has increased. (6)
Chart 12: Breastfeeding Rates at Key Ages, City of Bayside, 2019/20
Fully breastfed Partly breastfed
10.3%
9.7% 12.0%
30.4%
78.1%
66.7% 65.8%
27.1%
On Discharge At 2 weeks At 3 months At 6 months
Source: Bayside City Council, 2020
3.4 Physical activity
The 2017 Victorian Population Health Survey published data about local residents’ physical activity
levels, in accordance with set guidelines on the minimum number of sessions per week and the
intensity of sessions. The infographic below shows these results for Bayside residents. Overall
64.1% of Bayside residents met the physical activity guidelines, which was significantly higher than
the Victorian rate. Bayside males were more likely to have met the physical activity guidelines.
Correspondingly 34.5% of Bayside residents did insufficient physical activity as defined by the
guidelines, which was significantly lower than the Victorian rate. (27)
Chart 13: Self-reported Physical Activity Levels, City of Bayside, 2017
Source: Victorian Population Health Survey, 2017
23In the 2020 Bayside Health and Wellbeing Survey, adult residents were asked
how many times per week they usually did thirty minutes or more of moderate
physical activity. Results showed that more than half of respondents (67.5%)
engaged in 30 minutes or more of moderate physical activity four to five times
per week. This was higher than in 2016 with 52.8% of respondents engaging in
30 minutes or more of moderate physical activity, four to five times per week.
Only 1.8% reported doing no physical activity at all (26).
There was no gender differences in physcial activity levels. However those aged over 75 years
were significantly less likely to do two or three sessions of moderate physical activity per week (26).
Sedentary behaviour
In the 2020 Bayside Health and Wellbeing Survey, adult residents were asked about sitting at work,
including meal and snack breaks, and time spent sitting at a desk. Majority of residents (51.5%)
reported sitting for 5 hours or more per day. (26) Sitting for more than 5 hours or more per day can be
linked to adverse health and wellbeing outcomes such as type 2 diabetes and cardiovascular
disease.
Active Travel
A substantial percentage of Bayside residents who are employed, work outside the
municipality (70.8%) with the largest group working in the City of Melbourne area.
Given these commuting distances, it is understandable that most (60.4%) employed
people travelled to work in a private car, 16.3% took public transport and only 3.8%
rode a bike (1.5%) or walked (2.3%). A further 7.9% of employed Bayside residents
worked at home. (1)
Active travel for short trips to local shops and other destinations within one kilometre from home,
was more common with 60.7% of Bayside residents reporting they walked, 7.8% cycled and
30.4% travelled by car. (18)
3.5 Alcohol and drug use
Alcohol consumption by adults
The National Health and Medical Research Council’s (NHMRC) Australian guidelines to reduce
health risks from drinking alcohol recommend drinking no more than two standard drinks on any day
(to reduce the ‘lifetime risk’ of harm from alcohol-related disease and injury) and drinking no more
than four standard drinks on a single occasion (to reduce the risk of alcohol-related injury). These
2009 guidelines were updated by the NHMRC in 2020 as follows:
“To reduce the risk of harm from alcohol-related disease or injury, healthy men and women should
drink no more than 10 standard drinks a week and no more than 4 standard drinks on any one day.
The less you drink, the lower your risk of harm from alcohol.” (28)
However the Annual alcohol poll: Attitudes and behaviours reports produced by the Foundation
for Alcohol Research and Education have repeatedly shown that the majority of Australians
remain confused about low- and high-risk alcohol consumption, and have low
awareness and understanding of the health guidelines.
Past sample surveys of Bayside adults have shown that reported alcohol use was
significantly higher in Bayside, compared to Victorian levels – both consumption
that leads to long-term health risks and, occasional binge drinking (significantly
increasing their risk of injury). (27)
In the 2020 Bayside Health and Wellbeing Survey, adult residents were asked how often they drink
more than two standards alcoholic drinks per day. Many residents (45.7%) reported two to three
times per week, or once per week. Only a few (10.5%) reported drinking more than two standards
drinks per day every day or, almost every day. (26)
24You can also read


