BELIZE RIGHT CHOICES BRIGHT FUTURE - Systematic Country Diagnostic - World Bank Group
←
→
Page content transcription
If your browser does not render page correctly, please read the page content below
Public Disclosure Authorized   Public Disclosure Authorized   Public Disclosure Authorized                                    Public Disclosure Authorized

                                                                   Francisco Carneiro
                                                                                                              RIGHT CHOICES
                                                                                                              BRIGHT FUTURE
                                                                                        Systematic Country Diagnostic
                                                                                                                        BELIZE
BELIZE
RIGHT CHOICES
BRIGHT FUTURE
Systematic Country Diagnostic

Francisco Carneiro

                          January 2016
2     Belize—Right Choices Bright Future

ABBREVIATIONS AND ACRONYMS

ACP           Africa Caribbean Pacific                   CZMAI      Coastal Zone Management Authority
AML/CFT       Anti-Money Laundering and Combating                   and Institute
              the Financing of Terrorism                 DMSP-OLS Operational Lines scan System
ANS           Adjusted Net Savings                       DRM        Disaster Risk Management
API           American Petroleum Industry                ECLAC      Economic Commission for Latin America
ASR           American Sugar Refining                               and the Caribbean

BOOST         Building Opportunities for Our Social      ECCU       Eastern Caribbean Currency Union
              Transformation                             EIRR       Economic Internal Rate of Return
BPO           Business Process Outsourcing               EMBI       Emerging Market Bond Index
BNE           Belize Natural Energy                      EM-DAT     International Emergency Disasters
BCRIP         Belize Climate Resilience Infrastructure              Database
              Project                                    EPI        Environmental Performance Index
BZ$           Belize Dollar                              EPPR       Emergency Prevention, Preparedness
CAGR          Compound Annual Growth Rate                           and Response

CCT           Conditional Cash Transfer                  EU         European Union

CEDLAS/       Centro de Estudios Distributivos           FATF       Financial Action Task Force
SEDLAC        Laborales y Sociales / Socio-Economic      FDI        Foreign Direct Investment
              Database for Latin America and the         GDP        Gross Domestic Product
              Caribbean
                                                         GFDRR      Global Facility for Disaster Recovery
CIA           Central Intelligence Agency                           and Reconstruction
CID           Center for International Development       GIS        Geographic Information System
Systematic Country Diagnostic 3

GNI     Gross National Income                   NGO         Non-Governmental Organization
GNS     Gross National Saving                   NTL         Night Time Lights
GTAP    Global Trade Analysis Project           NPLs        Non-performing Loans
GVC     Global Value Chain                      NRCP        National climate Resilient Investment
HBS     Household Budget Survey                             Plan

HHI     Hirshman-Herfindhal Index               OECD        Organization for Economic Co-operation
                                                            and Development
HRV     The Hausmann-Rodrik-Velasco
        Framework                               POVCALNET Online Poverty Analysis Tool

HS      Harmonized System                       SAM         Social Accounting Matrix

IADB    Inter-American Development Bank         SATIIM      Punta Gorda Belize Non-Profit
                                                            Organisation
IBRD    International Bank for Reconstruction
        and Development                         SCD         Systematic Country Diagnostic

ICT     Information Communication Technology    SIDS        Small Island Developing States

ICHR    Inter-American Commission on            SMEs        Small and Medium Enterprises
        Human Rights                            SNA         Standard National Accounts
IDB     International Development Bank          SEDLAS      Socio-Economic Database for Latin
IFC     International Finance Cooperation                   America and the Caribbean

IFS     International Financial Statistics      System-     System Generalized Method-of-
                                                GMM         Moment
IMF     International Monetary Fund
                                                UN-      United Nations Commodity Trade
ISIC    International Standard Industrial       COMTRADE Statistics Database
        Classification
                                                UNDP        United Nations Development Program
LAC     Latin American and the Caribbean
                                                UN-ECLACC United Nations Economic Commission for
LACEX   Labor Content of Exports                          Latin America and the Caribbean
LDC     Least Developed Countries               UNFCCC      United Nations Framework Convention
LMI     Low and Middle income Countries                     on Climate Change
LFS     Labor Force Survey                      UNODC       United Nations Office on Drugs and Crime
MCE     Multi-criteria Evaluation               UNSD        United Nations Statistics Division
MDGs    Millennium Development Goals            UNICEF      United Nations Children’s Fund
MIC     Middle Income Countries                 UNWTO       United Nations World Tourism
                                                            Organization
MICS    Multiple Indicator Cluster Survey
                                                USA         United States of America
MIGA    Multilateral Investment Guarantee
        Agency                                  WDI         World Development Indicators
NCRIP   National Climate Resilient Investment   WEF         World Economic Forum
        Plan                                    WHO         World Health Organization
NBB     National Bank of Belize                 WITS        World Integrated Trade Solution
NEMO    National Emergency Management           WWF         World Wildlife Fund
        Organization (Belize)
4    Belize—Right Choices Bright Future

CONTENTS

Acknowledgments                                          6    Boxes
Overview                                                  7   Box 1: Knowledge and Data Gaps on Poverty Limit
    The Process                                          11     a More Thorough Analysis of Poverty Dynamics         23
    A Caveat                                             12   Box 2: Knowledge Gap—Limited Availability of
                                                                Labor Force Data to Measure Public-private
Country Context                                          13
                                                                Wage Differentials                                   43
Poverty and Shared Prosperity                            19
                                                              Box 3: Knowledge Gap—The Effect of Remittances
    Growth Performance—Stop and Go                       22     on Reservation Wages                                 44
    Growth Determinants                                  32   Box 4: Potential Responses to Migration and
    Emerging Focus Areas from the                               Unemployment Phenomenon                              46
     Comparative Methods                                36    Box 5: The World Bank’s Adjustment Net Savings
    Policy Areas that Could Boost Growth                 37     Indicator                                            60
Inclusiveness                                           39    Box 6: Indigenous Peoples in Belize Have Used
    Labor Market Outcomes Vary by                               the Court System to Assert their Land Rights         68
     Gender and Ethnicity                               40
    Unemployment: Frictional and Structural             40    Tables
    Are Workers Cueing for Jobs in the Public Sector?    42   Table 1: Select Socio-Economic Indicators for Belize
    Migrants Are Not to Blame                            43     and LAC                                              14
    Labor Content of Exports and Sector Linkages         47   Table 2: Where is the Wealth of Belize?                17
    Export Growth Could Boost Share Prosperity           48   Table 3: Urban and Rural Poverty rates (% poor),
                                                                2002–2009                                            21
    Policy Areas to Boost Inclusion                      51
                                                              Table 4: Poverty by Ethnicity, 2002–2009               22
Sustainability Challenges                               54
                                                              Table 5: Poverty by Gender, 2009 (% of Age Group)      22
    Factors that May Affect the Sustainability
     of Growth                                           54   Table 6: Emerging Focus Areas to Enhance Growth        37
    Factors that May Affect Environmental                     Table 7: Macroeconomic Trends and Projections          55
     Sustainability                                     60    Table 8: Housing characteristics in 2009               66
    Factors that May Affect Social Sustainability       66    Table 9: Benefit Levels (Bz$) for Compliance with
Synthesis and Priorities                                 73     Education co-responsibility, differentiated by
                                                                Grade and Sex                                        72
    Why Hasn’t Belize Developed Faster?                  73
    Exogenous Factors                                    73
                                                              Figures
    Endogenous Factors                                   75
                                                              Figure 1: Trade Openness/GDP per capita:
    Prioritization Approach                              76
                                                                Belize vs. Comparators                               15
    Conclusion                                          80
                                                              Figure 2: Belize Age and Sex structure, 2010           15
Bibliography                                            102
                                                              Figure 3: Belize Population, Census, 1946 to 2010      15
Annexes                                                 108
                                                              Figure 4: Belize Population distribution, Bayesian
                                                                estimation, April 2014                               16
                                                              Figure 5: NTL Comparison of Belize (left panel) and
                                                                Belgium (right panel)                                16
Figure 6: Evolution of Moderate Poverty in LAC and          Figure 38: Direct and total labor value added in
  Belize, 2000-2012                                    19     exports in 2011, forward linkages ($ million)         49
Figure 7: Evolution of Moderate and Extreme Poverty         Figure 39: Total labor content in gross exports across
  (% headcount) and Gini coefficient in Belize 2002           sectors and countries                                49
  and 2009                                          20      Figure 40: Direct and indirect labor value added in
Figure 8: Shared Prosperity in Central America         20     each $100 of exports (including backward linkages) 50
Figure 9: Moderate Poverty rates across Districts           Figure 41: Skilled and unskilled labor content in
  (% households, 2002 and 2009)                        21     gross exports                                         51
Figure 10: Extreme Poverty rates across Districts           Figure 42: Skilled and unskilled total labor value
  (% households, 2002 and 2009)                        21     added in exports in 2011 ($ million)                  51
Figure 11: Per capita GDP growth: Belize vs. LAC and        Figure 43: Proportion of Employed and Unemployed
  Upper Middle Income Countries 1980–2012              24     with No Education Attainment, by District             52
Figure 12: Stop and go policies in Belize (US$ lhs          Figure 44: Overall Government Debt under Different
  and % rhs)                                           24     Financing Scenarios                                   56
Figure 13: Growth since 2000 compared to the                Figure 45: Standard deviation of output growth:
  previous period                                      26     Belize vs. LAC Caribbean Small States 1970–2009       58
Figure 14: Structural and Stabilization Index               Figure 46: Standard deviation of output growth: Belize
  (2005–2010)                                          26     vs. Low and Middle Income countries 1970–2009        58
Figure 15: Cyclicality: 1990–2005 vs 2005–2013         27   Figure 47: Calculating Adjusted Net Saving for
Figure 16: What did Belize export?                     28     Belize in 2013                                        59
Figure 17: Product Space Map for Belize: 1990–2012     28   Figure 48: Belize’s Adjusted Net Saving, 1990–2013      59
Figure 18: Tariff rate, applied, weighted mean, all         Figure 49: Adjusted Net Saving: Belize, Latin America
  products (%), 2013                                   29     & Caribbean, Upper middle income                    60
Figure 19: Export Concentration of Market in 2003           Figure 50: Environmental Performance Index              60
  and 2013                                             30   Figure 51: Estimated annual losses due to Extreme
Figure 20: Technological Classification of Belize’s           Climate events, % of GDP, 1993-2012 (left panel);
  Export: 2003 and 2013                                30     Damage from Disasters in US$ million in Belize
                                                              (right panel)                                         62
Figure 21: General Government Expenditure/GDP vs.
  Economic Size, avg. 2000–2013                        31   Figure 52: Criticality and Flood Susceptibility of
                                                              Belizean Roads                                        63
Figure 22: Savings/GDP, avg 2000–2013                  31
                                                            Figure 53: Prevalence of low-birth weight for
Figure 23: Net Capital Flows/GDP, avg. 2005–2012       31
                                                              last-born children                                    67
Figure 24: Repatriated and Reinvested FDI income,
                                                            Figure 54: Percentage of children under age five
  avg. 2006–2011                                       32
                                                              that are stunted                                      67
Figure 25: Financial Indicators in Belize              33
                                                            Figure 55: Primary and secondary school net
Figure 26: Financial Intermediation in Belize          33     attendance rate by                                    69
Figure 27: Increase in Belize’s GDP per capita based        Figure 56: Child labor by wealth index and mother’s
  on counterfactual exercise                           35     education (2011)                                      70
Figure 28: Major obstacles to business operations,          Figure 57: Child labor by ethnicity and mother’s
  2010 (% firms)                                       35     education (2011)                                      70
Figure 29: Growth Accounting in Belize                 36   Figure 58: Education levels of employed population
Figure 30: Backward and Forward Linkages               36     by gender and ethnicity, %                            70
Figure 31: Belize: Unemployment and Net Migration      40   Figure 59: Prioritization Criteria                      76
Figure 32: Occupational distribution by gender and          Figure 60: Priorities for Sustainable Growth
  ethnicity, %                                         41     and Inclusion                                         78
Figure 33: Distribution of education by age and
  immigration status, %                                41   Annexes
Figure 34: Unemployment and labor force                     Annex 1: HRV Growth Diagnostics Framework and
  participation rates by gender, %                     42     its application to Belize                             85
Figure 35: Employed Population by District and              Annex 2: IFC’s Industry Note on Belize’s Oil Industry   86
  Foreign-Born Status, 2012                            43
                                                            Annex 3: IFC’s Industry Note on Belize’s Agriculture
Figure 36: Proportion of Labor Force that was                 and Agribusiness                                      87
  Unemployed and Proportion of Labor Force that
                                                            Annex 4: IFC’s Industry Note on Belize’s
  was Foreign Born, by District                        45
                                                              Tourism Sector                                        90
Figure 37: Direct and total labor value added in
  exports in 2011 ($ million)                          48
6   Belize—Right Choices Bright Future

ACKNOWLEDGMENTS

This Systematic Country Diagnostic (SCD) has been       (GHNDR), Carla Pantanal (GHN04), Jun Zhang (IFC),
prepared by a team of experts from several Global       Adam Shayne (LEGLE), Julie Lohi, Matias Jose Arnal,
Practices in IBRD, IFC and MIGA. Francisco Galrão       William Battaile (GMFDR), Anna Fruttero (GPVDR),
Carneiro (Lead Economist and Program Leader, LCC3C)     Bernarda Erazo (GPVDR), Dhushyanth Raju (SARCE),
was the main author and task team leader. The core      Manjula Luthria (GSPDR), Casey Weston (GSP05),
team consisted of Jaime de Piniés Bianchi (Senior       Sarah Berger Gonzalez (consultant), Jose-Daniel Reyes,
Consultant, GMFDR), Cecile Thioro Niang (Program        Raha Shahidsaless, Thomas Vis, Ana Cebreiro Gomez,
Leader, LCC3C), Pierre Nadj (Senior Country Officer,    Pedro Arno (GTCDR), Agustin Maria, Keren Carla
LCC3C), Ulrich Barsth (Lead Economist, GMFDR),          Charles, Kimberly Vilar, Peter Lafare, Pedro Ferreira
Rohan Longmore (Country Economist, GMFDR),              Fonse Pedroso (GPSURR).
Kassia Antoine (Research Analyst, GMFDR), Yevgeniya
Savchenko (Economist, GPVDR), Javier Baez (Senior       Sophie Sirtaine (Country Director, LCC3C) provided
Economist, GPVDR), Andres Castaneda (Research           overall guidance. Augusto de La Torre (Chief Economist,
Analyst, GPVDR), Claire Hollweg (Consultant, GTCDR),    LCRCE) chaired the Regional Operations Committee
Yoonhee Kim (Senior Urban Economist, GSURR), Rajeev     meeting that reviewed the concept note and provided
Gopal (IFC Country Representative, CLAEC), Luciana      strategic guidance at the earlier stages of preparation.
Marchesini (IFC Strategy Officer, CGEDR), and Petal     The team would like to thank the peer reviewers, Anna
Jean Hackett (MIGA Economist, MIGEC). Other             Fruttero (Sr. Economist, GPVDR), and Robert Utz
members of the Belize Country Team and Global           (Program Leader, EACNF) for useful insights during
Practices contributed inputs and participated in        preparation and at the concept stage. LAC GP Managers
workshops, including: Snjezana Plevko (GSPDR),          provided guidance on their respective sectors, as
Svetlana Edmeades (GFADR), Alessandro Legrottaglie,     requested by the core team. The team is particularly
Galina Sotirova, Oscar Apodaca, Laisa Daza, Leonardo    grateful to Auguste Tano Kouame (Practice Manager,
Aleixo Lemes (LCC3C), Christelle Chapoy (LCREC),        GMFDR) for useful guidance and feedback at the
Leonardo Garrido (consultant), Melissa Ann Adelman      earliest stages of preparation, and to the Regional Chief
(GEDDR), Klas Sander, Keiko Ashida, Sylvia Michele      Economist’s Office for an informal brainstorming on an
Diaz, Sarah Guel (GENDR), Migara Jayawardena            earlier draft. Elisabeth Mekonnen, Mohammed Eddreess
(GEEDR), Jane Hwang, Nadeem Kermali (GFMDR),            Sahak, and Joy Duff-Aleyne (LCC3C) provided critical
Gabriel Yorio Gonzalez, Karina Ramirez Arras, David I   support to the team.
(GGODR), Carmen Carpio (GHNDR), Christine Lao Pena
Systematic Country Diagnostic 7

                                                                                      OVERVIEW

Belize has a rich history that dates back thousands        sectors of the economy. Sugar export receipts grew by
of years. The country was first inhabited by the Mayans    80%, production and exports of citrus nearly doubled
with records of their presence dating from 1500 BC.        and that of bananas tripled. Tourism arrivals more than
The first recorded European settlement was established     doubled and receipts tripled. Led by public infrastructure
circa 1638 by the British who called the country the       investment      and     tourism-related     construction,
Colony of British Honduras. The official name of the       construction boomed and boosted trade and transport-
territory was changed from British Honduras to Belize      related activities (see World Bank (1992)).
in June 1973, and full independence was granted on
September 21, 1981. There were several obstacles in the    In the early 1990s, the economy started to slowdown
path toward independence, as illustrated by Guatemala’s    as it suffered from the effects of a recession in the US
long-standing claim to the entire territory. It was only   economy. Agriculture and tourism were hit hard and
in November 1980, after several frustrated negotiations    the current account of the balance of payments
with Guatemala that Belizean diplomacy managed to          recorded a deficit estimated at 15% of GDP in 1991, up
obtain international support that led to the United        from 5% of GDP in 1990 (World Bank (1992)). A marked
Nations passing of a resolution that demanded the          feature of the growth performance of Belize since the
independence of Belize, but it was only in 1992 that       1990s has been its high volatility. The small size of the
Guatemala formally recognized Belize’s independence.       country, its high dependence on exports and imports,
                                                           and its exposure to natural disasters have contributed
After independence, Belize successfully implemented        in different degrees to this volatility. Between 1994 and
a development strategy which emphasized economic           2013, for example, losses from hydro-meteorological
diversification and private sector development at a        disasters were estimated at US$71 million, with an
time where the terms of trade were favorable to the        annual average loss of approximately 4% of GDP. It is
country. In the mid-1980s, Belize experienced rapid        estimated that if current climatic trends continue,
economic growth in response to good economic               extreme events will become more frequent resulting in
management and a favorable external environment.           greater fiscal impacts. Disasters could have a direct
During 1986-90, real GDP growth exceeded 10% per           and large impact on economic conditions through
annum on average, with strong contribution from all        reduced productivity, unsustainable budgetary deficits,
8   Belize—Right Choices Bright Future

and increased national debt due to reconstruction             recent debate on the country’s potential to start
costs. Furthermore, resources appropriated to respond         exploration of offshore oil is a classic example given
to natural disasters reduce the funding available for         that Belize is also the house of the largest live coral
other development projects. In addition, underdeveloped       barrier reef in the world. As tourism and agriculture are
and dilapidated infrastructure, particularly in the           the country’s major sources of income and employment,
transport sector, directly contributes to Belize’s            the dangers associated with offshore oil exploration
vulnerability to disasters and by extension the country’s     pose serious risks to Belize’s varied ecosystems and to
economic growth.                                              the livelihoods of a significant share of the population.

The limited data available suggests that poverty              Belize’s small size is an important exogenous factor
levels in Belize are high and substantively above the         that makes the country vulnerable to terms of trade
average for Latin America and the Caribbean. Since            shocks and creates output volatility which can affect
the early 2000s, GDP growth has been very close to the        long-term growth negatively. As the country needs to
rate of growth of the population (estimated at 2.5%)          import most of what it consumes and relies on a few
which has led to the almost stagnation of GDP per             sources of foreign exchange, it remains pretty much
capita for the last 12 years or so. Poverty data, which is    vulnerable to the fluctuations of commodity prices and
available only for the years of 2002 and 2009 for the         the performance of its few trade partners. The
most recent period, show an increase in the share of the      recessions faced by the US in the early 1990s and
population below the poverty line from 34% to 42%             recently during the global financial crisis and how hard
between these two data points. Poverty is a rural             Belize’s economy hurt in the aftermath of these events
phenomenon in Belize as rural poverty rates reached           illustrate this vulnerability well. The small size also
55% in 2009 as compared to 28% in urban areas. This           means that the country has few opportunities to grow
performance is in stark contrast with that of the LAC         (the availability of arable land in Belize at 700 Km2 in
region as a whole where poverty has declined from 42%         2009 is extremely low) as it faces a situation of lack of
in 2002 to 30% in 2009 lifting more than 80 million           economies of scale. Economic size is also an important
from poverty.                                                 predictor for low savings, and the situation in Belize
                                                              confirms this stylized fact. Gross domestic savings
Based on the data available, the incidence of poverty         have averaged about 10% of GDP in the recent past
shows large spatial differences. The bottom 40 of             which is at least 50% lower than the LAC average of
the population is mostly situated in rural areas with         15%. With limited savings, investments remain low as
the highest rates of extreme poverty found in the             well, and growth prospects conditioned on the ability to
districts of Corozal and Toledo. Poverty seems to be          innovate, increase productivity, and diversify products
higher in these areas because they tend to concentrate        and partners. Another important exogenous factor that
households headed by individuals with low levels of           can impact the country’s ability to grow, contribute to
schooling, exhibiting lower female participation in the       increase its debt levels, and impact savings is its high
labor market and belonging to ethnic minorities.              degree of exposure to natural hazards.
Income inequality is also moderately high with a Gini
coefficient of 0.42 in 2009, but this is based on an old      Two important endogenous factors that can affect
survey and the recent stagnation of real per capita in        long-term growth in Belize are associated with the
the country suggest that this might have increased in         quality of its capital and labor. This SCD has shown
more recent years.                                            that weaknesses in infrastructure can exacerbate the
                                                              impacts of natural disasters on the economy. In
As a small, open economy, that is also extremely              addition, the poor quality of education has a direct
vulnerable to climate change and natural disasters,           impact of the quality of the labor force. The lack of
Belize’s ability to promote faster poverty reduction          secondary road networks and the vulnerability of the
and greater shared prosperity will depend on how              whole energy sector to strong winds mean that a single
well the country deals with its main sources of               storm can leave the country paralyzed and in the dark
vulnerability. Our findings show that these vulnerabilities   for long periods of time, impeding the movement of
have exogenous and endogenous reasons. Exogenous              cargo and people thus hurting growth and affecting
factors can be a blessing and sometimes a curse. The          negatively the livelihoods of Belizean citizens.
Systematic Country Diagnostic 9
Growing crime and violence and concerns with the of priority areas and allowed the consideration of
lack of competition and stability in the financial important nuances in the prioritization exercise. In
sector have also been identified as binding practice, the approach followed three key considerations,
constraints to growth in Belize. In addition to as follows.
weaknesses in infrastructure and in the skills of the
labor force, several studies have pinpointed crime and The main areas in need of a big push that could have
violence and problems in the financial sector as the highest potential impact on the twin goals are
important deterrents to growth. The analysis in this illustrated in Figure O2 and include:
report confirms the centrality of these two factors. The i. Improving education and skills;
predicament in the financial sector is largely driven by ii. Addressing crime and violence; and,
the small economic size of the country and the lack of iii. Increasing resilience to climate change and
competition in the banking sector—a common feature natural disasters.
in small state economies that limits the availability of
credit to small and medium enterprises. Stability issues
Figure O1: Prioritization Criteria
in the sector complicate matters as these impose non-
negligible risks to the health of the financial sector. On
the other hand, the rise in the inflow of migrants from
neighboring Central American countries with a history
of crime and violence has been raised as a potential
cause for high crime rates in Belize, but there is not IMPACTS
ON THE
enough evidence to substantiate that claim at this TWIN GOALS
point. Policy interventions that could help halt the rise
in criminality rates include ramping up the quality of
education, keeping children at school, promoting SUSTAINABILITY
education equivalency programs and job training,
besides more direct approaches such as investing in POSITIVE SELF-
safe neighborhood programs. EXTERNALITIES REINFORCING
AND TRADE-OFFS DYNAMICS
Putting Belize back on a path of faster growth that
could unlock faster poverty reduction and greater PROCESS INFORMED BY CONSULTATIONS
inclusion will require attention to a few areas in need
of big push. The approach adopted in this SCD to
identify priorities to accelerate growth and boosting
shared prosperity relied on four key considerations (see Improving education and skills would positively
Figure 01). First, the extent to which improvements in a impact growth, inclusion, and sustainability and
given area would have substantial impacts on the twin these positive impacts would be reinforced by the
goals of reducing extreme poverty and boosting shared adoption of an appropriate migration policy. Higher
prosperity. Second, for a small state that faces important learning outcomes, greater equity and access to
problems with economies of scale, it was important to education would better equip the labor force for the
take into account positive externalities and trade-offs acquisition of skills demanded by the domestic labor
associated with any proposed intervention. In this markets and position them well to compete for better-
context, this SCD has used the existence of paying jobs if they decide to emigrate. A more educated
complementarity effects and trade-offs as an explicit and skilled workforce would attract a more rewarding
criterion to identify priorities. Third, given the observed return to schooling and could help reduce the high
stop-go pattern of growth in Belize and the country’s reservation wage levels exhibited by Belizeans thus
heightened volatility to exogenous shocks and exposure contributing to reduce the natural rate of unemployment
to natural hazards, sustainability has been an important and lowering the costs associated with the provision of
criterion helping to define priority areas of focus. Finally, social protection. In addition, an appropriate migration
an additional factor that helped identify priorities policy would ensure that the incoming migrants could
included the existence of self-reinforcing dynamics, fill the positions that many Belizeans, particularly
which helped to introduce more granularity in the choice young Belizeans, are unwilling to fill. A better educated10 Belize—Right Choices Bright Future
labor force would certainly have a significant impact on contributing to raise the skills profile of the labor force
poverty reduction, especially if education outcomes are with expected positive spillovers on competitiveness
significantly improved at the secondary level, besides and growth. Finally, it is essential to preserve the youth
helping to develop greater backward and forward and avoid their exposure to crime, which in Belize is
linkages in the economy. The entry points to improve extremely high (at 99% percent) and is believed to be an
education and skills have been amply studied and important risk factor for the perpetration of violence.
discussed. They include greater attention to pre-school
education, ensuring primary and secondary education Strengthening resilience to natural disasters and
access for all children, improving teacher training, climate change along with improvements in the
establishing quality assurance and accountability existing infrastructure in Belize are critical to
mechanisms to increase learning and improve efficiency, support the twin goals to end extreme poverty, and
and expanding and tailoring existing vocational and promote shared prosperity in poorer segments of
training institutions to respond to the needs of the society. Belize is one of the countries in the world which
market, including training of migrants. is most affected by weather-related events and other
natural hazards. Combined, Belize incurs annual losses
Addressing crime and violence would complement of close to 4% of GDP due to natural disasters. These
progress in other priority areas with positive losses add to fiscal pressures and constrain wealth
spillovers on competitiveness and ultimately growth. accumulation. Climate change is expected to increase
The links with education and skills is obvious as a self- the frequency and intensity of weather-related events.
reinforcing effect could lead to better inclusion. In the Poor communities are disproportionately vulnerable to
short to medium-term, there are entry points around economic shocks and reduced mobility—particularly
creating income and learning opportunities to steer the the minority groups in the southern and northern parts
youth away from joining criminal organizations, creating of the country. The vulnerability in the road networks,
a safer environment for learning, and ultimately due to the lack of redundancy, results in agricultural
Figure O2: Priorities for Sustainable Growth and Inclusion
SUSTAINABLE GROWTH AND INCLUSION
PRIORITY PRIORITY
Addressing Crime Strengthening
and Violence Resilience to
BETTER HIGHER SAVINGS Climate Change
COMPETITIVENESS AND and Natural
INVESTMENT Disasters
PRIORITY
Improving Education
and Skills
INSTITUTIONAL
REFORM
CROSS-CUTTING AREAS:
MIGRATION POLICY Availability and Quality of Data INFRASTRUCTURE
Increasing Financial Inclusion
Safeguarding Fiscal SustainabilitySystematic Country Diagnostic 11
communities unable to access the larger markets in far been unable to provide any kind of agriculture
Belize City and Belmopan, students unable to attend insurance in Belize. Notably missing financing
schools, and goods not able to make it into rural instruments in the local financial markets are: micro-
communities. These problems are compounded by the financing, micro-insurance, leasing and factoring. Once
fragility of the energy network that can easily be financial stability is restored, the development of such
damaged by severe storms which have hit Belize with instruments could support greater access to finance by
frequency in the past and should remain a threat in the small and medium enterprises and contribute to
future. Investing in disaster risk management will help decreasing the identified credit gap of US$1,141 million
to protect the limited assets of poor communities from for this important market segment. Greater financial
natural disasters and climate change related events inclusion can also help raise savings and investments
and to improve the access and the economic livelihoods which would have a positive impact on growth and
of poor and vulnerable communities. shared prosperity.
Consideration was also given to structural issues Sustainable progress towards the achievement of
that cut across and would complement progress in the twin goals of reducing poverty and boosting
different areas, and these included: shared prosperity in Belize will also require
a. Improving the availability and quality of data prioritizing fiscal sustainability. As a small and largely
b. Increasing financial inclusion; and open economy, Belize is exposed to large terms-of-
c. Safeguarding fiscal sustainability. trade shocks that can introduce output fluctuation and
affect growth negatively. A sure way to mitigate
Belize needs a big push to improve the quality and against external shocks is by building fiscal buffers that
availability of data. In order to become more efficient could help the authorities to keep a counter-cyclical
and obtain better results governments need good data. fiscal stance. While the short-to-medium term outlook
This is true from different angles and perspectives. Data for Belize remains broadly favorable, projects financed
are crucial to allow countries to track where they are in with PetroCaribe resources may become future fiscal
terms of social and human development and can help liabilities. Continued efforts to promote fiscal
identify which policies work and which do not in consolidation would help create fiscal space to finance
promoting growth and shared prosperity. Budget priority expenditures (on education and resilience, for
decisions and policy choices have long-term effects on example) and boost the income of the bottom 40% of
a country’s fiscal future and on the outcomes that the the population. This is all the more important in view of
budget delivers for the country’s citizens. These the potentially negative impact on Belize’s public debt
decisions and policy choices can lead to much better levels associated with the imminent need to make
results if they are based on rigorous and reliable compensation payments for the nationalized utilities.
evidence that can enable the government to select, In that context, Belize would do well in safeguarding
fund, and operate public programs more strategically. fiscal sustainability by continuing to seek ways to
In the case of Belize, there are serious limitations in the strengthen its fiscal position and reduce its debt level
quality and availability of social and economic information as a share of GDP.
that prevents the government and prospective
investors from making more informed decisions. These
limitations can affect the effectiveness of government
policy and inhibit new businesses. The Process
The availability of financial services remains narrow; Consultations with stakeholders helped to inform
particularly to serve small and medium enterprises. this SCD. The team has also conducted internal
And stability issues in the banking system do not augur consultations with the SCD core team, including
well for the health of the financial sector. The commercial expertise from the IFC and MIGA, and with Global
banking sector mainly focuses on large and medium Practice colleagues. These consultations took the form
scale clients. Thus the options for small and medium of brainstorming meetings to collect feedback and
enterprises to obtain financing from formal financial inputs on the definition and diagnostic of the most
institutions are limited to credit unions. Agriculture binding constraints to growth and proposed areas of
contributes nearly 12% of GDP but the market has so focus to boost shared prosperity and reduce extreme12 Belize—Right Choices Bright Future poverty in Belize. This SCD has drawn on existing inform specific actions in the priority areas. The sixth material, new analyses commissioned for the purposes and final chapter has three important and distinctive of this systematic effort to understand the main features. First, it provides a synthesis of the analysis sources of growth and prosperity in the country, and and findings of the previous chapters. Second, it crucially in consultations in country with a varied group provides a discussion of the approach used to identify of interlocutors. Throughout the consultations, there the priorities for action in Belize. And, third, it concludes was a broad consensus on the diagnosis of the with a discussion of the priorities to boost shared challenges faced by Belize and the priorities identified prosperity and ensure economic, social and in this report. Above all, there was overwhelming environmental sustainability in Belize. recognition of the need to improve the quality of education and skills in the country given its spillover effects on competitiveness, growth, and crime and violence. A Caveat This SCD is structured in six chapters that range A caveat to be aware of at the outset is that there are from a brief description of the main features of Belize many information gaps in Belize. There have been to the discussion of priorities for growth and shared only two poverty assessments undertaken since the prosperity. Chapter 1 presents the country context, last century (2002 and 2009) and information on social highlighting Belize’s main features as a small upper indicators, poverty, and welfare is scant. This has middle income country that faces high volatility limited substantively the diagnosis of poverty and associated with its size and vulnerability to exogenous shared prosperity trends. In that context, it was not shocks. Chapter 2 discusses trends in poverty and possible, for example, to understand better the shared prosperity. Chapters 2 through 5 discuss the dynamics of poverty nor its responsiveness to economic main underlying factors that have been found to growth, nor gauge the contribution of different sources influence Belize’s growth performance as well as its of income to poverty reduction. Similar data limitations economic, social and environmental sustainability. prevented a more detailed assessment of the Each of these chapters discuss in greater detail the determinants of income inequality, the role of nature of the challenges, dig deeper into exploring the remittances on labor market outcomes, and the public- likely causes of these challenges, and identify policy private wage differentials. Improving the quality of data areas that could be critical for boosting growth and and statistics on poverty and labor could go a long way inclusion and ensuring sustainability. These chapters in allowing a better diagnosis of social conditions in the also identify knowledge and data gaps on areas where country while also informing critical policy decisions. new information could help strengthen a diagnosis and
Systematic Country Diagnostic 13

                                                                     COUNTRY CONTEXT

While there is insufficient data to adequately assess            communities2. There is also clear evidence of a rural-
the dynamics of poverty in Belize, overall poverty               urban divide based on lower education, low female labor
may have most likely worsened more recently,                     participation and belonging to ethnic minorities.
especially because income per capita has virtually
stagnated since the early 2000s. Summary economic                The growth pattern in Belize has been erratic and
and social indicators are presented in Table 1. GDP per          seems to be linked to political cycles. Growth appears
capita remained virtually flat after 2003 because the            to be closely linked to fiscal spending and the country’s
economy grew close to –and at times even below– the              external position. Over the last twenty years or so, the
annual rate of growth of population, estimated at 2.5%.          evidence shows that the current account consistently
During the 2002-2009 period, the overall poverty rate            moves into deficit during periods of accelerated growth
increased from 34% to 42%, and extreme poverty                   and then recovers during recessionary periods.
increased from 11% to 16%1. Rising poverty has affected          According to the IDB, Belize suffers from lack of fiscal
all districts; for example, poverty rates have more than         discipline with the country’s fiscal problems being more
doubled in the Corozal District, from 26% to 56%, and            pronounced on the expenditure side. The IDB also notes
extreme poverty tripled from 6% to 21%. Corozal was              that Belize’s growth accelerations have been fueled and
also repeatedly impacted by hurricane and flooding,              extended by unsustainable public investment (Martin
underscoring the population’s vulnerability to disasters.        and Manzano (2010) p. 14). In addition to poor fiscal
Income inequality also remains moderately high with a            discipline, Hausmann and Klinger (2007) argue that low
Gini coefficient of 0.42. The highest economic inequality        savings constrain access to finance in Belize. The
is     concentrated      among      indigenous    Mayan          country also follows a conventional peg to the US dollar
                                                                 which means that, as in other ECCU countries, fiscal
                                                                 policy constitutes almost the only available tool for
                                                                 macroeconomic management. Also similar to the ECCU
1   Extreme (or Indigent) poverty is defined as $ 2.74 per day
    ($1,000 per year) and Moderate poverty by $ 4.65 per day
    ($1,700 per year). Source: Government of Belize and Carib-
    bean Development Bank 2009 Country Poverty Assessment        2   Extreme poverty in Toledo where Mayan communities are con-
    Final Report, August 2010.                                       centrated is 38% while the national average is 10% (2009).
14 Belize—Right Choices Bright Future
Table 1: Select Socio-Economic Indicators for Belize and LAC
BELIZE LAC
2000 2009 2013 or latest 2000 2009 2013 or latest
Population Density 10.5 12.2 14.6 26.2 28.2 30.7
Population Growth 2.9 2.6 2.4 1.5 1.2 1.1
Life Expectancy 70.5 72.3 73.7 71.6 73.2 74.6
Urbanization Rate 47.7 46.0 44.3 75.3 77.2 79.3
Primary Completion Rate 100.8 104.8 116.1 95.9 97.1 94.8
Secondary Completion Rate 44.5 56.6 64.3 59.9 72.6 78.5
2000–2005 2006–2010 2011–2013 2000–2005 2006–2010 2011–2013
GNI per capita 4276 3841 4030 4591 5279 5693
Real GDP Growth 6.7 2.8 2.0 2.8 3.6 3.2
Public Debt (% of GDP) 92.8 84.6 76.8 53.5 47.7 48.7
2002 2009 2003 2007 2012
Poverty Rate* 34 42 41 32 25
Rural Poverty** 44 55 64 56 47
Urban Poverty** 24 28 34 27 21
Inequality Index (Gini) 40 42 56 54 52
Notes: *Belize: moderate poor (2009 Country Poverty Assessment). LAC: Poor ($US 4 per day). **LAC average: Bolivia, Brazil, Chile, Colombia, Dominican
Republic, Ecuador, El Salvador, Honduras, Mexico, Paraguay and Peru.
Sources: IMF, World Bank (WDI, Equity Lab), Government of Belize and Caribbean Development Bank.
experience, the country’s pro-cyclical fiscal behavior in Yet, Belize is a more open economy today than many of
periods of expansion (see Carneiro and Garrido (2015)) its comparators. The average trade openness in Belize
and overall lack of tax buoyancy, have led to the from 2003 to 2013 is greater than the averages of the
accumulation of debt which is now close to 75% of GDP. Caribbean countries, Latin America and the Caribbean
(LAC), the Least Developed countries (LDC), Low and
An open Upper Middle Income Country (MIC) with a Middle Income countries (LMI), and the world, but
GNI per capita of US$4,510 in 2013, Belize is an open remains significantly less than the average of the Small
economy that has integrated mostly with the Island Developing States (SIDS) (see Figure 2). However,
Caribbean rather than with other Central or South the high openness to trade in Belize has been largely
American countries. Unresolved territorial disputes driven by imports resulting in relatively lower terms of
with Guatemala since Belize’s independence in 1981 trade in comparison with its peers.
have slowed progress in regional integration solutions.3
3 Guatemala maintains a long-standing territorial claim over a
part of the territory of Belize. The current borders were de-
fined in a treaty concluded between Britain and Guatemala ICJ “any and all legal claims of Guatemala against Belize to
in 1859. There have been several attempts to resolve these land and insular territories and to any maritime areas per-
territorial disputes. The most recent initiatives in this respect taining to these territories”. On April 27, 2012, the Ministers of
have been undertaken under the auspices of the Organization Foreign Affairs of Belize and Guatemala agreed that referenda
of American States (OAS) since 2000. In this context, the two on referring the territorial dispute to the ICJ be held simul-
parties agreed to carry out a number of confidence-building taneously in both countries on October 6, 2013. This did not
measures and launched various rounds of negotiations until happen as scheduled. Most recently, the two countries have
the OAS Secretary-General recommended in November 2007 agreed to a Road Map and Plan of Action, which has as its
that the dispute be referred to the International Court of Jus- main objective the strengthening of the bilateral relationship
tice (ICJ). Following this advice, on December 8, 2008 Belize between the two countries so that a new date most conve-
and Guatemala signed a Special Agreement to submit to the nient to both to hold the referenda can be fixed.Systematic Country Diagnostic 15
Despite having a young and quickly growing Figure 2: Belize Age and Sex structure, 2010
population—estimated at 340,000 inhabitants in
2013—Belize remains sparsely populated. The 85+
number of Belizeans has been doubling every 30 years 80–84
75–79
(Figure 3)4 and at current rates of growth would double 70–74
again by 2036 (Figure 4).5 Strong net immigration from 65–69 Males Females
60–64
El Salvador, Guatemala and Honduras has contributed 55–59
50–54
to population growth. Despite the fast rate of growth,6 45–49
however, the country remains very thinly populated. 40–44
35–39
Combining the census data with the most recent 30–34
25–29
available information, the best depiction of the 20–24
distribution of the population of Belize (Figure 4) 15–19
10–14
confirms that the country is indeed scarcely populated 5–9
with large swathes of unpopulated land. Belgium has 0–4
8.0 6.0 4.0 2.0 0.0 2.0 4.0 6.0 8.0
more than 33 times the population of Belize with
Percent of Total Population
approximately the same land mass (see Figure 5 which
maps both countries using Night Time Lights (NTL)). Sources: Statistical Institute of Belize, 2013.
Figure 1: Trade Openness/GDP per capita:
Belize vs. Comparators
Figure 3: Belize Population, Census,
1946 to 2010
200
Trade Openness (% GDP) in 2013
Small Islands
Panama 350,000
150
300,000
100 Honduras
Belize
Nicaragua 250,000
LDC Caribbean
50 Guyana LMI
Jamaica World
Haiti GTM Dominican 200,000
LAC
0 Republic
150,000
7.5 8 8.5 9 9.5 10
100,000
Log GDP per Capita in 2013
50,000
95% CI Trade openness (%GDP) Fitted values 1946 1960 1970 1980 1991 2000 2010
Sources: World Bank staff estimates Sources: Statistical Institute of Belize, 2013.
4 The foreign-born population included in the 2010 census was
45,723 or 14% of the population.
5 The doubling of the population refers to the census taken in
2010 of 324,528 persons. If the current rate of growth of
2.65% held constant, the population would double every 26
years.
6 During the late classic period of Mayan civilization (600-800
AD), the total Mayan population might have been as high as
20 million. This would have implied a significantly greater
population for Belize than current estimates. See for example,
Turner (1976) and Tedlock (1982).16 Belize—Right Choices Bright Future
Figure 4: Belize Population distribution, Figure 5: NTL Comparison of Belize (top
Bayesian estimation, April 2014 panel) and Belgium (bottom panel)
Sources: WorldPop project. See: www.worldpop.org.uk.
Sources: World Bank Staff based on analysis of DMSP-OLS night-time
lights data.
With a nominal GDP of US$1.6 billion in 2014 (ranked
172th out of 194 in The World Bank Development
Indicators), Belize has a small economy heavily agriculture but only 7% of that is currently utilized for
concentrated on tourism and agriculture. Tourism is farming. Traditionally Belize has grown commercial
the most important industry in Belize, representing 21% crops such as sugar and citrus fruits for export to
of GDP and 28% of employment. In 2013, Belize received Europe and the USA whereas food crops have been
294,000 tourists, a 6% increase from 2009. This recent traditionally cultivated at a subsistence/small scale for
growth has been driven by North America, with 70% of local consumption. Tourism is the number one foreign
tourists arriving from the US and Canada. Although the exchange earner in this small economy, followed by
majority of tourists arrive by water, the amount of exports of crude oil, marine products, sugar, citrus, and
tourists arriving by land has increased by 18% over the bananas.
same period. Agriculture accounts for 13% of Belize’s
GDP, 10.2% of its employment7 and more than 2/3 of its Belize’s total wealth is comparable to countries of
exports.8 Some 38% of Belize land areas is suitable for similar size and population and is estimated at $20
billion with a per capita wealth of $63,188. A wealth
accounting exercise carried out for this SCD reveals
7 CIA Factbook, 2012, Statistical Institute of Belize that Belize’s total wealth per capita is comparable to
8 The Atlas of Economic Complexity,” CID at Harvard University, that found in its income group, where the average for
http://www.atlas.cid.harvard.edu upper middle income countries is $72,700; but it isSystematic Country Diagnostic 17
Table 2: Where is the Wealth of Belize?
2010 US$ TOTAL (BN) PER CAPITA
5% 10% Natural Capital Composition
Total Wealth 20.0 63,188 4%
7% Crop Land
Produced Capital 2.4 7,648 Pasture Land
Natural Capital 8.0 25,297 Forests
Protected Areas
Intangible Capital 11.6 36,638 74%
Subsoil Assets
Net Foreign Assets -2.0 -6,296
Sources: Author’s calculations based on World Bank data, preliminary estimates.
substantially lower than its regional average, which is As Belize is a country with extensive, low-lying,
$133,800 for Latin America and the Caribbean. Belize’s coastal areas it faces significant vulnerability to
intangible capital, which captures human and social climate related disasters such as tropical cyclones
capital, comprises over half of the nation’s total wealth. and flooding. Furthermore, the economy is small and
Natural capital is the second most important concentrated with most centers of population located
component at 40% of total wealth, dominated by the in the most vulnerable areas. The UNFCCC recognizes
value of its protected areas. Produced capital makes up Belize as one of the countries most vulnerable to
12% of total wealth, and net foreign assets are quite adverse impacts of climate change due to it: (i)
largely negative (i.e., financial liabilities greater than possessing a long, low-lying coastline, (ii) consisting of
financial assets) at negative $2 billion in total (see Table 2).9 over 1,060 small islands, (iii) having the second longest
barrier reef in the world (and the largest reef in the
Belize derives significant benefits from the Western Hemisphere and the Americas), and (iv)
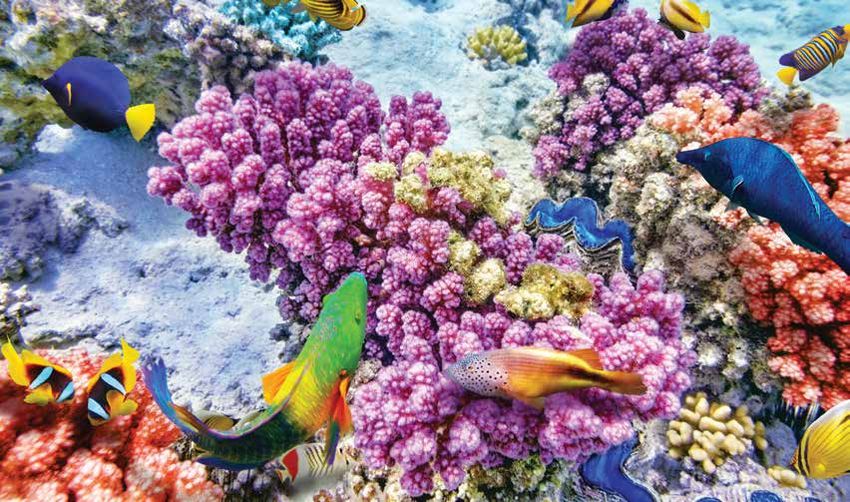
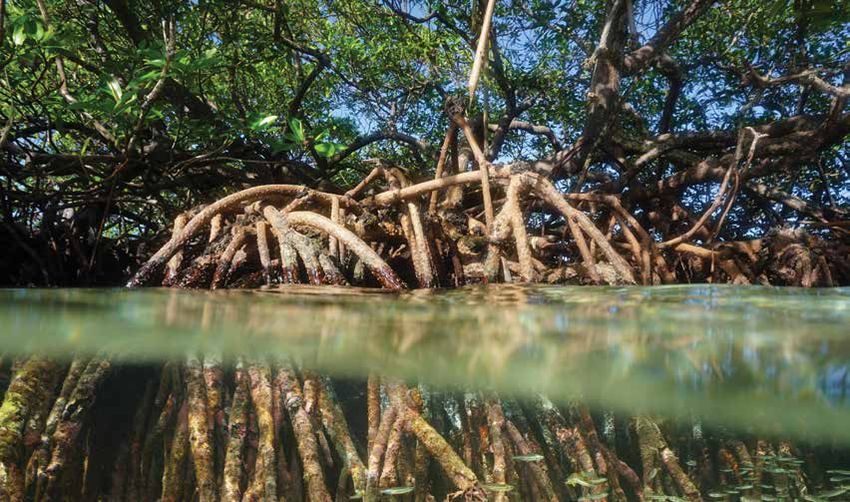
ecosystem services generated by the coral reefs and maintaining 17,276 km2 of forest cover, each of which
mangroves. It has been estimated that the value of supports fragile ecosystems. Thus, the vulnerability of
ecosystem services (fishing, tourism, shoreline the country to the foreseeable adverse physical,
protection) generated by the coral reefs and mangroves environmental, and economic impacts of climate
contributes between 15% and 22% of GDP in Belize (in change indicates that priority attention must be
the range of US$395–559 million per year) (Cooper, directed towards the implementation of viable
Burke, and Bood (2009)). The Belize Barrier Reef not adaptation measures targeting the most vulnerable
only supports vibrant tourism, fishing industries, and sectors and ecosystems of Belize.
livelihoods for communities, but also shelters Belize’s
extensive coast from erosion and coastal damage The small size of the economy and its domestic markets
caused by wave action. According to the World together with the topographic characteristics of the
Resources Institute’s assessment in 2008, country expose its vulnerability to economic shocks
approximately two-thirds of the mainland coast is and natural hazards. The smallness and concentration
protected by coral reefs. The degree of protection varies of the economy on tourism and agriculture increase the
with reef type, depth and distance from the shore, as importance of effective trade integration. Low
well as with the elevation and slope of the shore, the population density creates difficulties for agglomeration
geological origin of the area, and the wave energy along and scale economies making the provision of
the coast. Emergent reefs, such as the Barrier Reef, can infrastructure inherently expensive in per capita terms.
mitigate over three-quarters of wave energy. Reefs The country is also highly exposed to the elements
close to shore provide the most protection since waves being vulnerable to hurricanes, tropical storms and
have less chance to regenerate. flooding due to its extensive coastline topography. In
additional, climate change can bring significant risks
given the low elevation of much of Belize’s land area, the
concentration of population in coastal areas, and the
reliance of the economy on natural resources.
9 A summary of the World Bank’s wealth accounting methodol-
ogy can be found in Box 6 of this report.18 Belize—Right Choices Bright Future Over the past ten to fifteen years, migration to Belize has increased sharply, fueled heavily by political instability and unemployment in neighboring Central American countries and Mexico. While migrants have been absorbed fairly quickly into the Belizean labor market, native unemployment has remained high, creating questions about the role of migration in poverty reduction and shared prosperity in Belize. While attributing native unemployment in Belize to high migrant employment may be tempting, the data available does not suggest a strong causal relationship between the two phenomena. At the district level, native unemployment does not appear correlated to migrant labor market participation. In places where migrants appear to access employment opportunities by accepting wages that natives would not, the result may be the survival of agricultural and service industries with low and variable profit margins. It is possible that firms in these industries would close if they could not rely on migrants and instead had to pay higher wages to natives; field research would be necessary to substantiate this claim. Thus, migration’s effect on native employment is unclear.
Systematic Country Diagnostic 19

                  POVERTY AND SHARED PROSPERITY

Poverty and shared prosperity are thought to have            and 2012. In 2010, for the first time since comparable
worsened in the wake of adverse shocks that have             records exist for LAC, the proportion of people in the
affected Belize and other countries in the region.           middle class exceeded the proportion of poor people.
Since household surveys used to calculate poverty and        Drawing on the existing data, such inflection point
income estimates are only available infrequently in          remains far away for Belize.
Belize (2002 and 2009), most of the poverty and shared
prosperity data are out of date. While robust evidence           Figure 6: Evolution of Moderate Poverty in
is not available, there is a convergence of factors and          LAC and Belize, 2000–2012
related trends that indicate that poverty and shared
prosperity outcomes are likely to have worsened since                                50

the last estimates. This is due for example to the effects
                                                             Poverty headcount (%)

of the global financial crisis and the several natural
                                                                                     40
disasters faced by the country, and the fuel price rises
observed between 2008 and 2010. Whereas the rest of
Latin America and the Caribbean have experienced                                     30
major advances in pro-poor growth in the 21st century,
the available data on Belize shows poverty at a higher
level in comparable periods (Figure 6). This is evident                              20
amongst the extreme poor (indigent) and the moderate                                      2000 2001 2002 2003 2004 2005 2006 2007 2008 2009 2010 2011 2012

poor which together represent roughly the entirety of                                          LAC (Poor ($4 USD a day))          Belize (Moderate poor)
the bottom 40% of the population and from worsening
                                                             Note: Poverty numbers for LAC based on harmonized data for 17 countries
Gini coefficients in the country (Figure 7). This            in the region for which micro data are available and using a poverty line of
performance is in stark contrast with that of the LAC        (PPP US$4). Poverty rates for Belize (2000 and 2009) based on official
                                                             numbers.
region as a whole. Over the 2002-09 period, for which
data for Belize is available, poverty in the LAC region      Source: LAC Equity Lab tabulations of SEDLAC (CEDLAS and the World
                                                             Bank) and WDI. Government of Belize and Caribbean Development Bank.
dropped from 42% to 30%. Roughly speaking, nearly 80         2009 Country Poverty Assessment Final Report, August 2010.
million were lifted from poverty in LAC between 2000
20 Belize—Right Choices Bright Future
Figure 7: Evolution of Moderate and Extreme face due to poor resource allocation, weak targeting,
Poverty (% headcount) and Gini coefficient and low program effectiveness. When facing hardship,
in Belize 2002 and 2009 the poor most often seek informal sources of assistance
to solve their problems, which underscores the
limitations of Belize’s existing safety net.
45
40
35 Figure 8: Shared Prosperity in Central America
30
8
25
7
20
15 6
10 5
5
4
0
Extreme Poverty Moderate Poverty Gini 3
2002 2009
2
Note: The sum of extreme and moderate poverty in 2009 was 42% of the 1
population. Extreme (or Indigent) poverty is defined as $ 2.74 per day and
Moderate poverty by $ 4.65 per day.
0
Source: Government of Belize and Caribbean Development Bank (2010).
-1
-2
Economic stagnation, particularly in some key -3
sectors, and natural disasters may have contributed
-4
to an increase in poverty. GDP per capita remained
virtually flat after 2003 because the economy grew -5
Belize
1993-1998
Costa Rica
2001-2006
Dominican Republic
2002-2007
Guatemala
1998-2007
Honduras
2004-2009
Nicaragua
2004-2009
Panama
2001-2006
El Salvador
2001-2006
close to—and at times even below—the annual rate of
growth of the population, estimated around 2.5%. The
food and fuel price crisis and the global economic
recession further aggravated the economic situation of
the country after 2008. Despite the higher food prices,
B40 Annual Growth B40 Annual Growth — Forecast
key agricultural sectors such as bananas, sugar cane,
and papaya witnessed an economic slowdown. Job Source: World Bank staff estimates based on Dollar, D., T. Kleinberg, and A.
creation and employment also decreased across the Kraay (2013). For details see de Piniés and Saldarriaga (2014).
board. In addition to this, several parts of the country
such as Corozal, Orange Walk and Cayo were hit by Shared prosperity may have also worsened in Belize.
severe flooding in 2007 and 2008. These trends may This inference is informed by the contraction implied by
have contributed to increase poverty in the country, decreasing average per capita income in the time period
although it is difficult to affirm if this is really the case (1993-1998) when POVCALNET data was available
in the absence of more recent data. (Figure 8).10 The bottom-40 is mostly situated in rural
areas (Table 2).11 There are also large spatial differences
The available data suggests that observed poverty in the incidence of poverty in Belize. While extreme and
levels in the past remained high in spite of a
significant amount of resources spent on social
10 Previous poverty measures that date back to 1995 are
protection (estimated to be in excess of 5% of GDP in deemed not comparable to those produced in 2002 and 2009
2010). This spending has not translated into results, because the adult equivalency is calculated differently.
evidenced by the large number of poor families that
11 With limited access to household data for the most recent
remained vulnerable in Belize up to when data was
period, it is not straightforward to know if the income for the
available. The Social Protection System in Belize is bottom 40% grew faster than the mean average of the popu-
inadequate to address the risks these vulnerable groups lation or that for the top 60%.You can also read