CREATING ASSETS FOR THE POOR - DECEMBER 2018 - ANGOLA: SYSTEMATIC COUNTRY DIAGNOSTIC
←
→
Page content transcription
If your browser does not render page correctly, please read the page content below
Public Disclosure Authorized   Public Disclosure Authorized     Public Disclosure Authorized                       Public Disclosure Authorized

                                                DECEMBER 2018
                                                                                    CREATING ASSETS FOR THE POOR
                                                                                                                   ANGOLA: SYSTEMATIC COUNTRY DIAGNOSTIC
Angola Systematic Country Diagnostic
Acknowledgement
This report was led by Utz Pape with guidance received from Johannes Hoogeveen. The core team was
composed of Ambra Avenia and Andrew Zadel, with contributions from Rafael Barroso, Sophia Kan, Luca
Parisotto, Marina Tolchinsky, and Quentin Wood. The work benefited from the guidance and supervision
of Elisabeth Huybens and Pierella Paci as well as Mazen Bouri, Carine Cert, Issa Diaw, Olivier Godron, and
Olivier Lambert.
New analyses conducted for the Systematic Country Diagnostic and integrated in the report are featured
in the annex as stand-alone pieces. The Jobs Diagnostic (lite) was contributed by Supriyo De, Veronica
Michel Gutierrez, and Dino Leonardo Merotto, co-funded by the Country Economic Memorandum led by
Norbert Matthias Fiess. The Gender Analysis was authored by Daniel Kirkwood, with inputs from Clifton
John Cortez. The Risk and Resilience Assessment was led by Catalina Quintero with guidance by Radhika
Srinivasan and prepared by Adam Nelsson. The Climate Change Analysis was prepared by Amelia Midgley
with guidance from Raul Alfara-Pelico and Grzegorz Peszko.
Members of the country team from the various global practices and the Country Management Unit also
contributed significantly to this document.
Natural Capital Raúl Alfaro-Pelico, Maria de Fatima Amazonas, Aniceto Timoteo Bila,
Kristyna Bishop, Benjamin Burckhart, Diego Arias Carballo, Camilo
Lombana Cordoba, Charles Joseph Cormier, Stephanie Gil, Francisco
Igualada, Pier Francesco Mantovani, Tambi Matambo, Amelia Midgley,
Grzegorz Peszko, Mario Rizzolio, and Paul Sithoe
Produced Capital Mustapha Benmaamar, Camilo Lombana Cordoba, Charles Joseph
Cormier, Olivia D’Aoust, Katia Daude, Stephanie Gil, Luciana Harrington,
Andre Herzog, Jumoke Jagun-Dokunmu, Francisco Igualada, Paul Levy,
Pier Francesco Mantovani, Jean-Christophe Maur, Bertrand Murguet, Zaid
Safdar, Zenaida Hernandez Uriz, and Gero Verheyen
Entrepreneurial Capital Mazen Bouri, Katia Daude, Luciana Harrington, Zenaida Hernandez Uriz,
Jumoke Jagun-Dokunmu, Paul Levy, Xavier Muron, and Gero Verheyen
Human Capital Carmen Carpio, Supriyo De, Emily Elaine Gardner, Daniel Kirkwood, Eric
Zapatero Larrio, Dino Merotto, Emma Mercedes Monsalve Montiel, and
Andrea Vermehren
Institutional Capital Rafael Chelles Barroso, Nicoletta Feruglio, Norbert Matthias Fiess, Kjetil
Hansen, Catalina Quintero, Radhika Srinivasan, and Melanie Trost
Social Capital Kristyna Bishop, Benjamin Burckhart, Nicoletta Feruglio, Kjetil Hansen,
Daniel Kirkwood, and Mario RizzolioAngola Systematic Country Diagnostic
Table of Contents
EXECUTIVE SUMMARY ....................................................................................................................... I
A. CONTEXT AND HISTORY ............................................................................................................. 1
B. ANGOLA'S WEALTH.................................................................................................................... 5
UNDERSTANDING GROWTH IN ANGOLA ............................................................................................................. 5
MACROECONOMIC INSTABILITY AND FISCAL IMBALANCE ..................................................................................... 12
WEAK PRIVATE SECTOR GROWTH.................................................................................................................... 21
C. POVERTY AND EQUITY ..............................................................................................................29
THE POOR HAVE SEEN LITTLE BENEFIT FROM RECENT ECONOMIC GAINS ................................................................. 29
THE RURAL POOR SUFFER FROM DISPROPORTIONATELY BAD HEALTH OUTCOMES .................................................... 33
LOW EDUCATION LEVELS LIMIT ECONOMIC OPPORTUNITIES, ESPECIALLY FOR WOMEN ............................................. 36
THE RURAL POOR REMAIN LARGELY SELF-EMPLOYED IN THE AGRICULTURE SECTOR .................................................. 39
D. GOVERNANCE...........................................................................................................................42
INSTITUTIONAL CENTRALIZATION UNDERMINES EFFECTIVE SERVICE DELIVERY.......................................................... 44
CITIZENS TRUST SUFFERS FROM OPACITY IN INSTITUTIONS ................................................................................... 46
WEAK LAND RIGHTS IMPEDE URBAN AND RURAL DEVELOPMENT .......................................................................... 48
GENDER GAPS ARE A MAJOR CHALLENGE.......................................................................................................... 49
LIMITATIONS TO CIVIL SOCIETY HINDER CIVIC ENGAGEMENT ................................................................................ 51
THE SOCIAL CONTRACT IS VULNERABLE ............................................................................................................ 52
E. DEVELOPMENT PRIORITIES .......................................................................................................54
THE NEED FOR DIVERSIFICATION AND CAPITAL ACCUMULATION............................................................................ 54
BINDING CONSTRAINTS AND EFFECTIVE PRIORITIZATION ..................................................................................... 56
IMPROVING GOVERNANCE AND MACRO-STABILITY ............................................................................................. 59
CREATING PRODUCTIVE OPPORTUNITIES FOR ECONOMIC DIVERSIFICATION............................................................. 62
BUILDING HUMAN CAPITAL ............................................................................................................................ 67
CROSS-CUTTING THEMES .............................................................................................................................. 70
REFERENCES ....................................................................................................................................72Angola Systematic Country Diagnostic List of Figures Figure A.1. Oil and Agricultural Production in Angola from 1961 to 2015 ................................................... 2 Figure B.1. Estimating ANS for Angola (2015)............................................................................................... 7 Figure B.2. Trends in ANS for Sub-Saharan Africa from 1995 to 2015 ......................................................... 7 Figure B.3. Trends in ANS for Angola from 1990 to 2016 ............................................................................. 8 Figure B.4. Growth of Output per capita and Factor Accumulation, 1961–2014 ....................................... 10 Figure B.5. Source of Growth, 1961–2014 .................................................................................................. 10 Figure B.6. Annual Contribution to per capita Value Added by Sector ...................................................... 11 Figure B.7. Value Added per Worker by Sector, 2008–2014 ...................................................................... 11 Figure B.8. Product Concentration in International Trade ......................................................................... 13 Figure B.9. Market Concentration in International Trade .......................................................................... 13 Figure B.10. GDP per capita in US$ PPP (2010; left) and GDP per capita Growth ...................................... 14 Figure B.11. Oil Prices (US$ per bbl, LHS) and Oil Revenues (% of GDP, RHS), 2004–2017 ........................ 15 Figure B.12. Current Account Balance (% of GDP) and Gross International Reserves (US$) ...................... 15 Figure B.13. Current Revenues: Oil versus Non-Oil (% of GDP), 2004–2017 .............................................. 16 Figure B.14. Revenues, Expenditures, and Primary Balance, 2004–2017 (% of GDP) ................................ 16 Figure B.15. GDP Sectorial Composition, 2004–2015 (% of GDP)............................................................... 17 Figure B.16. Public Debt (% of GDP), 2004–2023 ....................................................................................... 17 Figure B.17 Government Expenditure ........................................................................................................ 18 Figure B.18. Primary Expenditure Composition, 2014–2017...................................................................... 18 Figure B.19. Tax Revenue, Non-oil, 2014 .................................................................................................... 19 Figure B.20. Ease of Doing Business Scores ................................................................................................ 22 Figure B.21. Maize Yields ............................................................................................................................ 26 Figure B.22. Wheat Yields ........................................................................................................................... 26 Figure C.1. Percentage and Number of Population Living below US$1.90 PPP (2011) .............................. 30 Figure C.2. Urbanization, Poverty, and Population Share (size of circle) in 2014, by Municipalities ......... 31 Figure C.3. Evolution of Inequality .............................................................................................................. 31 Figure C.4. Inequality Decomposition for Urban/Rural .............................................................................. 31 Figure C.5. Population Growth Rates .......................................................................................................... 32 Figure C.6. Urban and Rural Population (percentage) ................................................................................ 32 Figure C.7. Health Indicators for Angola and its Income Peers .................................................................. 34 Figure C.8. Life Expectancy (years) ............................................................................................................. 34 Figure C.9. Death from Communicable Diseases (percentage of deaths) .................................................. 34 Figure C.10. Access to Water (2015) ........................................................................................................... 36 Figure C.11. Access to Sanitation (2015)..................................................................................................... 36 Figure C.12. Primary School Enrollment (net, percentage of primary school age children, 2011) ............ 37 Figure C.13. Secondary School Enrollment (gross, 2011) ........................................................................... 37 Figure C.14. Literacy (read and write), School Attendance, and Highest Educational Attainment ............ 38 Figure C.15. Highest Level of Education (ages 15–49) ................................................................................ 39 Figure C.16. Girls Not in Primary School (percentage) ............................................................................... 39 Figure C.17. Agriculture as Main Industry................................................................................................... 40 Figure C.18. Unemployment Rate, 2014 ..................................................................................................... 40 Figure C.19. Labor Force Participation by Gender, ages 15–64 .................................................................. 40 Figure C.20. Employment Types, and by Gender, Age 15–64..................................................................... 40 Figure D.1. Governance Indicators for Angola from 2000 to 2015 ............................................................. 43 Figure D.2. Expenditure Trends by Level of Government in Kz, 2008–2016 .............................................. 45
Angola Systematic Country Diagnostic

Figure D.3. Disaggregated Recurrent Expenditure by Level of Government in Kz, 2016 ........................... 45
Figure D.4. Quality of Judicial Processes Index in Angola and Comparator Economies ............................. 47
Figure D.5. Indicators on Prevalence and Acceptance of Gender-Based Violence (GBV) in Angola and
Selected Countries ...................................................................................................................................... 50
Figure D.6. Victims of GBV .......................................................................................................................... 51
Figure E.1. Binding Constraints to Reach Shared Prosperity and Poverty Eradication ............................... 57
Figure E.2. Proposed Pathways to Development........................................................................................ 58

List of Tables
Table B.1. Typology of Countries Classified by ANS ...................................................................................... 9
Table C.1. Progress in Development Indicators .......................................................................................... 30
Table E.1. Evolution of Angola’s Wealth ..................................................................................................... 56
Table E.2. Ranking of Areas of Intervention by Development Pathway ..................................................... 59
Angola Systematic Country Diagnostic

Abbreviations
AJAPRAZ         Association of Angolan Youth from the Republic of Zambia
AML-CFT         Anti-Money Laundering and Counter-Financing of Terrorism
ANS             Adjusted Net Savings
ATM             Automated Teller Machine
CACS            Councils for Social Consultations
CASA-CE         Broad Convergence for the Salvation of Angola - Electoral Coalition
CBR             Correspondent Banking Relationship
CNIDAH          Commission for Humanitarian Demining and Assistance
CUT             Single Treasury Account
DHS             Demographic and Health Survey
ECCAS           Economic Community of Central African States
Endiama         Empresa Nacional de Diamantes de Angola
FAO             Food and Agriculture Organization
FAOSTAT         Food and Agriculture Organization Statistical Databases
FCV             Fragility, Conflict, and Violence
FDI             Foreign Direct Investment
Ferrangol       Empresa Nacional de Ferro de Angola
FGT             Foster-Greer-Thorbecke Headcount Ratio
FNLA            National Front for the Liberation of Angola
GBV             Gender-Based Violence
GDP             Gross Domestic Product
GNI             Gross National Income
GoA             Government of Angola
GP              Global Practice
GSM             Global System for Mobile Communications
HDI             Human Development Index
I2D2            International Income Distribution Dataset
IBEP            People's Well-being Inquiry
ICSID           International Center for Settlement of Investment Disputes
ICT             Information and Communication Technology
IDR             Integrated Data Repository
IFC             International Finance Corporation
IGF             General Inspectorate of Finance
IMF             International Monetary Fund
INAPEM          National Institute to Support Small and Medium Enterprises
INDC            Intended Nationally Determined Contribution
INE             National Institute of Statistics
LDC             Least-Developed Country
LMIC            Lower-Middle-Income Country
MAG             Mines Advisory Group
MDG             Millennium Development Goal
MIGA            Multilateral Investment Guarantee Agency
MINAGRIF        Ministry of Agriculture and Forestry
MPDT            Ministry of Planning and Territorial Development
Angola Systematic Country Diagnostic

MPLA       People’s Movement for the Liberation of Angola
MSMEs      Micro, Small, and Medium Enterprises
NDP        National Development Plan
NNS        Net National Savings
NPA        Norwegian People’s Aid
OECD       Organisation for Economic Co-operation and Development
OPDA       Fundo do Diferencial do Preço do Petróleo (Oil Price Differential Account)
OPEC       Organization of Petroleum Exporting Countries
PFM        Public Financial Management
PIM        Public Investment Management
PIP        Public Investment Program
PPP        Purchasing Power Parity or Public-Private Partnership
RRA        Risk and Resilience Assessment
SACU       Southern African Customs Union
SADC       Southern African Development Community
SCD        Systematic Country Diagnostic
SIGFE      Integrated Management Information System
SIPIP      Integrated Public Investment Management System
SMEs       Small and Medium Enterprises
SNCP       Serviço Nacional da Contratação Pública
SOE        State-Owned Enterprise
Sonangol   Sociedade Nacional de Combustíveis de Angola, E.P.
TFP        Total Factor Productivity
TVET       Technical and Vocational Education and Training
UNDP       United Nations Development Programme
UNICEF     United Nations Children’s Fund
UNITA      National Union for the Total Independence of Angola
UPA        Union of the Peoples of Angola
VAT        Value Added Tax
WHO        World Health Organization
WRM        Water Resources Management
EXECUTIVE SUMMARY
Angola is endowed with significant natural wealth, but it will need to better manage these resources
and reinvest them into other forms of capital to establish a sustainable development path. Before
independence, the country was a relatively advanced economy with diverse exports, although its
population suffered under exploitative colonial rule. Decades of conflict, during the fight for
independence and the civil war that followed, exacted a heavy toll on the population, infrastructure, and
the economy. The end of the war in 2002 and a booming oil industry resulted in strong economic growth,
but the poor saw very little benefit from this economic prosperity. The dependence on oil exports has
created macroeconomic instability, and Angola has suffered periods of fiscal contraction due to
fluctuations in commodity prices. Although the country has enjoyed strong gross domestic product (GDP)
growth, this has been achieved by depleting natural capital for consumption, rather than reinvestment in
other types of capital to generate sustainable growth. The recent change in leadership represents a
window of opportunity for political and economic reform that will allow Angola to put itself on a path
toward sustainable development.
The Systematic Country Diagnostic (SCD) for Angola identifies pathways and priorities to eradicate
poverty and boost shared prosperity by 2030. After providing the historical context of Angola, the SCD
applies the concept of the “Changing Wealth of Nations” and identifies four binding constraints for Angola
to reach the World Bank’s twin goals. Oil dependency in conjunction with a low global oil price creates
macroeconomic and fiscal imbalances, constraining sustainable growth and poverty reduction in Angola.
A weak private sector is unable to provide a sustained growth momentum, further constraining growth
and poverty reduction. The poor remain excluded from growth, limiting realized growth, but more
importantly, manifesting high poverty levels. Finally, weak governance is a cross-sectoral binding
constraint contributing to unsatisfactory policy outcomes. The SCD ranks areas of intervention for each
binding constraint and selects the top 10 priorities to overcome the binding constraints. With a new
government in place, Angola is at a critical juncture to pursue a sustainable development path to reach
poverty eradication and shared prosperity. Based on the presented analysis, the 10 prioritized areas of
intervention will help reach this goal.
Data gaps for Angola, in terms of availability, quality, and timeliness of data, make comprehensive,
evidence-based decision making difficult. Information is lacking in several key areas, including both
fundamental macroeconomic and microeconomic indicators, as well as sector-specific data for
agriculture, urbanization, water, and entrepreneurship. Partly due to these data gaps, key analytical work
for Angola is missing. The most recent poverty estimates are from 2008, but without an accompanying
Poverty Assessment. The last Country Economic Memorandum is from 2007. No Jobs Diagnostic is
available. This report fills these gaps by utilizing new analytical work conducted for the SCD as well as an
early draft of the Country Economic Memorandum currently under preparation.
The people of Angola suffered more than 40 years of almost constant conflict, first in opposition
to Portuguese colonial rule and later in a devastating post-independence power struggle, but now
there is new hope emanating from the new President João Lourenço.
The Republic of Angola is rich in natural endowments and is the third-largest economy in Sub-Saharan
Africa. The country has a population of about 26 million, with over 27 percent living in the Luanda Province
that is home to Angola’s capital city. About 37 percent of the population live in rural areas. Angola is the
second largest oil producer in Africa, after Nigeria, and owns substantial diamond deposits. The country
also has major productive potential for agriculture and fisheries.

                                                     i
Angola Systematic Country Diagnostic
Portuguese colonization created a thriving export economy, but Angolans worked under exploitative
conditions and were excluded from the benefits of growth. Attracted by its strong economic growth in
the 1960s, Luanda became the second largest settler presence in Sub-Saharan Africa after South Africa.
Local laborers were however working under exploitative conditions, and companies relied heavily on
foreign workers for tasks requiring technical skills. The absence of any meaningful skills transfer created
a dependency on foreign workers that is still very much evident today.
Independence movements brought independence in 1975, but the country fell back into civil conflict
soon after. In 1974, after 13 years of war against the colonial power, a military coup in Portugal triggered
the Carnation Revolution. Angola's three main military and political parties agreed to negotiate in unity
with the Portuguese. The country gained independence in 1975. However, the unity government quickly
fell apart and the civil war began.
The government led by the People's Movement for the Liberation of Angola (MPLA) embraced a
command-economy, inducing rapid and large-scale nationalization. Those policies, as well as the
independence war and the ongoing civil war, led to the departure of most foreign companies and their
expatriate workers, who occupied most technical, managerial, and government jobs. This loss of technical
and managerial experts severely damaged or eliminated most modern industrial production. Corruption
and an inefficient use of public funds further disrupted economic output. Only in 1990 did the government
formally abandon Marxism and declared Angola to be a social democracy.
The cost of the civil conflict was immense, with the country’s infrastructure and institutions left in
shatters. Between half a million and a million people were killed, with uncounted numbers wounded and
maimed. An estimated 3.7 million people became refugees or were internally displaced, often migrating
to the cities. The social costs were also enormous as an entire generation of Angolans were left without
proper schooling and health care. The depopulation of the rural areas further entrenched regional
disparities that began with the focus on coastal areas during the colonial period.
Angola experienced sustained economic growth following the end of war in 2002, until a drop in
international oil prices triggered an economic crisis in 2014. Fueled by high oil production and oil prices,
Angola’s GDP per capita doubled from US$2,079 in 2002 to US$4,164 in 2014. The sustained growth
established the Republic of Angola as the third largest economy in Sub-Saharan Africa and the second
largest oil producer in Africa. However, the 2008 and the 2014 commodity price shocks showed structural
weaknesses of Angolan economy due to a lack of economic diversification and consequent natural
resource fiscal dependency. Since 2014, a structurally low oil price deprived Angola’s growth momentum
and created large macroeconomic imbalances.
5,000 30
3,000 20
10
1,000
0
-1,000
1970
1972
1974
1976
1978
1980
1982
1984
1986
1988
1990
1992
1994
1996
1998
2000
2002
2004
2006
2008
2010
2012
2014
-10
-3,000 -20
-5,000 Relapse of Peace -30
Oil Price Crises
Independence Civil War Agreement
Angola GDP pc in US$ PPP (left) Angola GDP pc growth (right) World GDP pc growth (right)
Note: PC = per capita; PPP = Purchasing Power Parity.
iiAngola Systematic Country Diagnostic
The 38-year presidency of José Eduardo dos Santos ended in 2017, allowing a new government under
the leadership of João Lourenço to tackle the imminent development challenges. After the civil war, the
victorious MPLA consolidated power extending its narrative from accomplishing independence to ending
the long civil war. In September 2017, following parliamentary elections, João Lourenço was inaugurated
as President, marking the first peaceful political transition since independence. His popularity has soared
because of his commitment to tackling corruption and repatriating illicit financial flows, as well as
delivering long-promised economic, political, and social reforms such as strengthening competition and
furthering decentralization.
Angola has the worst disinvestment rate of any Sub-Saharan African country and has relied
largely on the exploitation of natural resources for growth.
Angola has experienced very strong growth in recent years, but this has not translated into sustainable
investments to help the poor. The main barrier for equitable, long-term growth has been the inability of
the government to convert the country's considerable natural resource wealth into other forms of capital.
Resources in Angola have been used to increase consumption but have not been reinvested with a view
to long-term development.
On average, countries in Sub-Saharan Africa have tended toward disinvestment. GDP can be a
misleading indicator, as asset liquidation will increase GDP while depleting the resource base of a country.
The changes in the wealth of a nation are better measured by adjusted net savings (ANS), a metric that
indicates whether a country is investing sufficiently today for future development. ANS is a measure of
gross national saving minus depreciation of produced capital, depletion of natural capital, plus public
expenditures for education. For Sub-Saharan Africa, gross national saving is estimated at just under 20
percent of gross national income (GNI) in most years. Natural resource depletion is one of the key drivers
of dissaving in the region.
Angola has the worst rate of disinvestment in Sub-Saharan Africa. Resource-rich countries tend to have
negative saving because they exploit their natural resources to increase current income, but at a cost for
future development. Angola's ANS remained strongly negative for almost all years since 1990. From 1990
to 2015, it was the lowest in the region at −67.8 percent of GNI, followed by Republic of Congo at −49.8
percent and Equatorial Guinea at −38.8 percent. No Sub-Saharan African country has a worse
disinvestment rate than Angola, and more than half of these countries had positive investments in their
wealth between 1990 and 2015.
iiiAngola Systematic Country Diagnostic
150
100
50
0
% of GNI
-50 1990 1995 2000 2005 2010 2015
-100
-150 Consumption of fixed capital Education expenditure
-200 Natural resource depletion Pollution damages
-250 Gross national savings Adjusted net savings
Angola is still highly reliant on natural resources and is lacking human capital, 1 especially in comparison
to upper-middle-income countries. Angola’s wealth composition is similar to Sub-Saharan African
countries, even though it relies more on natural capital (38 percent versus 36 percent in 2014) while
staying behind in human capital (41 percent versus 50 percent in 2014). Comparing Angola to its peers in
terms of income, however, Angola performs considerably worse. Lower-middle and especially upper-
middle-income countries rely much less on natural resources (27 percent and 17 percent in 2014)
compensating with considerably higher human capital shares (51 percent and 58 percent in 2014). The
absence of a considerable trend in Angola to accumulate human capital since 1995 is particularly
worrisome, as countries increase their share of human capital with development.
Poverty reduction and employment growth have not been responsive to economic expansion, creating
the need of a new job-centered growth paradigm. From 1992 to 2015, real value added increased by 229
percent, while employment increased by only 116 percent. Angola's booming oil industry contributed
significantly to national output but was not able to create many new jobs. The elasticity of employment
growth to economic growth was particularly low (0.13) between 2003 and 2008, when oil prices were
rising and GDP growth was extremely high. The disproportionate distribution of employment and
productivity across sectors is worrisome. Productivity dwindles in the sectors that concentrate the most
workers—agriculture and services—and is drastically higher in capital-intensive industries that have
limited capacity to generate jobs. The challenge will be to create more productive jobs for the burgeoning
youth population, who are better educated and are not finding good jobs.
A reliance on natural resource exploitation as the main driver of growth has brought excessive
macroeconomic volatility to Angola, representing the first binding constraint for economic
development.
Angola’s economy is highly dependent on revenue from oil exports. A reliance on natural resource
exploitation as the main driver of growth has generated excessive macroeconomic volatility, becoming a
binding constraint to economic development. A volatile economic environment makes it difficult for
economic agents to make decisions about investment and resource allocation. The economic
concentration around oil production, coupled with unstable oil prices, creates volatility that is passed on
to key macroeconomic variables such as GDP growth, inflation, exchange rates, and debt.
The dependence on oil is not sustainable and has limited the diversification of the country’s economy,
constraining growth. Angola is currently the second largest oil producer in Sub-Saharan Africa, but its
1Human capital is a population’s health, skills, knowledge, experience, and habits (Becker 1964). More and better investments in human capital
are now widely recognized not only as having intrinsic value but as essential for growth and competitiveness. World Bank (Forthcoming)..
ivAngola Systematic Country Diagnostic
proven reserves are limited. In 2017, oil production reached 1.64 million barrels per day, almost on par
with Nigeria’s 1.66 million barrels per day. However, Angola's oil production is not sustainable as its
reserves are expected to be exhausted by 2032. Oil dependence has been a lasting feature of the
economy, and petroleum products have comprised between 87 percent and 98 percent of total annual
exports since 1990. The dependence on oil prevents the country from enjoying the benefits of economic
diversification, including trade openness and export diversification leading to higher growth.
Oil price volatility has caused cycles of boom and bust. From 2004 to 2008, higher oil prices generated
budget surpluses and allowed for declining debt ratios. Oil revenues rose rapidly, going from 24.3 percent
of GDP in 2004 to 35.2 percent of GDP in 2008. Current expenditures and investments increased
significantly on the back of booming oil revenues, and investments grew by more than sixfold over that
period. When oil prices fell sharply in 2008 and 2009, the instability brought by excessive oil dependence
became painfully evident for Angola. The country’s current revenues shrank by almost two-thirds and the
current account balance flipped from a surplus of 8.1 percent of GDP to a deficit of 11.7 percent in the
following year. After a second period of oil-fueled growth between 2009 and 2013, with GDP growth rates
averaging 5.1 percent per year, oil prices declined in 2014 even further and remained low for a longer
time. Angola’s GDP growth fell to zero in 2016. The Central Bank pursued a policy mix of exchange rate
devaluations and quantity controls that ended up hurting business and was ineffective in taming inflation,
which peaked at 42 percent in 2016. Later, the re-pegging of the kwanza and tightening of monetary
conditions were effective in controlling inflation, and it dropped below 20 percent before the end of 2018.
The fiscal impact of the oil price collapse was also substantial and forced significant fiscal adjustment.
Weak fiscal policy increases vulnerability to commodity price fluctuations, although recent fiscal
consolidation efforts have had some success. After the oil price drop in 2014, oil revenues more than
halved in one year down to only 9.4 percent of GDP in 2015. Faced with a primary budget deficit, the
government significantly cut current expenditures and investments. With a difficult debt situation and
declining oil production, Angola needs to pursue a gradual but consistent fiscal consolidation by boosting
non-oil revenues while moderately increasing selected social expenditures. The government has pursued
a reduction in spending, with current expenditure as a share of GDP falling from 29.4 percent in 2014 to
20.7 percent 2017. Furthermore, inflation caused a reduction in public wages as a share of GDP and
spending on subsidies was reduced. Despite this progress, expenditure composition and expenditure
efficiency still have considerable room for improvement. Relative to peers, Angola still overspends on
subsidies and underspends on agriculture, education, health, and social protection.
Debt sustainability has become a challenge. The debt-to-GDP ratio reached 65.3 percent in 2017, almost
double its 2013 level. This reflected large financing gaps since 2014, but also the effect of the currency
devaluation on the large share of the debt denominated in foreign currency. Debt has not only reached
high levels by emerging markets standards, but the speed of accumulation, the large gross financing needs
in the coming years, and the deteriorating composition have become a challenge. These risks are
compounded by weak debt management practices and poor communication and transparency with the
market. Currently, debt remains sustainable in a baseline scenario, but with increased risks to growth,
exchange rate, oil price, and contingent liability shocks.
The low level of tax collection imposes limitations to the revenue side of the equation. Tax laws in
Angola are complex and riddled with multiple exemptions. Compliance costs are high, as there are no
mechanisms for simplified tax returns for small and medium taxpayers, who often lack the technical
capacity and scale economies to understand the opaque tax code and fulfill their liabilities. The non-
registration of taxpayers, especially outside Luanda, contributes to low revenue collection and the overall
compliance gap. These shortcomings have resulted in a very narrow non-oil tax base for Angola. Recent
reforms have substantially improved the quality of tax administration, and a value added tax (VAT) will
vAngola Systematic Country Diagnostic
soon be implemented, which could potentially add revenue equivalent to about 1.6 percent of GDP in net
terms.
A lack of growth in the private sector is the second binding constraint for economic development,
limiting the potential of sectors like agriculture and manufacturing.
Angola's private sector is defined by weaknesses concerning available inputs, factors of production, and
the role of institutions. There continue to be major impediments to large-scale foreign investment, and
reforms will need to be enacted to improve competitiveness and facilitate the financing of new business
initiatives. The country possesses significant non-oil endowments that were previously exploited but saw
productivity plummet due to conflict. Such areas of economic potential include agriculture, mining,
fisheries, manufacturing, and information and communication technology (ICT). These represent
important opportunities for Angola, and a fair and freely competitive private sector can help feed their
growth.
Government influence in the productive economy is still pervasive, crowding out the growth of the
private sector. Large segments of the economy in Angola are not only controlled by state-owned interests
but also by actors that are associated with political parties and the security forces. The Government of
Angola (GoA) holds billions of dollars in real estate and productive assets, distributed across line
ministries, or in the hands of state-owned enterprises (SOEs). The SOE sector in Angola is inefficient and
has only been profitable owing to oil revenues. Without oil revenues from Angola’s state-owned national
oil company, the SOE sector would have posted net losses of approximately US$200 million in 2012. SOEs
operate in traditional public services, such as electricity and water, but they also exist in the sectors of
transportation, telecom, and media. The large presence of inefficient SOEs limits opportunities for the
entry of most cost-effective private initiatives.
The weak business climate is an impediment to private investment. The formal private sector in Angola
is small and is concentrated in commerce and services in Luanda. Foreign investment is weak outside of
oil and gas—82 percent of total international investment flows between 2003 and 2017 were
concentrated in oil and natural gas, while agribusiness received a mere 6 percent. Foreign investors were
deterred by a restrictive visa regime and investment policy, as well as forex restrictions that impeded
profit repatriation. Many of these restrictions have been relaxed, as the government steps up its efforts
to attract foreign investors.
Competitiveness is hindered by an unfavorable regulatory environment and high barriers to entry.
Angola ranked 137 out of 140 countries on the Global Competitiveness Index 2018. The economy
continues to suffer from a difficult regulatory environment, a challenging macroeconomic framework,
weak infrastructure, and inadequate human capital. A heavy bureaucracy creates opportunities for
corruption and the discretionary application of regulations, although the newly elected President has
taken concrete steps to improve the business climate. Market contestability is very low and barriers to
entry are high. Firms in Angola operate with very high input costs including self-generated electricity.
Market distortions through subsidies and tariffs are also common. Difficult import and export procedures
undermine Angola’s ability to join regional and global value chains.
Failing and inadequate infrastructure is an impediment to economic growth. Only 17 percent of
classified and urban roads are paved, and more than 70 percent of the country's road network was in an
advanced state of deterioration at the end of the civil war. The rural accessibility gap is a serious
impediment to growth, as road density remains very low, feeder roads are few, and bridges are lacking.
The transportation gap also makes it difficult for the country to develop regional trade and discourages
its neighbors from making greater use of the country’s ports. The government has committed to major
public expenditure in power production to keep up with growing demand. Only an estimated 34 percent
viAngola Systematic Country Diagnostic
of the population has access to electricity at the national level and only 10 percent have access in rural
areas. An inadequate and inconsistent power supply restricts private sector growth, as many businesses
are forced to adopt a system of self-generation.
Agriculture is a major sector of the Angolan economy, although productivity is low, and the country's
abundant resources remain underutilized. Agriculture accounted for roughly 12 percent of Angola’s GDP
in 2016, and in 2014, it was estimated that almost 68 percent of the country’s economically active adults
worked in the sector. The country has an abundance of land and water, as well as the diverse climatic and
soil conditions needed to produce a large variety of foods. Of Angola’s 57.4 million hectares of agricultural
land, only about 8 percent to 14 percent is currently being used. Agricultural productivity is very low due
to a lack of mechanization, undeveloped input markets, and poor road infrastructure. Productivity growth
is being held back by a limited access to agricultural finance, an insufficient use of fertilizer, a lack of
market information, and an absence of food processing facilities. Failing infrastructure limits access to
both domestic and international markets.
The exclusion of the poor from the benefits of growth is the third binding constraint for the
development of Angola, as weak human capital outcomes constrain economic expansion and
equity.
One of the strongest engines of long-run growth will be investment in human capital. The benefits of
the oil boom have accrued to only a small part of the population, and Angola will have difficulty
maintaining growth rates over time if the gap continues to widen between those with and without access
to socioeconomic opportunities. The productivity of Angola’s future workers will be seriously impeded by
shortcomings in health and education. The World Bank’s Human Capital Index provides a simple,
composite measure of the expected human capital of the next generation in a given country, combining
indicators of survival, schooling, and health. On a scale of 0 to 1, Angola’s Human Capital Index was 0.36
in 2018, pointing to weak education and health outcomes that limit the opportunities of the poor. While
dimensions of, and factors behind such a low level of human capital are wide-ranged, adequate
investments and delivery mechanisms in health, education, sanitation, and social protection are key
ingredients.
The poor have seen little benefit from recent economic growth, and nearly a third of Angolans still live
in poverty. In the decade after the end of the civil war, GDP per capita nearly doubled, from US$2,293
(PPP) in 2000 to US$4,164 in 2014. This impressive expansion of the economy nonetheless did very little
to reduce poverty. The proportion of people living below the US$1.90 poverty line showed only a small
decline, from 32.3 percent in 2000 to 28.0 percent in 2014. Rapid population growth and increasing urban
poverty meant that the absolute number of poor in Angola increased from 4.9 million to 6.7 million over
this period.
viiAngola Systematic Country Diagnostic
2000– Most
Indicator 2005 Recent Year
60% 30 Population (million) 14.7 25.8 2016
Millions (below US$ 1.90)
Population ≤ 20 years 60% 57% 2016
Fertility rate 6.5 5.7 2016
40% 20 Population below poverty line
US$1.90 a day 32% 28% 2014
Population below poverty line
US$3.10 a day 54% 55% 2014
20% 10 Life expectancy at birth 42.4 52.6 2015
Under-five mortality (per 1,000
live births) 250 68 2015
0% 0 HIV/AIDS prevalence 3.9% 2.2% 2015
Population knowing 3 ways of
2000 2008 2014* avoiding HIV 18% 45% 2014
No. of non-poor (right) No. of poor (right) Adult literacy rate 33% 71% 2015
Maternal mortality rate 705 477 2015
Poverty Rate (FGT0, left) Urban FGT0 (left) Net primary school attendance
rate 56% 84% 2011
Rural FGT0 (left)
HDI rank (of 177 countries) 166 150 2014
Gini coefficient (income, 1995) 0.54 0.47 2014
Note: HDI = Human Development Index. FGT= Foster-Greer-Thorbecke Headcount Ratio.
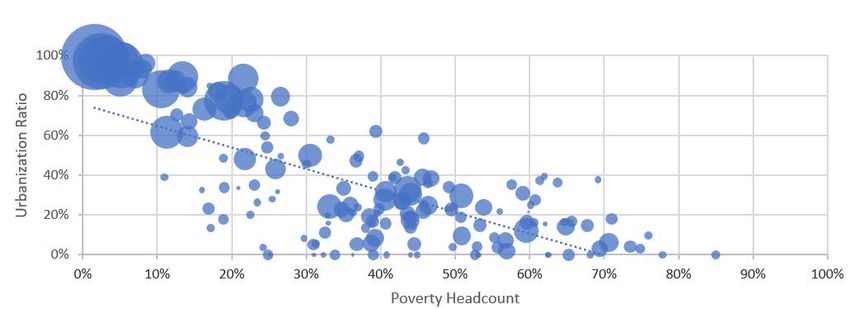
The rural and slum populations have been particularly excluded from economic growth. About two-
thirds of the poor live in rural areas, where poverty is widespread due to weak connectivity, lack of basic
services (electricity, water, sanitation, and so on), and an absence of markets. While migration to urban
areas can help to improve livelihoods, the continuing increase of urban inequality shows the limitations
of this solution. While slums are economically vibrant, many activities are informal and of limited
productivity.
Social protection spending in Angola has been significantly reduced and is well below levels in
comparator countries. Social protection spending decreased on average 20 percent per year, from 7.8
percent of GDP in 2010 to 2.2 percent of GDP in 2016. The bulk of this decrease came from the reduction
of energy subsidies that have historically represented a large share of the national budget. Spending on
social assistance (war-related pensions and transfers targeting the poor) remains weak, roughly a quarter
of the level of other lower-middle income countries. While spending on benefits for veterans and victims
of the war has decreased by 43 percent in real terms between 2015 and 2016, nonwar social assistance
fell by 85 percent. The GoA has shown its determination to build a strong social safety net, but weak
targeting continues to hinder its effectiveness.
The rural poor continue to suffer from disproportionately bad health outcomes. Angola’s recent growth
has helped improve the health of its population, but indicators still lag far behind those of other middle-
income countries. The rural poor, in particular, still contend with very low access to health care compared
to those who are able to afford private care. Access to services is also a problem, with pregnancy health
checks and delivery services available in only 25 percent of rural facilities.
viiiAngola Systematic Country Diagnostic
Maternal Mortality Ratio Infant Mortality Rate
1500 150
per 100,000 live births
per 1,000 live births
1000 100
500 50
0 0
1990 2000 2010 2015 1980 1990 2000 2010 2015
Angola Upper middle income Lower middle income
Angola Upper middle income Lower middle income
Angola suffers from a scarcity of trained health care professionals, low public health expenditure, and
weak investment in water and sanitation. Angola has only 1 physician, less than 23 health care workers,
and 63 nurses per 10,000 people. Rural areas are the worst hit by this scarcity, as 85 percent of health
care workers are concentrated in the capital. Poor training and education contribute to low quality health
care services in the country. Public health expenditure has been declining, dropping from 2.6 percent of
GDP in 2013 to just 1.5 percent of GDP in 2015, and remains far behind the Sub-Saharan average of 5.4
percent. Limited access to improved water, sanitation, and hygiene services has detrimental public health
consequences such as through waterborne diseases and child stunting. Nationally, only 41 percent of the
population has access to basic or improved drinking water services (63 percent in urban areas and 24
percent in rural areas) and 39 percent to an improved sanitation (62 percent in urban areas and 21 percent
in rural areas).
The government commits insufficient resources to education, and low education levels limit economic
opportunities especially for the rural population and women. Despite some improvements over the last
years, many children remain outside the school system, with net primary enrollment rates of only 66.4
percent for girls and 88.8 percent for boys. School attendance and school enrollment demonstrate an
inequality of opportunity for the rural population as well as for women. There is a strong relationship
between years of education and participation in paid employment, and investments in education can help
strengthen Angola’s economic development. Of workers who completed secondary school, 70.2 percent
are in paid positions. In contrast, only 9.2 percent of workers without an education are engaged in paid
work. Quality of education is also a problem, and the government has not committed sufficient resources
to improving the situation. At about 3 percent of GDP, Angola’s education spending is lower than the 4.4
percent average for Sub-Saharan Africa. More and better investments are required to meet the needs of
the underfunded education system and boost the quality of the education being provided.
Weak governance is the final, cross-cutting binding constraint for Angola, hindering institutional
capacity and jeopardizing the existing fragile social contract.
The political system has historically been characterized by discretionary decisions, rampant corruption,
and crony capitalism, constraining private sector growth and contributing to the exclusion of the poor.
Following their victory in the civil war, the MPLA governed the country with weak checks and balances in
a dominant discretionary presidential system. Oil revenue windfalls allowed substantial discretionary
spending, ensuring loyalty at the cost of institutional efficiency and rule of law. The result has been a weak
ixAngola Systematic Country Diagnostic
political system with limited accountability, low effectiveness, and rampant corruption. Together with the
heritage of state-led development, this has created a form of crony capitalism in which the private sector
is dominated by state-run and state-linked companies. Private sector growth has thus been constrained,
due to oligopolies, barriers to entry, high operating costs, poor investor protection, and the need to pay
commissions and kickbacks. The new administration has nonetheless taken some visible steps to promote
competition and reclaim public funds lost due to corruption.
Institutional centralization undermines effective service delivery. The Angola administration remains
highly centralized. A process of devolution was started in 2001 but was never completed despite the
recognized necessity for a more independent administration at the local level. Limited capacity at the local
level as well as ineffective coordination mechanisms constrain the decentralization process and its impact.
The new administration has identified as one of its priorities the establishment of a system for the direct
election of representatives at the municipal level. To complement the top-down approach of governance,
efforts have been made for increased community participation in the decision-making process at the
municipal and provincial levels.
The weakness of legal institutions has a negative impact on citizens’ trust. The judiciary function in
Angola is undermined by lack of adequate resources, and extensive political influence limits judicial
independence. Municipal courts function in only 22 of 163 municipalities, and elsewhere crimes and
conflicts are adjudicated by informal tribunals or local police. In 2014, Angola ranked extremely low on
dimensions that track “undue influence” in institutions: 137/144 on judicial independence and 140/144
on favoritism in decisions of government officials. Law enforcement challenges remain widespread due
to a lack of checks and balances, insufficient institutional capacity, and a culture of impunity.
Gender gaps in Angola are large and the challenges are significant. Women have lower access to
productive inputs such as land and credit, both important for success as entrepreneurs and farmers.
Women in Angola are often only able to access land through their husbands or sons, and they are less
likely than men to borrow money to start or expand a farm or business. On a positive note, women are
relatively well represented in political institutions. As of the 2017 elections, 31 percent of seats in the
National Assembly were occupied by women, ranking Angola 47 worldwide. Finally, gender-based
violence (GBV) is a persistent problem. About one-third of women in Angola have experienced physical
violence at some point in their lives, with 22 percent experiencing it during the past year alone. The
economic costs of GBV are high, including costs related to health care, earnings, productivity, taxes, and
justice. While the government has enacted reforms to support victims of GBV, most interventions are
aimed at the response and not prevention.
The social contract is increasingly under stress from the oil price crisis and the growing demands of the
youth. Angola’s social contract has been based on low-level equilibrium in which everyone was better-off
owing to the end of violence after 27 years of civil war. Large revenues from oil allowed the government
to fund this status quo through large public investments, especially in infrastructure, but without
implementing the reforms required for a more inclusive and sustainable development path. A more
youthful population with more than 50 percent below the age of 15 has hardly any direct memories of
the civil war. The idea that a middle-class status was within reach for many was promoted through
government commitments to economic diversification, job creation, and social housing. With the oil crisis
dashing these expectations, the youth increasingly demand better opportunities to escape poverty.
Increasing competitiveness in successive elections points to dissatisfaction, with the MPLA’s results
declining from 82 percent in the parliamentary elections of 2008 to 61 percent in 2017.
The change in leadership represents a window of opportunity for a structural transition. The legitimacy
of the government could be strengthened through a progressive transformation of the long-standing
closed, discretionary political system and its lack of accountability. Joao Lourenço has been leading the
xAngola Systematic Country Diagnostic
GoA since September 2017, and the new leadership has already taken several promising and potentially
far-reaching steps to improve governance. These include new initiatives that aim to relax the control of
the media, clamp down on monopolies, promote transparency in the public sector, modernize and
privatize SOEs, improve the business regulatory environment, eliminate broad-based subsidies in favor of
targeted social assistance, and complete political decentralization with an eye to improved service
delivery.
The binding constraints can be addressed through development pathways that work
synergistically to help reach the twin goals of poverty reduction and shared prosperity by 2030.
Angola must embark on a new inclusive and sustainable development trajectory accumulating wealth
instead of depleting it. In 2014, Angola’s economy was relying on natural capital to contribute a share of
38 percent, as opposed to only 20 percent produced capital and 41 percent human capital. In 2015, oil
accounted for 95 percent of exports, further emphasizing the dependence on natural capital. Given that
its limited oil reserves are expected to be exhausted in the next decade, Angola cannot continue to
consume its natural wealth in this way.
Economic diversification and capital accumulation will be crucial for lessening resource dependence and
fostering growth. Angola has the potential to develop other non-oil industries including agribusiness,
fisheries, mining, and manufacturing. To capitalize on these areas of potential economic expansion,
government policies will need to create incentives for industry growth, such as a better business climate,
improved competitiveness, access to finance, and a reasonable tax burden with low compliance costs.
Capital accumulation will be fundamental to establishing a sustainable growth path. Greater investment
in produced capital, including power, transport, and water infrastructure, will serve to increase
productivity and foster both domestic and international trade in the long run. Greater investments in
human capital, notably more effective public education, health care, sanitation, and social protection
services, will also be essential for increasing labor force participation and boosting productivity. The goal
for Angola should be to convert its natural wealth in an environmentally conscious way into assets for the
poor, in more sustainable forms of wealth, to create an inclusive society on a sustainable development
path.
Better governance is key to a more sustainable economy. Weak governance holds Angola at a low-level
equilibrium and is at the core of Angola’s challenge to reach the twin goals of ending extreme poverty and
boosting shared prosperity. It has led to macroeconomic instability and fiscal imbalance, as the economy
presently lacks the diversification necessary to act as a buffer against external shocks, notably commodity
price fluctuations. Inadequate governance has contributed to weak private sector growth, given that the
private sector is dominated by state-led enterprises and suffers an inefficient regulatory framework. Weak
governance has also exacerbated the exclusion of the poor from the benefits of growth, as widespread
social inequality has not been seriously addressed and the poor continue to be limited in their
participation in productive economic activities and their access to quality basic services. Given where
Angola starts from, it will take time to move from a discretionary to a rules-based system.
xiYou can also read