Republic of South Africa - Contextual analysis of the reference countries - Fostering - Intraw
←
→
Page content transcription
If your browser does not render page correctly, please read the page content below
Fostering
                 international
                raw materials
                 cooperation

Republic of South Africa
Contextual analysis of the
reference countries
December 2015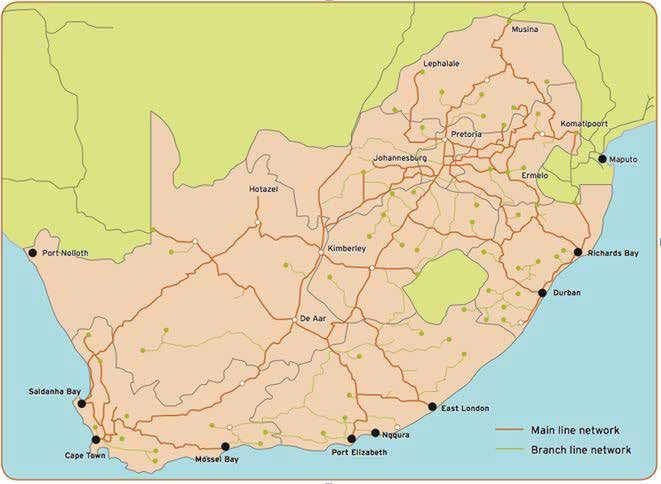
Abstract
The principal objectives of the INTRAW project (http://intraw.eu) are the
mapping of best practices and boosting of cooperation opportunities
related to raw materials between the EU and 5 technologically
advanced non-EU countries (Australia, Canada, Japan, South Africa
and the United States). Each of these five “Reference Countries” is
subject to similar global challenges. This report presents the contextual
analysis of the Republic of South Africa (RSA) in order to explain the
country´s historical economic development during the 20th and 21st
century in general, and in relation to development of primary raw
materials in particular. Three reports focussing specifically on: raw
materials research and innovation; education and outreach; and
industry and trade in the Reference Countries will be the next outputs
from the project to be published. These will underpin the development
of a better understanding of the achievements made in these 5
countries in relation to raw materials research & innovation, educational
and skills programmes, trade, exploration, exploitation, processing,
recycling and substitution.

Author
W. Eberhard Falck (MinPol), Utkarsh Akhouri (MinPol),
Diego Murguia (MinPol).

Acknowledgements
The authors thank Fatheela Brovko, Ray Durrheim, Navin Singh, Emma
Van Garderen and Benita De Wet for their help in reviewing this report,
acknowledge all the Experts who provided very useful insights and
comments to the Summary Report during the Bled Workshop and the
Consortium Partners who also provided valuable input, and thank
Ruth Allington, Dylan McFarlane and Matt Wenham for the English
proofreading.

Disclaimer
This report reflects only the author’s view. The European Commission
is not responsible for any use that may be made of the information it
contains.

    This project has received funding from the
    European Union’s Horizon 2020 research and
    innovation programme under grant agreement
    nº 642130.

2           INTRAW PROJECT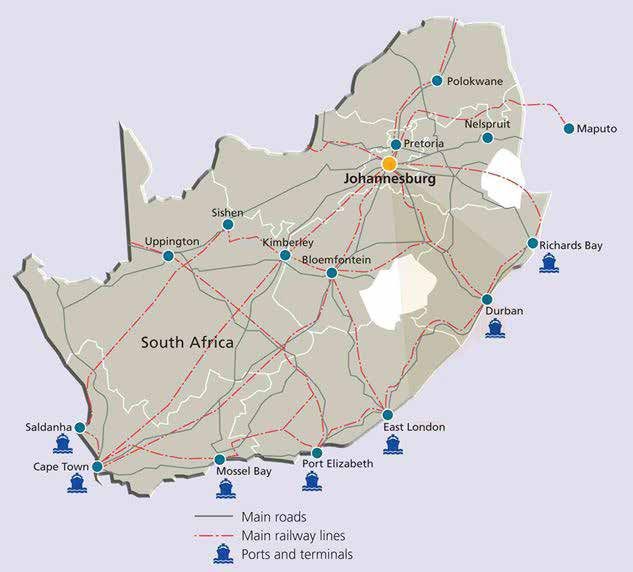
Table of contents

                                                                  Page
1       INTRODUCTION                                                 6
1.1     General                                                      6
1.2     Introduction to Contextual Analysis (WP1, Task 1.1)          6
1.3     Scope of this report                                         6
2       EXECUTIVE SUMMARY                                            8
3       HISTORICAL OVERVIEW ON RAW MATERIALS                        10
4       GEO & ENVIRONMENTAL FACTORS                                 12
4.1     Geographical situation                                      12
4.2     Natural & Mineral resources                                 12
4.3     Water resources                                             13
4.4     Climate                                                     15
4.5     Geological Factors                                          15
4.6     Ecologically sensitive areas                                15
5       SOCIO-CULTURAL FACTORS                                      18
5.1     Historical Background                                       18
5.2     Human geography                                             19
5.2.1   Demographics                                                19
5.2.2   Ethnic composition                                          19
5.2.3   Language                                                    19
5.2.4   Religion                                                    20
5.2.5   Cultural Norms, Values & Conflicts                          21
5.2.6   Civil society & environmental awareness                     21
5.3     Education                                                   23
5.3.1   Education system                                            23
5.3.2   Education infrastructure                                    25
5.4     Health                                                      27
5.4.1   Health system                                               27
5.4.2   Health infrastructure                                       27
6       ECONOMIC FACTORS                                            30
6.1     Economic Geography                                          30
6.1.1   Economic structure                                          30
6.1.2   Industrial Geography                                        30
6.1.3   Commercial Geography                                        31
6.1.4   Agricultural Geography                                      32
6.2     Economic Key Figures                                        33
6.2.1   Economic diversity                                          33
6.2.2   Economic output                                             33
6.2.3   Labour costs, mobility & employment                         34
6.2.4   Interest rates                                              36
6.2.5   Inflation rates                                             36
6.2.6   Customer liquidation and spending power                     38

                CONTEXTUAL ANALYSIS: COUNTRY REPORT FOR SOUTH AFRICA     3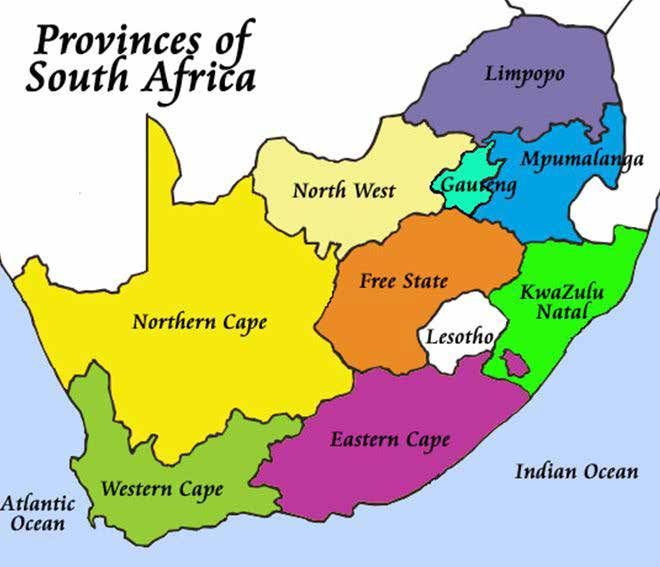
6.2.7 Foreign investment 39
6.2.8 Public finance situation 40
6.3 Energy and Infrastructure 42
6.3.1 Energy system, consumption & access 42
6.3.2 Transport infrastructure 44
7 POLITICAL AND LEGAL FACTORS 48
7.1 Political factors 48
7.1.1 Administrative structure 48
7.1.2 Governmental stability & transparency 48
7.1.3 Fiscal policies 49
7.1.4 Government spending priorities & allocation 50
7.1.5 National Security 50
7.1.6 Safety & crime 50
7.1.7 Trade policies 51
7.1.8 Bilateral, Multilateral & International agreements 51
7.1.9 Sustainable development policies 53
7.2 Legal Factors 55
7.2.1 Legal Framework 55
7.2.2 Resources Ownership & Property Rights Law 56
7.2.3 Business legislation 57
7.2.4 Employment, Labour laws & Unions 57
7.2.5 Environmental regulations & their enforcement 58
8 TECHNOLOGICAL FACTORS 60
8.1 Research and Development (scientific infrastructure) 60
8.1.1 Knowledge and resource base 60
8.1.2 R&D culture 63
8.2 Patents, products, technologies generated 64
8.3 Telecommunications & E-commerce 65
9 CONCLUSIONS 66
9.1 Overview of economic development – history and drivers 66
9.2 Conclusions specific to the non-energy raw materials sector 66
9.2.1 Industry and trade 66
9.2.2 Education and outreach 67
9.2.3 Research and innovation 67
APPENDIX SA1 MULTI-FACTOR MATRIX AND RADAR CHARTS 70
APPENDIX SA2: SOUTH AFRICA MULTI-FACTOR MATRIX 74
APPENDIX SA3: REFERENCES FOR SOUTH AFRICA COUNTRY REPORT 84
List of figures
Page
Figure 1: Road transport network in the SADC 12
Figure 2: Major roads in South Africa 13
Figure 3: Average annual rainfall 14
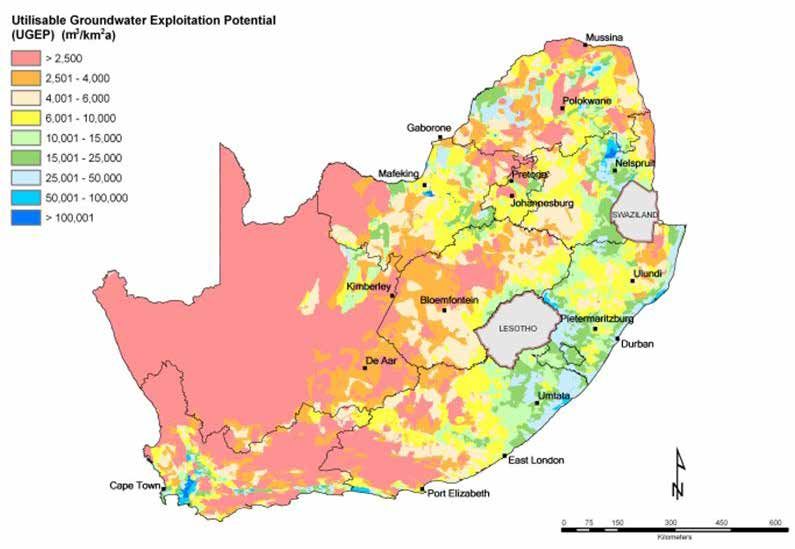
Figure 4: Groundwater exploitation potential 15
Figure 5: Type of educational institution attended by 5─24 year olds in 2014 24
Figure 6: Number of registered deaths 1997–2013 27
4 INTRAW PROJECT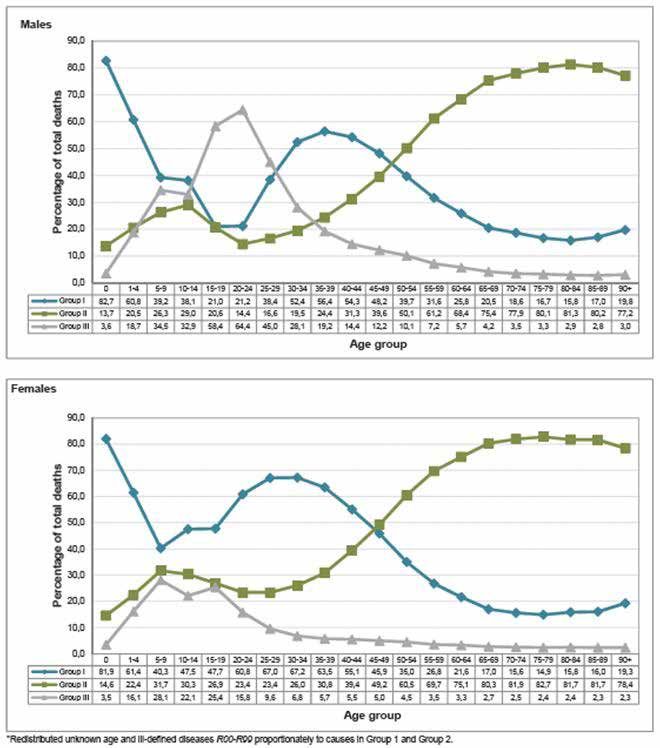
Figure 7: Percentage distribution of deaths due to communicable diseases
(Group I), non-communicable diseases (Group II) and injuries (Group III) by sex
and age group, 2013.                                                                 28
Figure 8: Causes of death in South Africa, 2000                                      29
Figure 9: Agricultural regions in South Africa                                       32
Figure 10: Percentage value added by different economic sectors in 2014              33
Figure 11: Employment by occupation, population group and gender                     36
Figure 12: Historical interbank interest rates                                       37
Figure 13: Historic CPI inflation in South Africa                                    37
Figure 14: Consumer Price Index for different sectors 2009-2013                      37
Figure 15: Households, saving, debt and wealth as % of personal disposable
income                                                                               38
Figure 16: Final consumption expenditure by households and household wealth          39
Figure 17: Household assets in South Africa                                          39
Figure 18: Electricity generation by fuel                                            42
Figure 19: Road conditions in different Provinces and of SANRAL                      44
Figure 20: The railway network of South Africa                                       45
Figure 21: Per capita real GDP, railway goods stock and goods stock carrying
capacity                                                                             45
Figure 22: The ports of South Africa and the connecting road and rail network        46
Figure 23: The Provinces of South Africa                                             49
Figure 24: National strategy for sustainable development in South Africa             54
Figure 25: R&D expenditure by sector of performance, 2012/13                         64
Figure 26: Five axes radar chart for the RSA                                         71
Figure 27: Twelve axes radar chart for the RSA                                       72

List of tables
                                                                               Page
Table 1: UNESCO Biosphere Reserves                                               17
Table 2: Mid-year estimates by population group and sex for 2015                 19
Table 3: South Africa first languages                                            20
Table 4: Key focus areas for Civil Society Organisations                         22
Table 5: Foreign added value requirements per industry                           31
Table 6: Income and expenditure at current prices in ZAR’000                     33
Table 7: Key economic figures.                                                   34
Table 8: Key labour market indicators.                                           35
Table 9: Main budget framework                                                   41
Table 10: Projected public income and public spending for 2015/16.               41
Table 11: Legislative, executive and judicial authorities                        48
Table 12: Excerpt from the South African Police Service statistics for 2013/14   51
Table 13: South African membership in international organisations and
associations                                                                     52
Table 14: Headline indicators from the NSSD 1                                    54
Table 15: Public entities involved in research and development                   60
Table 16: Global rank for South Africa in selected telecommunication fields      65
Table 17: Numerical weights for fulfilling the multi-factor matrix               70

               CONTEXTUAL ANALYSIS: COUNTRY REPORT FOR SOUTH AFRICA                       5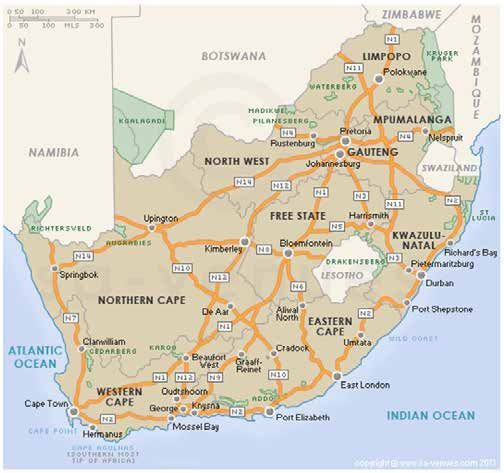
1. Introduction

    1.1 General                                    • Chapter 2: An Executive Summary
                                                   • Chapter 3: A historical overview on
      One objective of INTRAW is to charac-
                                                     raw materials
    terise the contextual environment of the
                                                   • Chapters 4 to 8: Analysis of the
    5 Reference Countries for the project
                                                     contextual environment, covering 49
    (Australia, Canada, Japan, South Africa
                                                     explanatory factors, grouped into five
    and the United States) in relation to raw
                                                     main categories:
    materials research & innovation, educa-
                                                     • Geo & Environmental (6 factors –
    tional and skills programmes, trade, ex-
                                                       Chapter 4);
    ploration, exploitation, processing, recy-
                                                     • Socio-Cultural (11 factors – Chapter
    cling and substitution. This, together with
                                                       5);
    the mapping of corresponding policies
                                                     • Economic (14 factors – Chapter 6);
    and practices for each of these domains,
                                                     • Political and Legal (14 factors –
    will facilitate the comparative evaluation
                                                       Chapter 7); and
    and cross impact analysis of the raw ma-
                                                     • Technological (4 factors – Chapter
    terials domains between the Reference
                                                       8).
    countries and the EU.
                                                   • Chapter 9: Conclusions.
    1.2 Introduction to Contextual Analysis          The description of the analysis of the
    (WP1, Task 1.1)                                contextual environment in each of the
                                                   main sections, Chapters 4 to 8, first des-
       The objective of Task 1.1 of the INTRAW
                                                   cribes general economic growth and
    project is to map the contextual environ-
                                                   change drivers associated with each of
    ment of the reference countries (Austra-
                                                   the explanatory factors, and then draws
    lia, Canada, Japan, South Africa and
                                                   out findings that are specific to the non-
    the United States of America) against the
                                                   energy raw materials sector. The conclu-
    contextual environment in the EU, leading
                                                   sions section follows a similar pattern, with
    to a better understanding of the achie-
                                                   a general overview followed by conclu-
    vements made in these countries in rela-
                                                   sions specific to raw materials, arranged
    tion to raw materials research & innova-
                                                   under the headings “Industry and trade”,
    tion, educational and skills programmes,
                                                   “Education and outreach”, and “Re-
    trade, exploration, exploitation, proces-
                                                   search and innovation” thus integrating
    sing, recycling and substitution. This WP
                                                   three sides of the ‘knowledge triangle’:
    will also map the corresponding policies
                                                   higher education, research and business,
    and practices of each of these domains.
                                                   that are reflected in the themes of the
    The data will be centrally processed,
                                                   sector specific reports being prepared as
    which will facilitate the comparative eva-
                                                   deliverables from WPs 1.21, 1.32 and 1.43.
    luation and cross impact analysis of the
    raw materials domains in each of the Re-       The report is supported by three appen-
    ference countries and the EU.                  dices:
                                                   • Appendix A1:
    1.3 Scope of this report                          Presentation of the method
                                                      employed to construct a multi-
      This report is the Country Report for the
                                                      factor matrix and associated radar
    Republic of South Africa (RSA), prepared
                                                      charts. The multi-factor matrix and
    as part of Task 1.1: “Contextual analysis
                                                      radar charts were the tools used
    of the Reference Countries”. It is part of
                                                      to carry out initial organisation and
    the deliverable for Work Package 1 of the
                                                      analysis of the information collected
    INTRAW project (D1.2). This report on the
                                                      and to inform discussions within
    contextual analysis for South Africa is pre-
    sented in 4 main sections after this intro-    1 Transactional analysis on Research and Innovation
    duction:                                       2 Transactional analysis on Education and Outreach
                                                   3 Transactional analysis on Industry and Trade

6      INTRAW PROJECT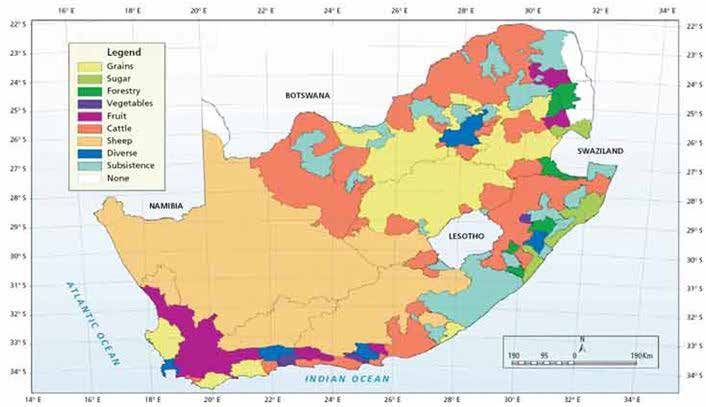
the work package team and with           and preliminary discussion of the
    members of the expert panel. They        comparative importance of the
    are considered as work-in-progress       explanatory factors based on the
    input and are included here for          analysis.
    completeness.                        •   Appendix A3:
•   Appendix A2: 			                         Presents the references quoted in this
    Presentation of summary findings         document.
    via the “multi-factor matrix” and
    five- and 12- axis “radar charts”,

                   CONTEXTUAL ANALYSIS: COUNTRY REPORT FOR SOUTH AFRICA               7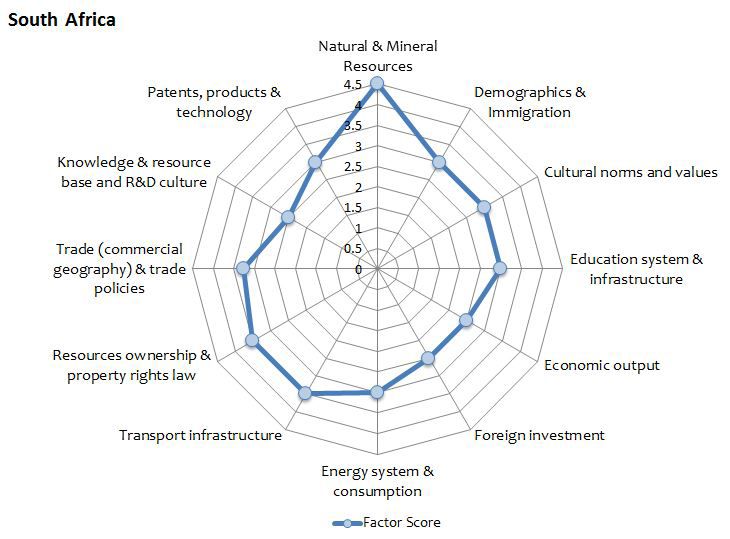
2. Executive summary

      Before the advent of European sett-           one of the biggest challenges of the
    lers South Africa was mainly a primitive        country.
    society. Initially the economy was solely         In recent times, the investor friendly poli-
    agrarian but later on with the discovery        cies of the country have made South Afri-
    of world class diamond and gold mines           ca by far the largest recipient of foreign
    in the latter half of 19th century, the eco-    direct investment in Africa. Nearly half
    nomy started transforming into a modern         the entries involved acquisitions of exis-
    and industrial economy. The establish-          ting operations, rather than Greenfields or
    ment of an internationally competitive          joint ventures setting up new enterprises.
    market and a globalized economy in              Many investors mitigated risk by limiting
    South Africa took place in very recent          the irreversibility of their investment, by
    times given that up until 1990 the politi-      outsourcing production and focussing on
    cal and social scenario of the country          services. Most entries are market-seeking.
    was overshadowed by apartheid. Today              In terms of public revenue, unlike in
    South Africa consists of world-class mining     many other developing countries, by far
    companies not only in gold, platinum,           the bulk of national government reve-
    diamonds, but also coal, ferrochrome            nue consists of tax revenue, while trans-
    and base metals. The industry is served by      fers and ordinary income from the sale
    world-class engineering and other sup-          of goods and services are comparatively
    port companies that export the respec-          insignificant. The annual volume of capi-
    tive services and products.                     tal investment by public enterprises has
      At a Geo political level it can be ob-        increased considerably in real terms over
    served that South Africa is located at          the past decade.
    the southern tip of the African continent         Local government’s annual infrastruc-
    and is a part of a major shipping route         ture spending has more than doubled in
    between Europe and Asia which leads             real terms since the late 1990s. The govern-
    around the Cape of Good Hope, with              ment has significantly increased social
    Cape Town as a major port of call. South        expenditure, notably in the expansion of
    Africa thus is exposed to both the Atlantic     social assistance grants. South Africa is a
    and Indian Ocean providing substantial          relatively open economy, only ‘modera-
    opportunities for industrial trade. South       tely’ protected by tariffs. Compared to its
    Africa is one of the BRICS countries (Brazil,   trading partners, the tariff regime is quite
    the Russian Federation, India, China and        transparent and not overly complex.
    South Africa). In terms of economic geo-          For development in the field of research,
    graphy, the country can be summarized           the country’s Medium Term Strategic
    as a middle-income, emerging market             Framework for 2014-2019 (MTSF, 2013)
    with an abundant supply of natural re-          emphasises the need to build on the cur-
    sources; well-developed financial, legal,       rent range of strategies and programmes
    communications, energy, and transport           that are already supporting innovation
    sectors, and a stock exchange that is Afri-     in firms and research and development
    ca’s largest and among the top 20 in the        (R&D) in the private and public sectors,
    world. Even though the country’s modern         with emphasis on biotechnology and
    infrastructure supports a relatively effi-      pharmaceuticals, space science and
    cient distribution of goods to major urban      technology, energy security, and other
    centres throughout the region, unstable         needs presented by climate change. This
    electricity supplies retard growth. Eco-        seems to be a positive step in long term
    nomic growth has decelerated lately.            development of R&D and innovation in
    Unemployment, poverty, and inequality           the country. The South African govern-
    - among the highest in the world - remain       ment continues to emphasise the impor-
                                                    tance of ICTs and their contribution to the

8       INTRAW PROJECT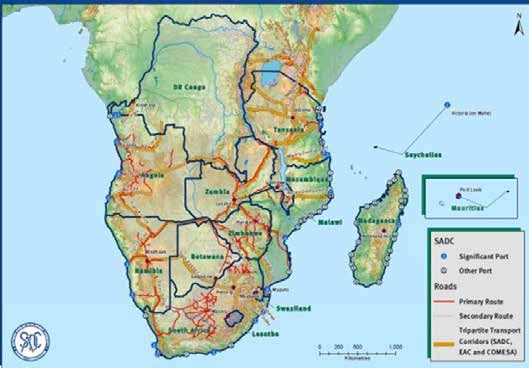
country’s economic growth, specifically          important role for this sector. In terms of
in the broad framework for economic              the energy sector, in the past there was
policy as set out in the Accelerated and         sufficient supply of water and energy. At
Shared Growth Initiative of South Africa.        present, with increasing population and
   With regards to the mining industry,          as a result of urbanisation the supply of
South Africa has managed (during the             energy and water are constrained due
apartheid era) to develop based on a             to increased demand. This challenge is
legal framework favourable to big mining         recognised by the South African govern-
companies and a monopolised structure.           ment, and efforts are being made to in-
This has been attempted to be changed            crease the energy output. For future suc-
after 1994 (post-apartheid era) by rever-        cess in mining, efficient mining methods
ting mineral rights to the State, allowing       that use water and energy sparingly are
new entrants into the market by new              required.
exploration and mining licences. Also a             In terms of the financial development of
stable fiscal framework, pre- and post-          the mining sector post-1994, companies
apartheid has been instrumental in ena-          were able to invest globally and spread
bling the success of the mining industry.        risks and, in so doing, became global
A key feature has been the allowance             mining companies. Acquisitions and mer-
of the repatriation of profits for all indus-    gers took place, head offices moved off-
tries. Also permitting times in South Africa     shore, and mining companies were able
have acted as an incentive, i.e. per-            to list on international stock exchanges.
mitting takes on average currently 12            Also, since mining still remains a labour
months for exploration licenses, and the         sensitive sector, since 1994 there has been
conversion between the exploration and           strong wage pressure and a decline in
the mining permit is straightforward, pro-       the mining workforce. This trend is likely to
viding security of tenure. South Africa also     continue in the future, with an increased
managed to develop a skilled workforce           drive for modernisation and mechanisa-
(e.g. skilled engineers in shaft sinking, ven-   tion. Labour cost is currently also very high
tilation, rock engineering and scientists)       and labour availability is unreliable due to
that made deep level mining possible.            continued tensions between employers
But after 1994 many skilled workers have         and the workforce and with frequent and
moved abroad. This remains a challenge,          long term strikes; this currently represents
alongside the increasing mechanisation           a significant challenge. Other challenges
of operations, also requiring more skilled       lay in the quality of the rail and road infras-
workforce.                                       tructure, in the perspectives of resource
   To ensure the future success of mining        nationalism and in increasing the added-
in South Africa, the stability of the legisla-   value of extracted minerals, an issue that
tive environment is important. Apart from        is in the political agenda and will remain
the legislative environment, access to           an important topic.
land, energy and water will also play an

                      CONTEXTUAL ANALYSIS: COUNTRY REPORT FOR SOUTH AFRICA                         9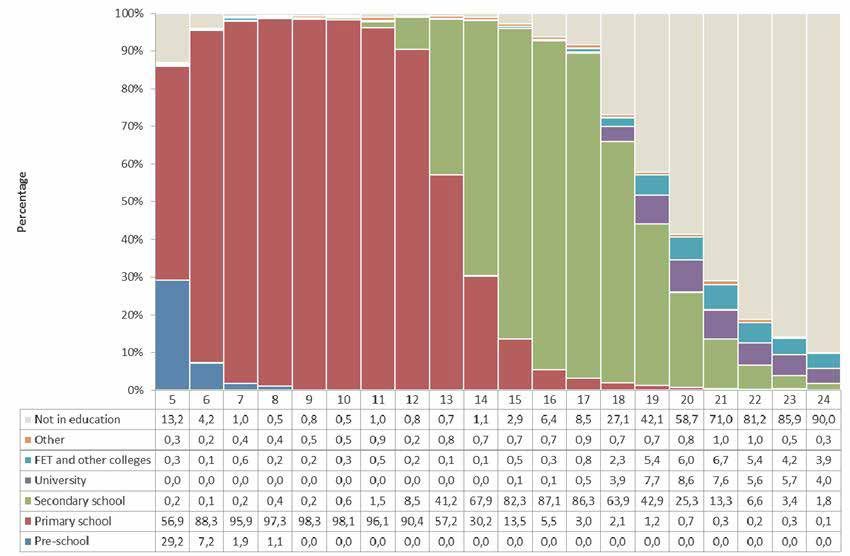
3. Historical overview on raw materials

        Prior to European settlement, South Afri-    export their respective services and pro-
     ca’s native population were mainly hun-         ducts. Thus, mining contributes not only
     ter-gatherers and migrant animal herders        directly to the economy, but also indirect-
     with limited sedentarized agriculture.          ly through upstream and downstream ac-
     Early European settlers brought with them       tivities.
     new agricultural models and methods,               Overall, the South African mining in-
     including sedentarization of agriculture,       dustry is the fifth largest in the world (An-
     with fencing and, eventually, fixed water       tin, 2013). Today, the mining industry is
     points. The discovery of world-class dia-       fully integrated into and capitalised on
     mond and gold deposits in the latter half       the international markets. This integration
     of the 19th century laid the foundations for    comes, however, at the cost of being af-
     the transformation of South Africa from         fected by global financial crises, such as
     an essentially agricultural to a modern         the global downturn from 2008 onwards.
     industrial economy. South Africa has an         While the opening-up and re-integration
     exceptional mineral resource endow-             of the South African economy into the
     ment, more than just diamonds and gold,         world market has led to substantial capi-
     and mining remains the backstay of the          tal flight in the early years after 1990, it
     economy.                                        also facilitated the inflow of foreign ca-
        Due to the apartheid regime, the in-         pital and the internationalisation of pre-
     creasing political isolation of South Africa    viously largely domestic firms (McKenzie
     was also reflected in the economic and          and Pons-Vignon, 2012:6-7).
     corporate governance structures as well            Production volumes in the minerals sec-
     as the ways in which the economy rela-          tor and revenues earned from them stron-
     ted to world-wide markets. In the apar-         gly depends on the movements of the
     theid system the people of South Africa         global markets. Platinum group metals
     were divided by their race and the races        (PGMs) have been for many years the
     were forced to live apart from each             highest revenue-earning commodity in
     other. There were laws that kept up the         South Africa. However, as the demand for
     racial separation. Management and               platinum is highly dependent on the de-
     workplace practices, reflecting the colo-       mand from the automotive sector, where
     nial and apartheid eras, were far behind        it is used mainly in catalytic converters, the
     international standards. A fundamental          fall in production of cars in recent years
     change in public and corporate gover-           has also reduced the demand for PGMs.
     nance paradigms slowly took place with          Coal overtook PGMs in terms of revenue
     a view to bring South Africa in line with in-   generated for mining companies, though
     ternational expectations in a process that      most of the coal is consumed domestical-
     is ongoing.                                     ly, particularly for electricity generation
        Such transformation affects not just the     (PwC, 2012:5).
     whole country, but also the raw materials          South Africa has the world’s largest re-
     industry specifically, with changes to com-     sources of platinum group metals (87.7%
     pany-work force relationships, attitudes        of world total), manganese (80%), chro-
     to workplace safety, and social aspects         mium (72.4%), gold (29.7%), alumina-si-
     of the labour force and their families. A       licates and accounts for over 40% of
     leaner, more focused, more competitive          global production of ferrochromium, pla-
     and internationally active industry ideal-      tinum group metals and vanadium (GCIS,
     ly emerged. Today in South Africa there         2013:151).
     are world-class mining companies not               It is interesting to relate the amount of
     only in gold, platinum, diamonds, but also      minerals produced per annum in any one
     coal, ferrochrome and base metals. The          country to its reserves and then to com-
     industry is served by world-class enginee-      pare this figure with other countries. A
     ring and other support companies that           world market share in production that is

10       INTRAW PROJECT
close to world share in resources general- figures may indicate also differences in
ly indicates a well-established industry. A the respective economic policies of the
disparity is exemplified by the manganese countries.
production, where South Africa has a The vast majority of South Africa’s mi-
market share of 15% compared to the neral production is exported, with the
30% of China that has only 1.25% of the exception of coal that is mainly used for
resources compared to the former. These domestic electricity production.
CONTEXTUAL ANALYSIS: COUNTRY REPORT FOR SOUTH AFRICA 114. Geo and environmental factors
4.1 Geographical situation on-land communications, a major ship-
ping route between Europe and Asia
South Africa is located at the southern
leads around the Cape of Good Hope,
tip of the African continent. Although
with Cape Town as a major port of call.
its location is peripheral with respect to
Figure 1: Road transport network in the SADC.
Source: www.sadc.int/themes/infrastructure/transport/roads-road-transport/
South Africa thus is exposed to both the munity. The peripheral position of South
Atlantic and Indian Ocean. Major sea- Africa with limited connections between
ports are Cape Town, Durban (container countries means that it cannot profit to
terminal), Port Elizabeth, Richards Bay, a great extent from transit. Ties with Na-
Saldanha Bay, and Mossels Bay as a ter- mibia, Zimbabwe, Swaziland, Botswana
minal for Liquefied Natural Gas (LNG) im- and Lesotho are historically close.
ports. South Africa has common borders
with Namibia, Botswana, Zimbabwe, and 4.2 Natural & Mineral resources
Mozambique. The independent states of South Africa is one of the countries with
Lesotho and Swaziland (which also has a the richest endowments of minerals. As
border with Mozambique) form enclaves mentioned previously, the country has
within the South African territory. South more than half of the world’s reserves
Africa provides important transit routes of manganese, chromium and platinum
for these two countries as well as for the group metals. It also has 40% or more of
land-locked countries of Botswana and the world’s vanadium, gold and vermi-
Zimbabwe. The latter also has access to culite reserves. Apart from being one of
the coast through Mozambique and the the world’s largest producer of platinum,
port of Beira. manganese, chromium and vanadium
Figure 1 and Figure 2 illustrate the major and a major producer of gold, South Afri-
road network and transit corridors in the ca is one of the world’s biggest producers
Southern African Development Com- and exporters of steam coal, although
12 INTRAW PROJECTFigure 2: Major roads in South Africa.
Source: http://www.sa-venues.com/maps/south-africa-national-roads.htm
much of the coal is being used domes- the land is arid. The water resources are
tically. The country produces 80% of its also unevenly distributed geographically,
steel needs, the rest comprising of impor- reflecting the climatic transition from mo-
ted speciality steel products. The steel is derate in the South to subtropical in the
manufactured from domestic sources North (Figures 3 and 4).
of iron ore, chromium, manganese, and South Africa experiences significant wa-
vanadium, using locally produced coke ter resources challenges due to increa-
and powering the electric furnaces by sing population (drinking water, increa-
coal-fired power stations. South Africa is sing energy demand that requires more
also nearly self-sufficient in cement and cooling water for the power-stations),
building aggregates (GCIS, 2013). expanding industry (process and coo-
ling water), competitive land-uses (e.g.
4.3 Water resources strip-mining for coal) that may destroy
Water is a scarce commodity in South aquifers, as well as intensified agriculture
Africa with an average annual rainfall of to meet rising domestic demands due
approximately 464 mm compared to a to increasing population with increasing
world average of 860 mm. Long before wealth. The effects of climate change
external stressors such as climate change may further worsen the situation, and
are taken into account, it is already highly such stressors affect both water quality
water stressed (for example, the Limpopo and quantity.
Basin is one of the most severely water Aquatic ecosystems play an impor-
stressed river basins on the African conti- tant role in the hydrological cycle, both
nent). It also has one of the lowest Mean in quantitative and qualitative res-
Annual Precipitation to Run-off conversion pects. Of the 112 river ecosystems in the
ratios in the world, meaning that much of country 84% are considered threatened,
CONTEXTUAL ANALYSIS: COUNTRY REPORT FOR SOUTH AFRICA 13Figure 3: Average annual rainfall.
Source: www.fao.org/docrep/008/y5998e/y5998e02.jpg
Figure 4: Groundwater exploitation potential.
Source: www.dwa.gov.za/Groundwater/Documents/map/ugep.jpg
of which 54% are critically endangered, mining, industrial activities, and intensive
18% endangered, and 12% vulnerable. farming. The South African government
Also, more than 50% of the wetlands are addresses these issues through a ground-
degraded (WESSA, 2012). Ground- and water strategy (Water Affairs, 2010), but
surface water in a number of areas also while the water strategy of the country is
have longstanding and emerging quality impressive, implementation remains diffi-
problems due to (amongst other factors) cult.
14 INTRAW PROJECT4.4 Climate ly Jurassic Karoo Province and the early
Cretaceous Etendeka Province along
Climate change resulting from global
the Atlantic seaboard of South Africa
warming is likely to affect the largely arid
and Namibia. The south-western Cape
regions of South Africa. Reduced rainfall
has one of the highest levels of seismicity
would reduce groundwater recharge
in South Africa. However, serious earth-
and hence put further stress onto the
quakes are rare with the most severe ear-
water resources exploited to their sustai-
thquake of magnitude 6.3 having occur-
nable limit. Receding groundwater levels
red on 29 September 1969 in Ceres, 100
will also have impacts on the natural ve-
km northeast of Cape Town. The event
getation and agriculture. Where reduced
resulted in 12 lost lives and numerous da-
vegetation cover occurs, it is likely to ex-
maged buildings in the town of Tulbagh.
pose the land to erosion by flash-floods,
On 4 September 1809, a seismic event
which could trigger a cycle of desertifi-
estimated at magnitude 6.3, occurred
cation. Climate change models, such as
at the Milnerton Fault, a mere 10km from
those in Davis (2011) show an increase
Cape Town CBD and the location of the
in projected mean, minimum and maxi-
Cape Town Stadium (Visser and Kijko,
mum temperatures as a consistent and
2010). Earthquakes of anthropogenic root
robust finding – with a minimum projected
cause are much more frequent, resulting
change of 0.3°C, and maximum at 3.6°C.
from mine works that have been aban-
The models indicate increases in very hot
doned and left to collapse, or triggered
days or heat waves. A decrease in winter
by mining at great depths. They affect
and spring rainfall over the south-western
particularly townships and former mine
part of South Africa is also indicated in
land that has been settled informally (Vis-
most simulations, whereas south-eastern
ser and Kijko, 2010).
South Africa generally is expected to re-
ceive more rainfall. 4.6 Ecologically sensitive areas
Both water shortages and erosion will
have profound socio-economic effects, South Africa has eight UNESCO-desi-
amongst other impacts. Not only is it likely gnated biosphere reserves (Table 1).
to become increasingly difficult to sup- In addition, South Africa has several
ply an increasing population with drin- UNESCO World Natural Heritage Sites. The
king water, but also to provide industry, recently designated Gouritz Cluster with
including the mining industry, with water. an area of more than 3 million ha straddles
Conflicts over water use are likely to arise, two provinces as does the second largest
particularly (but not solely) in the wes- Kruger to Canyons Biosphere Reserve with
tern parts of South Africa that receive less its 2,474,700 ha. The latter includes the
rain (Davis, 2011). Nature-based tourism well-known Kruger National Park. It should
in southern Africa is at risk from climate be noted that the surface areas given in
change due to the effects of changing Table 1 are the total area, which includes
temperature and rainfall patterns on spe- a much smaller core area, a buffer area,
cies distribution, as well as indirect effects. and a larger transition area. Most of the
Finally, the health sector in South Africa is designated biosphere reserves include
likely to be increasingly challenged by settled land and are under pressure from
climate change, including thermal stress informal settlements and expanding sub-
on humans – with significant concerns for sistence agriculture. There have been de-
both open and deep level mining (see, bates and disputes around mining leases
for example, Archer and Tadross, 2009). near World Heritage Sites, e.g. a coal mine
A comprehensive Risk and Vulnerability adjacent to the Mapungubwe heritage
Atlas is available for South Africa (http:// site (ancient cultural landscape) in Lim-
sarva.dirisa.org). popo, and with respect to illegal mining,
e.g. sand mining along the Wild Coast.
4.5 Geological Factors Besides the Biosphere reserves, there are
17 Ramsar sites in South Africa, also consi-
Southern Africa is host to two large Me-
dered ecologically sensitive areas.
sozoic flood volcanic provinces - the ear-
CONTEXTUAL ANALYSIS: COUNTRY REPORT FOR SOUTH AFRICA 15Table 1: UNESCO Biosphere Reserves.
Name Province Year of Total area Administrative authority
designation [ha]
Kogelberg Western Cape 1998 103,629 Cape Nature Conservation,
Hangklip/Kleinmond Municipality
Cape West Western Cape 2000, 378,240 Provincial Administration Western
Coast Cape
extension
2003
Waterberg Limpopo 2001 414,571 The Waterberg Biosphere Reserve
Committee
Kruger to Limpopo and 2001 2,474,700 National Department of
Canyons Mpumalanga Environmental Affairs and Tourism,
Kruger to Canyons Biosphere
Reserve Trust
Cape Western Cape 2007 322,030 Cape Winelands District
Winelands Municipality
Vhembe Limpopo 2009 30,701 Limpopo Provincial Government,
Polokwane
Gouritz Cluster Eastern and 2015 3,187,893 National Department of
Western Cape Environmental Affairs
Provinces
Magaliesberg Gauteng 2015 357,870 Magaliesberg Management Board
Source: www.unesco.org/new/en/natural-sciences/environment/ecological-sciences/biosphere-reserves/africa/
south_africa/
16 INTRAW PROJECTCONTEXTUAL ANALYSIS: COUNTRY REPORT FOR SOUTH AFRICA 17
5. Socio-cultural factors

     5.1 Historical Background                       male mine contract workers into the town
                                                     regions without integrating them into the
        The Portuguese, who were the first Eu-
                                                     social fabric eventually led to the segre-
     ropean to arrive in South Africa, left little
                                                     gationist policies of ‘apartheid’.
     traces of their presence. From the 17th
                                                       The discovery of gold in South Africa
     century the Dutch East India Company
                                                     drove the foundation and rise of mining
     (VOC) used Cape Town as a stepping
                                                     houses. Their purpose was to acquire
     stone along the trade route to India and
                                                     capital with a particular focus attracting
     East Asia. Religious and political refugees
                                                     foreign investment. For instance, Anglo
     from the Netherlands, Germany, and
                                                     American was founded to mobilise capi-
     France (Huguenots) arrived in conside-
                                                     tal from British and American investors (Se-
     rable numbers as farmers and spread
                                                     gal and Malherbe, 2000). To strengthen
     from the Cape area into the land. Their
                                                     their position against global competition
     Protestant ethics and the Dutch lan-
                                                     and with the government, the major mi-
     guage are still a dominating factor in
                                                     ning houses – including Anglo American,
     the white population of South Africa. In
                                                     De Beers, Goldfields and Harmony - crea-
     the wake of the Napoleonic Wars the Bri-
                                                     ted the Chamber of Mines, which went
     tish Empire seized the Cape Colony from
                                                     on to dominate the economy up until
     the Dutch. This led to an inflow of British
                                                     the 1990s. The mining houses created the
     administrators, business people, and sett-
                                                     South African capital markets by func-
     lers, resulting in antagonism between the
                                                     tioning as investment banks, pioneered
     Boers and the British that persisted into
                                                     other mineral resources besides gold, and
     the early 20th century, culminating in the
                                                     used their economies of scale to centrally
     Anglo-Boer Wars (1899-1902).
                                                     purchase material, employ highly skilled
        South Africa’s transformation from an
                                                     labour, and to monopolize the unskilled
     agricultural society to the most industria-
                                                     labour market.
     lized nation in Africa began in the Wit-
                                                       The increasing political isolation of South
     watersrand Basin in the late 19th century.
                                                     Africa from the 1970s onwards negatively
     The world’s largest diamond deposits had
                                                     affected the mining businesses and for-
     already been discovered in the 1860s
                                                     ced them to re-orient their recruitment
     around the area that later became the
                                                     policies. While previously large numbers
     city of Kimberley in the Northern Cape
                                                     of unskilled labourers had been brought
     Province. Diamond mining and trade
                                                     into from neighbouring countries, now
     became monopolised by the De Beers
                                                     these workers had to be recruited locally
     company (a situation that largely persists
                                                     (Segal and Malherbe, 2000).
     until recently), but generated sufficient
                                                       Social relations also changed with the
     revenue for the development of a railway
                                                     establishment of the National Union of
     system. The labour- and capital-intensive
                                                     Mineworkers in 1980; the first legal strike
     deep mining for gold began to shape
                                                     by black mineworkers occurred in 1984,
     the future economic trajectory of South
                                                     coinciding with a slump in gold prices.
     Africa.
                                                     Low gold prices well into the new millen-
        The mineral resources were developed
                                                     nium, and increasing wages of unskilled
     with mainly British capital. Land-use
                                                     labour due to more effective union repre-
     conflicts between the more agricultu-
                                                     sentation led to shareholder pressure on
     rally oriented Boers and the industrially
                                                     companies to cut costs, eventually lea-
     oriented British led to the so-called Anglo-
                                                     ding to a 60% reduction of the work force
     Boer Wars. Supply of mine labour became
                                                     (Segal and Malherbe, 2000).
     a development priority and policies to
                                                       The isolation of South Africa during
     attract Africans into the urban mining
                                                     the apartheid era forced the mining
     centres were put into place. However,
                                                     houses to become increasingly horizon-
     bringing a large population of mainly
                                                     tally integrated and diversified to make

18       INTRAW PROJECT
up for the lack of imports and exports, 13.7 million. However, the birth rate re-
which reduced their efficiency. After the duced from 25 per 1000 in 2002 to 23 per
end of apartheid the resulting industrial 1000 in 2015, indicating a more effective
conglomerates were broken up and the birth control and social choice for fewer
constituent parts concentrated on their children. About 30% of the population
respective core businesses and were re- is aged younger than 15 years and ap-
integrated into the global economy. The proximately 8.0% (4.42 million) is 60 years
forced self-sufficiency, however, also led or older. Life expectancy at birth for 2015
to the development of a strong support is estimated at 60.6 years for males and
industry to the mining industry, which now 64.3 years for females. Females make up
is an export advantage. about 51% of the population. Population
Taxation of the mining industry in gene- dynamics continue to be impacted by
ral was favourable, resulting in relatively HIV/AIDS incidence, with around 11% of
little public revenue being generated. the total population being infected, while
This in turn limited the public investment for adults aged 15–49 years the incidence
such as in infrastructure development is an estimated 17%. Around 30% of the
and educational or social projects. Ac- deaths are HIV/AIDS related (Stats SA,
tual and perceived investment insecurity 2015a).
due to political uncertainty led to a signi-
ficant capital outflow that peaked at 20% 5.2.2 Ethnic composition
of Gross Domestic Product (GDP) in 2007. Statistics South Africa asks people to
describe themselves in the census in
5.2 Human geography terms of four racial population groups,
5.2.1 Demographics namely African, Coloured, Indian/Asian,
and White. The data as of July 2015 are
In July 2015 the South African popula- given in Table 2. It should be noted that
tion reached 55 million, which comprise ‘Coloured’ in South African terminology
a 1.65% increase over 2014 (Stats SA, means of mixed-race descent.
2015a). In 1950 the population was only
Table 2: Mid-year estimates by population group and sex for 2015.
Popula- Male Female Total
tion group Number % of total Number % of total Number % of total
population population population
African 21,653,500 80.6 22,574,500 80.4 44,228,000 80.5
Coloured 2,334,800 8.7 2,498,100 8.9 4,832,900 8.8
Indian/ 688,100 2.6 673,900 2.4 1,362,000 2.5
Asian
White 2,201,900 8.2 2,332,200 8.3 4,534,000 8.3
Total 26,878,300 100.0 28,078,700 100.0 54,956,900 100.0
Source: Stats SA, 2015a
The first census in South Africa in 1911 regard it is third only to Bolivia and India in
showed that Whites made up 22% of the number. While all the languages are for-
population (Christopher, 2010); it decli- mally equal, some languages are spoken
ned to 16% in 1980, to 8.9% in 2011 and more than others. According to the 2011
8.3% in 2015. census (Stats SA, 2012), the three most
spoken first languages are Zulu (22.7%),
5.2.3 Language Xhosa (16.0%), and Afrikaans (13.5%). Des-
South Africa has eleven official lan- pite the fact that English is recognised as
guages: Afrikaans, English, Ndebele, the language of commerce and science,
Northern Sotho, Sotho, Swazi, Tswana, it ranked fourth, and was spoken by only
Tsonga, Venda, Xhosa and Zulu. In this 9.6% of South Africans as a first language
CONTEXTUAL ANALYSIS: COUNTRY REPORT FOR SOUTH AFRICA 19in 2011 (Table 3). tion. Many of the ‘unofficial languages’
The country also recognises several of the San and Khoikhoi people contain
unofficial languages, including Fanagalo, regional dialects stretching northwards
Khoe, Lobedu, Nama, Northern Ndebele, into Namibia, Botswana, and elsewhere.
Phuthi, San and South African Sign Lan- These people, who are a physically dis-
guage. These unofficial languages may tinct population from other Africans,
be used in certain official uses in limited have their own cultural identity based on
areas where it has been determined that their hunter-gatherer societies. They have
these languages are prevalent. Never- been marginalised to an extent, and
theless, their populations are not such many of their languages are in danger of
that they require nationwide recogni- becoming extinct.
Table 3: South Africa first languages.
First Language Number of speakers % First Language Number of speakers %
Afrikaans 6,855,082 13.45 Setswana 4,067,248 7.98
English 4,892,623 9.60 Sign language 234,655 0.46
IsiNdebele 1,090,223 2.14 SiSwati 1,297,046 2.55
IsiXhosa 8,154,258 16.00 Tshivenda 1,209,388 2.37
IsiZulu 11,587,374 22.74 Xitsonga 2,277,148 4.47
Sepedi 4,618,576 9.06 Other 828,258 1.63
Sesotho 3,849,563 7.55 Setswana 4,067,248 7.98
Source: Stats SA, 2012
The country also recognises several mated 2.2% of the population conside-
unofficial languages, including Fanagalo, red themselves Muslim while 5.5% did not
Khoe, Lobedu, Nama, Northern Ndebele, follow any religion in particular. The lat-
Phuthi, San and South African Sign Lan- ter figure was particularly high in Eastern
guage. These unofficial languages may Cape (15%). Only 0.2% of individuals were
be used in certain official uses in limited estimated to be Jewish. Individuals were
areas where it has been determined that most likely to be Christians in Northern
these languages are prevalent. Never- Cape (98%), Free State (98%) and least
theless, their populations are not such likely to be so in Limpopo (77.8%) where
that they require nationwide recogni- 7.2% of individuals followed ancestral,
tion. Many of the ‘unofficial languages’ tribal, animist or other traditional African
of the San and Khoikhoi people contain religions and 15% professed following ‘no-
regional dialects stretching northwards thing in particular’. The highest concen-
into Namibia, Botswana, and elsewhere. trations of Muslims were found in Western
These people, who are a physically dis- Cape (7.4%) and KwaZulu-Natal (2.6%),
tinct population from other Africans, while the highest percentage of Hindus
have their own cultural identity based on was found in KwaZulu-Natal (3.9%).
their hunter-gatherer societies. They have African Indigenous Churches made up
been marginalised to an extent, and the largest of the Christian groups. Some
many of their languages are in danger of believe that many people claiming no
becoming extinct. affiliation with any organised religion
adhered to traditional indigenous reli-
5.2.4 Religion gions. Many people follow syncretic reli-
The 2014 household census (Stats SA, gious practices combining Christian and
2015b) shows that an estimated 86% of indigenous influences. Muslims are largely
South Africans were affiliated to the Chris- found among the Coloured and Indian
tian religion in South Africa, while 5.1% ethnic groups. They have been joined
professed to follow ancestral, tribal, ani- by black or white South African converts
mist or other traditional religions. An esti- as well as immigrants from other parts of
20 INTRAW PROJECTAfrica. South African Muslims claim that background and membership to clans
their faith is the fastest-growing religion of continue to be important factors in self-
conversion in the country, with the num- identification and today may still lead
ber of black Muslims growing six fold, from to conflict. Similarly, whites, although first
12,000 in 1991 to 74,700 in 2004. The Hindu identifying themselves as South Africans,
population has its roots in the British colo- retain a spiritual ancestral relationship: it
nial period, but later waves of immigra- is important whether they are of British or
tion from India have also contributed to it. Dutch (Afrikaner) descent1 .
Most Hindus are of South Asian origin, but The native African population original-
there are many who come from mixed ly pursued subsistence agriculture. With
racial stock. Some are converts due to the advance of the Afrikaners many lost
the efforts of Hindu missionaries. Other mi- their land and subsequently many males
nority religions in South Africa are Sikhism, became migrant labourers, initially on
Jainism and Bahá’í Faith (Stats SA, 2005). farms and later in mining and other indus-
tries. This affected the social structure,
5.2.5 Cultural Norms, Values & as there has been a division of labour
Conflicts between males and females. Families
The South African society can be divi- lacked for much of the time their ‘head’
ded into three major groups with (under and became dependent on the money
certain circumstances) rather different sent back by the males. Family affairs
sets of cultural norms and values, namely were managed almost exclusively by
blacks (made up of wide variety of indi- the females. At the same time male-only
genous ethnicities), whites (mainly of communities around mines and industrial
Dutch and British descent), and Asians (of establishments arose, with all the social
mainly Indian and Pakistani origin). The problems related to this.
white population largely shares the norms With the end of Apartheid a shift in gen-
and values with the Western European der norms was also observed. Females
populations from which they derive. In (nominally) achieved equal rights. Howe-
the second half of the 20th century the ver, old social patterns appear to persist in
white population entered into conflict all population groups. Female self-deter-
with much of the rest of the world by the mination has also become an important
introduction of the ‘apartheid’ policy that aspect in limiting the spread of HIV and in
imposed strict racial segregation. This reducing rates of unwanted pregnancy.
brought the white population also into
5.2.6 Civil society & environmental
conflict with the other population groups
in South Africa. Some of the Blacks and
awareness
many Asians began to embrace certain Historically, there have been two major
Western world cultural norms and values. inflection points in the South African so-
Otherwise, one must assume that norma- ciety: a) the struggle between the agri-
tive and value systems in the black and culturally dominated ‘Boer’ settlers and
coloured populations show a significant the post-Vienna Congress influx of indus-
heterogeneity, reflecting their diverse trial/mineral raw materials oriented Bri-
ethnic origin and cultural traditions. The tish, which culminated in the Anglo-Boer
‘traditional’ norms and values, however, Wars of the early 20th century; and b)
are on occasion at odds with the Western the struggle between the native African
world norms and values of human rights population and the European descent
and gender equality as now enshrined in population that resulted in the so-called
the South African constitution. ‘apartheid’ segregation and culminated
The heterogeneity of the black popula- in its abolishment in the early 1990s. Much
tion derives from their varied ethnic back- of civil society policies and efforts were
ground. Historically, fighting between lar- directed until today towards a re-equili-
ger ethnic groups over predominance bration of political and economic power
was as common as fighting between as well as the necessary catching up of
the advancing Europeans and the na- the African population with respect to
tive population. It appears that ethnic 1 www.everyculture.com/Sa-Th/South-Africa.html
CONTEXTUAL ANALYSIS: COUNTRY REPORT FOR SOUTH AFRICA 21education among other areas. ship between government and CSOs for
Under apartheid, civil society was gene- service delivery and is intended to pro-
rally defined by its relationship to the state vide assistance to organisations working
– either serving white interests and alig- in service delivery and poverty allevia-
ned to the state, or in opposition to the tion. Through the National Development
state. Since 1994, civil society organisa- Agency Act (NDA Act of 1998), the NDA is
tions (CSOs) had to renegotiate their rela- “aimed at promoting an appropriate and
tionship to the state. Many organisations sustainable partnership between the Go-
have found that the government had not vernment and civil society organisations
delivered on its promises and as a result to eradicate poverty and its causes.”
have focused on serving poor communi- (Graham et al., 2008). Poverty alleviation,
ties, often without state assistance or inte- in particular through education, is one of
rest. The National Development Agency2 the major pre-occupations of the govern-
was established to develop a partner- ment, as mentioned earlier (Table 4).
2 NDA, www.nda.org.za
Table 4: Key focus areas for Civil Society Organisations.
Focus area No. of CSOs Focus area No. of CSOs
Education 58 Disability 22
Children 54 Human Rights 15
HIV/AIDS 49 Agriculture 13
Community Development 38 Early Childhood Development 12
Capacity Building 33 Aged 10
Capacity Development/Training 33 Counselling & Therapy 10
Gender 33 Legal Services 10
Health 25 Poverty Relief 10
Youth 25
Source: Graham et al., 2008
Civil society formations during the apar- ment realised the need to rely on CSOs to
theid era in South Africa were based on aid it in its striving for poverty alleviation,
race, ethnicity and class and were largely it became increasingly apprehensive of
involved in advocacy work – opposing the implicit power of CSOs. Developing
the apartheid state. Some organised their effective partnerships therefore became
struggle according to a range of issues important. This created a dilemma for
such as working conditions, high rents, the CSOs, which now have less ability to
environmental degradation, urban ser- impact on policy. They have become
vices and agricultural productivity. During dominated by the urban elite, who may
the struggle, these issues were deeply partner with government, often around
politicized. Most (although by no means service-delivery, and as a result become
all) anti-apartheid CSOs were dependent less relevant to the disenfranchised. There
on the African National Congress3 (ANC) are, however, some significant excep-
for popular legitimacy and leadership in tions here.
order to defeat the then government. In effect, the civil society sector is once
When the ANC stepped into power, CSOs again positioning itself as the voice of
had to consider their independence from the people against the state, an essen-
the state and their dependence on the tial role in ensuring accountability in a
ANC. While the post-apartheid govern- stable democracy (Graham et al., 2008).
In the context of the EO-Miners project4
3 The African National Congress is the Republic of South
Africa’s governing social democratic political party. 4 The project EO-MINERS was funded by the Seventh
It has been the ruling party since the establishment of Framework Program of the European Commission, to
a non-racial democracy in April 1994, including the monitor mineral resources exploration and mining from
election of Nelson Mandela as president from 1994-1999. concept to closure and observe, monitor and provide
22 INTRAW PROJECTalso the presence, agendas, and activi- analyses reveal that the particular cir-
ties (specifically in the area of mining) of cumstances of households are important
CSOs organisations were reviewed (Falck in response to environmental issues. For
et al., 2012), which is small compared to example, households with access to land
those addressing other issues. Overall, the for agriculture are more likely to perceive
South African society is still in the process land degradation as a problem than are
of redefining its governance paradigms households without access to land for
and structures. agriculture. Education of the household
The United Nations Earth Summit in Jo- head is rarely important for perception of
hannesburg in 2002 probably has made environmental problems, but education is
South Africans more aware of mining´s usually important for whether the house-
social and environmental impacts due hold takes action in response to an envi-
to the publicity it received and the fact ronmental problem and for awareness
that it took place in the country. Field- of environmental initiatives. The authors
work carried out in the Mpumalanga of the study also concluded that even
Province in the context of the EO-Miners an improvement of the socio-economic
project (Falck and Spangenberg, 2013; conditions of the African population seg-
Wittmer et al., 2013) indicated a wide ment will not necessarily change their
range of environmental concerns parti- environmental awareness over the short
cularly related to mining. Social and envi- term. The study also suggests that envi-
ronmental impacts were seen as closely ronmental matters are not a high priority
related, particularly when mining is the for the South African public. On the other
root cause. However, the level of environ- hand, the EO-Miners project observed
mental awareness and pre-occupation an awareness of mining and coal/steel
beyond immediate well-being appears related environmental issues, though the
to depend largely on the socio-econo- interviewees may not have been repre-
mic background of the group in question. sentative of the population as a whole.
Environmental concerns and moreover With regards to the social licence for
the ensuing actions are luxuries for those the mining industry, in the past, South
groups with higher incomes. These fin- Africa had strong government support
dings corroborate those by Anderson for mining, but with mixed impact. Mining
et al., (2010), which were based on the provided income for rural people, but
South African 2004 household census. An- migrant labour has led to social problems
derson et al., (2010) explored the relation- such as health and environmental issues.
ships between perceptions, behaviours Post-1994, there has been a rise in envi-
and awareness regarding four environ- ronmental activism and social demands,
mental conditions in South Africa: water strikes and disputes increased (e.g. Mari-
pollution, land degradation, air pollution kana massacre). In the future, this will
and littering. most likely increase.
First, the extent to which these percep-
tions, behaviours and levels of awareness 5.3 Education
correspond to those found in other parts
5.3.1 Education system
of the world were assessed. Secondly,
the importance of race, ethnicity and Since 1994 the South African education
socioeconomic status in differences and landscape has undergone major trans-
similarities in environmental perceptions, formation in governance, management,
behaviours and awareness were ana- curricular reform, and teacher professio-
lysed. African households are much more nal development. Central to this trans-
likely to perceive environmental pro- formation has been a complete policy
blems than non-African households, but overhaul in the form of a new national
non-African households are more likely to qualifications framework (NQF) and a
take action in response to environmen- new curriculum framework for schools
tal problems and to be aware of envi- based on the concept of outcomes-
ronmental initiatives. Logistic regression based education (OBE). The NQF is a key
mechanism for creating an egalitarian
information to manage its impacts on the environment
and society. See http://www.eo-miners.eu/
CONTEXTUAL ANALYSIS: COUNTRY REPORT FOR SOUTH AFRICA 23You can also read