Challenges for Australian Research & Innovation - UTS INNOVATION OCCASIONAL PAPER, APRIL 2020 JOHN H HOWARD, UNIVERSITY OF TECHNOLOGY SYDNEY & ...
←
→
Page content transcription
If your browser does not render page correctly, please read the page content below

Challenges for
Australian Research &
Innovation
UTS INNOVATION OCCASIONAL PAPER, APRIL 2020
JOHN H HOWARD, UNIVERSITY OF TECHNOLOGY SYDNEY &
ACTON INSTITUTE FOR POLICY RESEARCH & INNOVATION
Challenges for Australian Research & Innovation: UTS Innovation Occasional Paper

Published by University of Technology Sydney,
Acton Institute for Policy Research and Innovation
PO Box 123 Broadway NSW 2007 Australia

© University of Technology Sydney, Acton Institute for Policy Research and Innovation, 2020

ISBN 978-1-64786-073-8

The publication is copyright. Other than for uses permitted under the Copyright Act 1968,
no part may be reproduced by any process without attribution.

                                                                                              ii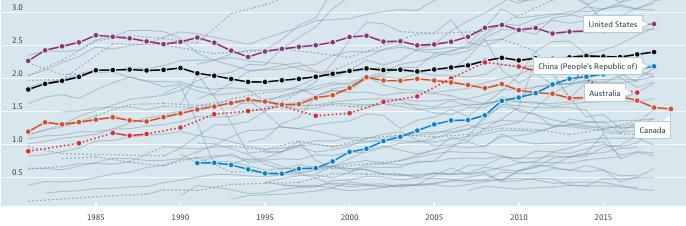
Challenges for Australian Research & Innovation: UTS Innovation Occasional Paper

Table of Contents

EXECUTIVE SUMMARY .........................................................................................................................1

1     INTRODUCTION .............................................................................................................................4
    1.1   WINDS OF CHANGE .....................................................................................................................4
    1.2   TOWARDS NEW SOURCES OF GROWTH ........................................................................................6
    1.3   A NATIONAL MISSION ..................................................................................................................7
    1.4   BUSINESS-UNIVERSITY ENGAGEMENT ..........................................................................................8
    1.5   A NEW NATIONAL APPROACH TO SRI STRATEGY AND RESOURCING ...............................................9
    1.6   NEW INVESTMENT AND RESOURCE ALLOCATION FRAMEWORKS ...................................................10

2     THE CHALLENGE AHEAD: FINDING NEW SOURCES OF GROWTH .....................................12
    2.1    THE PROBLEM ..........................................................................................................................12
    2.2    FINDING THE OPPORTUNITIES ....................................................................................................13
    2.3    REINVENTING MANUFACTURING .................................................................................................14
    2.4    DISRUPTING THE CURRENT POLICY MODEL .................................................................................15
      2.4.1     Path dependency ...........................................................................................................15
      2.4.2     The protectionist hangover ............................................................................................16
      2.4.3     It’s not about “picking winners” ......................................................................................17
      2.4.4     System failures...............................................................................................................18
      2.4.5     The Australia 2030: Prosperity through Innovation initiative .........................................19
    2.5    THE FOCUS OF THIS PAPER .......................................................................................................20

3     THE RESEARCH, DEVELOPMENT AND INNOVATION INVESTMENT CLIMATE ...................21
    3.1   WHAT AUSTRALIA INVESTS IN RESEARCH AND DEVELOPMENT .....................................................21
    3.2   WHERE RESEARCH INVESTMENT IS BEING MADE .........................................................................24
    3.3   WHAT RESEARCH INVESTMENT PRODUCES – RESEARCH OUTPUTS ..............................................25
    3.4   STAFFING RESOURCES FOR TEACHING AND RESEARCH...............................................................28
    3.5   AUSTRALIA’S STRONG COMMITMENT TO MEDICAL RESEARCH ......................................................28
    3.6   A BUSINESS-HIGHER EDUCATION-GOVERNMENT RESEARCH INVESTMENT MISMATCH ....................32
    3.7   INVESTMENT IN INDUSTRIES OF THE FUTURE..............................................................................33

4     POLICY GAPS, FAILURES, AND MISSED OPPORTUNITIES ...................................................35
    4.1   FUNDING PROGRAMS – FOSTERING INITIATIVE OR ALLOCATING “FREE MONEY” .............................35
    4.2   SECTOR-BASED OR TECHNOLOGY-BASED APPROACHES .............................................................37
    4.3   REGIONAL DEVELOPMENT AND PLACE-BASED INNOVATION ..........................................................38
    4.4   INNOVATION SYSTEM GOVERNANCE, PARTNERSHIP, AND TRUST ..................................................39

5     POLICY IMPERATIVES ................................................................................................................41
    5.1    ACHIEVING A CLOSER MATCH BETWEEN INDUSTRY AND UNIVERSITY RESEARCH PRIORITIES ..........41
    5.2    SUSTAINED RDI INVESTMENT IN KEY INDUSTRY SECTORS ...........................................................42
      5.2.1    Science Research and Innovation (SRI) investment trends ..........................................42
      5.2.2    Addressing the dissipation of SRI support .....................................................................44
      5.2.3    Expenditure on non R&D related SRI Innovation ..........................................................47
      5.2.4    Combined R&D and non-R&D innovation expenditure .................................................49
      5.2.5    Implications of the data ..................................................................................................50
    5.3    ADDRESSING THE COLLABORATION IMPERATIVE .........................................................................51
      5.3.1    Foundations for success ................................................................................................52
      5.3.2    Long term commitment ..................................................................................................52
      5.3.3    Management matters .....................................................................................................53
    5.4    TOWARDS PLACE-BASED STRATEGIES .......................................................................................54

                                                                                                                                                iii
Challenges for Australian Research & Innovation: UTS Innovation Occasional Paper
6 NEW POLICY DIRECTIONS .........................................................................................................57
6.1 ESTABLISH FOUR NEW RESEARCH COUNCILS IN NATIONAL SOCIO-ECONOMIC PRIORITY AREAS .....57
6.2 ESTABLISH A MINISTERIAL COUNCIL ON RESEARCH, SCIENCE AND INNOVATION ..........................57
6.3 INITIATE A MAJOR INVESTMENT COMMITMENT TO RDI IN NEW INDUSTRY TECHNOLOGY AREAS. .....58
6.4 CREATE MORE EFFECTIVE “INSTITUTIONS FOR RDI ENGAGEMENT” BETWEEN SECTORS ................59
6.5 ENCOURAGE UNIVERSITY RESEARCH INVESTMENT TO ALIGN MORE CLOSELY WITH INDUSTRIAL
STRATEGY ............................................................................................................................................59
6.6 DEVELOP AND IMPLEMENT A NATIONAL PLACE-BASED INNOVATION STRATEGY .............................59
ATTACHMENT 1: CASE EXAMPLES OF COLLABORATION IN AREAS OF HIGH RESEARCH
OUTPUT ................................................................................................................................................61
ATTACHMENT 2: ADDITIONAL TABLES AND CHARTS ..................................................................64
ATTACHMENT 3: POLICY EVOLUTION OF AUSTRALIAN INDUSTRY AND INNOVATION POLICY
...............................................................................................................................................................66
ATTACHMENT 5: EXPENDITURE ON R&D PROGRAMS 1989-90 – 2019-20 .................................76
ATTACHMENT 6: EXPENDITURE ON NON-R&D INNOVATION PROGRAMS 1978-79 – 2019-20
...............................................................................................................................................................81
REFERENCES.......................................................................................................................................83
List of Figures
FIGURE 1: GROSS EXPENDITURE ON R&D – AUSTRALIA AND THE OECD, LATEST YEAR AVAILABLE .............21
FIGURE 2: GROSS EXPENDITURE ON R&D – AUSTRALIA AND THE OECD, TREND 1981-2019 .....................22
FIGURE 3: COMMONWEALTH SUPPORT FOR SRI – INFLATION ADJUSTED - 2009-10 – 2019-20 ($’000) .......22
FIGURE 4: COMMONWEALTH SUPPORT FOR SRI - INFLATION ADJUSTED 1978-79 TO 2019-20 – MAJOR
CATEGORIES ($’000) ........................................................................................................................23
FIGURE 5: COMMONWEALTH SUPPORT FOR SRI – MAJOR PROGRAMS (INFLATION ADJUSTED) 2011-12 TO
2019-20 ..........................................................................................................................................24
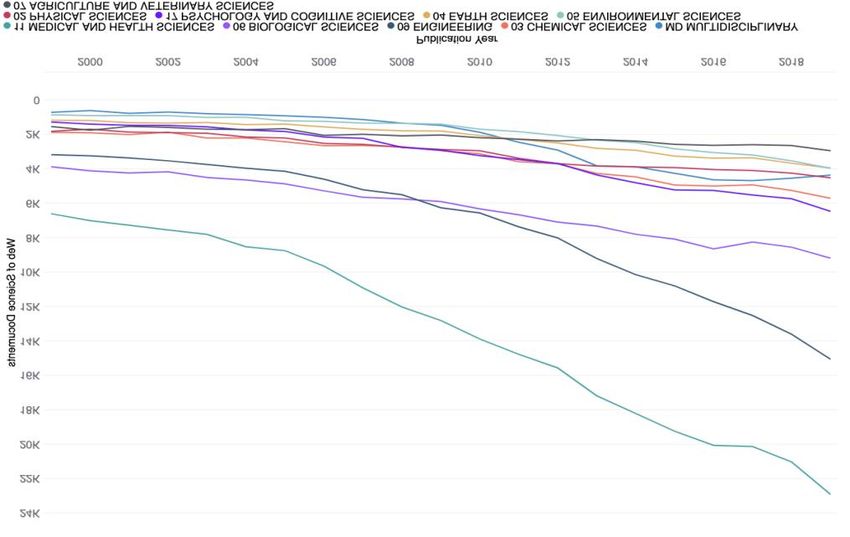
FIGURE 6: WEB OF SCIENCE DOCUMENTS, AUSTRALIA TREND 1999-2019 .................................................25
FIGURE 7: WEB OF SCIENCE RESEARCH DOCUMENTS - AUSTRALIAN COMPANIES 1999-2019 .....................26
FIGURE 8: WEB OF SCIENCE DOCUMENTS, AUSTRALIA, TREND 1999-2019 (ARTICLES, BOOKS, BOOK
CHAPTERS) ......................................................................................................................................27
FIGURE 9: FTE STAFF WITH A TEACHING ONLY OR TEACHING AND RESEARCH FUNCTION IN AN ACADEMIC
ORGANISATIONAL UNIT GROUP .........................................................................................................28
FIGURE 10: HIGHER EDUCATION EXPENDITURE ON R&D BY FIELDS OF RESEARCH, 2016 ............................29
FIGURE 11: HIGHER EDUCATION EXPENDITURE ON R&D, BY SOCIO-ECONOMIC OBJECTIVE, 2016 ..............30
FIGURE 12: HIGHER EDUCATION EXPENDITURE ON R&D BY SOURCE OF FUNDS .........................................31
FIGURE 13: BUSINESS, HIGHER EDUCATION AND GOVERNMENT R&D EXPENDITURE CATEGORISED BY FIELDS
OF RESEARCH ..................................................................................................................................32
FIGURE 14: RESEARCH EXPENDITURE BY SECTOR AND FIELD OF RESEARCH. .............................................33
FIGURE 15: AUSTRALIAN EXPENDITURE ON SRI 1978-79 TO 2019-20 BY SEO - INFLATION ADJUSTED .......43
FIGURE 16: AUSTRALIAN EXPENDITURE ON SRI 1978-79 TO 2019-20 - MULTIPLE OBJECTIVES - INFLATION
ADJUSTED........................................................................................................................................44
FIGURE 17: AUSTRALIAN EXPENDITURE ON SRI 1978-79 TO 2019-20 - NUMBER OF PROGRAMS BY SIZE OF
PROGRAM ........................................................................................................................................45
FIGURE 18: AUSTRALIAN EXPENDITURE ON SRI 1978-79 TO 2019-20 - PROPORTION OF PROGRAMS BY SIZE
OF PROGRAM (PERCENT) .................................................................................................................46
FIGURE 19: AUSTRALIAN EXPENDITURE ON SRI 1978-79 TO 2019-20 - PROPORTION OF PROGRAMS BY
PROGRAM EXPENDITURE (PERCENT) ................................................................................................46
FIGURE 20: AUSTRALIAN EXPENDITURE ON NON-R&D INNOVATION 2009-10 TO 2019-20 BY SEO - INFLATION
ADJUSTED........................................................................................................................................48
ivChallenges for Australian Research & Innovation: UTS Innovation Occasional Paper
FIGURE 21: AUSTRALIAN EXPENDITURE ON R&D AND NON R&D SRI 2008-09 TO 2019-20 (INFLATION
ADJUSTED) ......................................................................................................................................49
FIGURE 22: PROPORTION OF COUNTRIES’ RESEARCH INVESTMENT ALLOCATED TO SPECIFIC FIELDS OF
RESEARCH .......................................................................................................................................64
List of Tables
TABLE 1: COMMONWEALTH BUDGET SRI ALLOCATED TO SOCIOECONOMIC OBJECTIVES .............................10
TABLE 2: AUSTRALIA'S TOP 25 EXPORTS, GOODS AND SERVICES (A) ...........................................................12
TABLE 3: AUSTRALIA’S TOP 25 IMPORTS, GOODS AND SERVICES, (A) (B)......................................................14
TABLE 4: BUSINESS, UNIVERSITIES, GOVERNMENT: DIFFERENT CHARACTERISTICS AND DRIVERS ...............41
TABLE 5: AUSTRALIAN EXPENDITURE ON SRI 1998-89 TO 2019-20 BY SEO (5 YEARLY INTERVALS) -
INFLATION ADJUSTED .......................................................................................................................42
TABLE 6: AUSTRALIAN EXPENDITURE ON SRI – MULTIPLE CATEGORY, 2015-16 TO 2019-20 ......................43
TABLE 7: AUSTRALIAN EXPENDITURE ON RDI 1978-79 TO 2019-20 - NUMBER OF PROGRAMS FUNDED ......44
TABLE 8: AUSTRALIAN EXPENDITURE ON NON-R&D RDI 1978-79 TO 2019-20 SEO CATEGORIES (INFLATION
ADJUSTED) ......................................................................................................................................47
TABLE 9: MAJOR PROGRAM COMMITMENTS – NON-R&D INNOVATION EXPENDITURE ON INDUSTRIAL
PRODUCTION AND TECHNOLOGY 1997-98 TO 2019-20 ......................................................................48
TABLE 10: AUSTRALIAN EXPENDITURE ON R&D AND NON R&D SRI 2008-09 TO 2019-20 (INFLATION
ADJUSTED) ......................................................................................................................................49
TABLE 11: INTERNATIONAL COMPARISONS OF RESEARCH OUTPUTS CLASSIFIED BY FIELDS OF RESEARCH ....64
TABLE 12: INCREASE IN RESEARCH OUTPUT 1999-2018 ACROSS FIELDS OF RESEARCH .............................65
TABLE 13: AUSTRALIAN GOVERNMENT R&D PROGRAMS AND ACTIVITIES VALUED AT OVER $100 MILLION IN
2018-19 FROM 2009-10. INFLATION ADJUSTED.................................................................................65
vChallenges for Australian Research & Innovation: UTS Innovation Occasional Paper
Executive Summary
Australia is experiencing a public health crisis and a challenge of economic recovery. The
crisis and the challenge sit in front of a more fundamental threat to Australia’s future that lies
in the need to respond to the forces of climate change and move from an economy where
wealth has been created by exploitation of mineral fuels and consumer demand driven by high
levels of immigration, to one driven by knowledge and technology. We must move from a
second world to a first-world nation.
Australia must look for new sources of growth in this post-carbon future. These sources of
growth will be built on the development and application of new technologies to revitalize
industries that suffered as a result of the importation of cheaper manufactured goods, and the
creation of “new industries” formed around the application of new technologies, such as big
data and analytics, automation and robotics, simulation, visualization and augmented reality,
and cloud based platforms.
New sources of growth will be the outcome of a national commitment to research,
development, and innovation within a framework of a National Recovery Plan that will form
the basis of a National Industrial Strategy.
Nations have done well when they start planning for the future in the midst of a crisis. Without
reverting to protectionism, Australia must become more self-sufficient in the production of
goods and services that have relied on complex supply chains, which can be dislocated in the
event of a crisis. Risks must be managed. Many would argue that we have lost the capacity
to make things – although we are good at consuming them.
The crisis has pointed to the strength of Australian agriculture, but even there we export much
of the raw produce and let others do the processing - and then we bring it back again as a
manufactured product. We allowed the wool industry to largely disappear as a result of agri-
politics. And we allowed manufacturing to disappear by a failure to respond to the challenge
of international competition – continuing to produce fair average quality commodity-based
products, whilst others charged ahead based on a heavy commitment to RDI.
We must dispense with the idea that an active industrial strategy is about “picking winners”,
that we can import RDI from overseas, and address system failures such as the very poor
interaction between industry and universities. We can take the lead from the Australia 2030
Innovation Strategy and look for national missions that will guide RDI investment and the
creation of new industries.
Australian investment in RDI has been declining for many years, due in large part to the failure
of business and government to invest. However, universities have been increasing their
commitment. The result has been a mismatch between university investment priorities and the
priorities of business and industry to deliver products and services based on internationally
competitive leading-edge research and invention.
Universities have done a fantastic job of investing in health and medical research that has
delivered new products and services in medical devices, pharmaceuticals, and vaccines. It
has placed Australia in a good position to confront the current health crisis. It is time to think
about a similar result for Engineering and Technology.
1Challenges for Australian Research & Innovation: UTS Innovation Occasional Paper
A revitalisation of investment in technology and engineering is essential to address the
challenge in moving to new sources of growth.
To create the future, we must address and close the policy gaps. Numerous funding programs
and cross-cutting Ministerial and Commonwealth-State responsibilities means that we do not
currently have any semblance of an industrial strategy or coherent innovation policy. There is
some support for sector-based strategies and innovation district initiatives – but the
commitment is weak across Government, and expenditure is reported “after the event” instead
of being driven by clear missions, objectives, and outcomes.
To recover from the present health and economic crises we must develop an industrial
strategy and innovation policy that can move Australia to a post-carbon future, we must draw
on Australian responses to previous crises, such as the Post War Reconstruction commitment,
and avoid the policy failures surrounding responses to previous crises such as the 1974 oil
shock, and the restructuring of the economy required after the removal of industry protection
regimes and introduction of microeconomic reforms in the early 1990s.
In particular, we must:
1. Make a commitment to a national industrial strategy with a new body charged with
responsibility for the development and implementation of a national industrial strategy
and innovation policy, with a remit to identify, plan, and commit to specific national
missions. It could be referred to as the National Industrial Strategy and Innovation
Commission. The present Productivity Commission would advise the new Commission
on specific micro-economic issues.
2. Develop and adopt a consistent and coherent policy framework across all agencies with
an industrial policy remit to put an end to the fragmentation of programs across
Ministerial portfolios, departments, and agencies. Policy must obtain high level
cooperation and coordination with the States/Territories, respecting State/Territory roles
and responsibilities, and their front line capacity for implementation and delivery.
3. Make a sizeable RDI investment commitment in industrial sectors critical to Australia’s
technology and innovation future: Energy (renewable particularly); Land, Water, and
Climate Change; Transport, Communication and Infrastructure; and Industrial
Production and Technology.
Investment in each sector would be driven by four new Research Investment Councils.
They would complement the investment mandates of the NH&MRC and the Rural RDCs.
The ARC would continue to invest in the Humanities, Arts, and Social Sciences.
4. Address workforce development, education, and training imperatives to ensure that
people can acquire both the high level occupational and academic skills required for
industrial growth in the industries of the future. The small and mostly disconnected
STEM training initiatives across the Commonwealth and States/Territories must be
consolidated. The current high level of participation in Health education and training
should be replicated in the Engineering and Technology fields.
5. Secure a much higher level of university-industry collaboration with a better match of
research and innovation priorities supported by the Research Investment Councils and
financial support for university-industry Engineering and Technology Research
Institutes, drawing on the Fraunhofer framework.
2Challenges for Australian Research & Innovation: UTS Innovation Occasional Paper
6. Support innovation place-making through investment in nationally significant precincts,
districts, and clusters that will facilitate the formation of high growth new technology
businesses (start-ups) and scale up through smart specialisation strategies in global
markets and value chains.
The health crisis and the current uncertain economic future provides the essential foundation
for a National Recovery Plan that has Science, Research, and Innovation at its heart. But we
can be assured that economic recovery will not be back to “business as usual”. Industries that
have collapsed, which have relied on low cost, casual, part-time, and unskilled workers, may
never recover.
This Paper addresses the issues in the following Sections:
• An introduction that sets the scene, the problems and opportunities (Section 1)
• A detailed outline of the Challenges ahead (Section 2)
• The current Research, Development and Investment Climate (Section 3)
• Policy gaps, failures and opportunities (Section 4)
• Policy imperatives that must be addressed (section 5)
• Recommendations for new policy directions (Section 6).
3Challenges for Australian Research & Innovation: UTS Innovation Occasional Paper
1 Introduction
COVID-19, and the public health response, has created a national economic crisis. But it has
also created an opportunity to transform the economy to new sources of growth.
Five growth factors have underpinned Australia’s current economic prosperity:
• Growth in consumer demand, stimulated by an extensive net migration program and a
high level of international tourists
• Growth in exports of resource-based commodities, particularly iron ore, coal, and natural
gas
• Increase in the export of education services
• Increase in government expenditure on infrastructure (Commonwealth, State and Local)
• Increase in the level of manufacturing imports – sustained by the high level of exports.
Over the last two months consumer demand has collapsed
contributing to the current economic crisis, and the export of
education services is under stress. This has underscored the
imperative to find new sources of growth.
1.1 Winds of change
There are already many warning signs on the horizon, and the risks to living standards of
taking no action are recognised as being high. The fuels for a burning platform have been
accumulating, albeit slowly. Already climate change and global warming are placing a cloud
over the continuation of demand for our mineral fuels, particularly as countries and regions
aim to achieve a net zero carbon1 emissions target by 2050 – in thirty years’ time. But with
short-term political and news cycles, there has been little motivation to seriously address the
longer term.
The COVID-19 pandemic has changed that. It has accelerated the need for structural
adjustment as production and distribution systems change. The collapse of the global tourism
industry provides a stark warning. Some sectors have been hit hard, such as retail,
accommodation, travel, food service, sport and recreation, and the creative industries.
Recovery will be tough and possibly accelerate changes that are already underway, such as
online retailing and platform-based food, marketing, and travel services.
But other sectors are doing well, such as farming, food processing, health and medical
services, front line public services, advanced manufacturing, and distribution and delivery of
online purchases. The pandemic, and before that, the bushfire crisis, has helped us appreciate
the value of people who work in front-line service and emergency services. Hopefully, we have
recognised the error and the consequences of austerity and efficiency-driven cutbacks in
these essential services.
1"Carbon" is shorthand for greenhouse gas emissions, including CO2, methane, nitrous oxide and F-gases. These gases are released
by many different types of activity – not just the burning of fossil fuels, but also farming, deforestation and some industrial processes.
4Challenges for Australian Research & Innovation: UTS Innovation Occasional Paper
Services in a crisis do not respond well to Machine Learning, AI, Automation, and Robotics.
They require humanity and compassion.
We do not know the extent to which the economic crisis created by the pandemic will stimulate
a fundamental shift in patterns of consumer demand and industrial supply. But shifts are likely
as demand recovers, enabled by a massive injection of government expenditure and the
phasing down of lock-down regulations, and consumers continue to re-orient their wants and
preferences towards low carbon products and services.
In contrast to the economic stimulus of 2008, the current package of stimulus measures
provides little for new asset creation, particularly new knowledge assets. The injection of
capital funds into the universities in 2008 has had a massive impact in lifting research capacity
and capability, particularly in medical science. This time, and in setting pathways to new
sources of growth, investments in technology and engineering research capability would be
well made, and consistent with the strategies outlined in this Paper.
We do know from economic and industrial history that crises stimulate innovation and, in turn,
call forward innovations in advanced technology and engineering.
The crisis of World War II for example, stimulated action to increase the supply of domestically
produced goods and services to meet pent up consumer demand. A planning and capability
response orchestrated by the Department of Post-war Reconstruction (formed in 1942), the
1945 Economic White Paper, and a group of talented public service development economists
resulted in the “long boom” that continued until the oil shock of 1973.
Regrettably, the transition to a post tariff/post protectionist economy
from 1973 was not well planned, and we are now likely to suffer the
consequences for lack of prescience and preparedness for a low
carbon economy.
This lack of preparedness has arisen notwithstanding the extensive “library” of economic
policy statements and industry strategy papers that have been commissioned and released
from that time. The failure of policy is documented in Attachment 3 “Evolution of Australian
Industry and Innovation Policy”.
The present crisis provides an opportunity to re-align the public science and research system
with the opportunities for industrial innovation and growth in a post-carbon economy. The
present lack of alignment, or mismatch, between public science (mainly carried out in
universities) and industry innovation (carried out in business) is a major focus of this Paper. A
quantum lift in investment in Technology and Engineering research is a precondition for finding
new sources of growth.
A major investment in Technology and Engineering would be a foundation plank in a National
Recovery Plan for economic and industry renewal as the pandemic subsides, and the
damage to the economy becomes apparent, and the opportunities and potential strengths are
revealed.
5Challenges for Australian Research & Innovation: UTS Innovation Occasional Paper
1.2 Towards new sources of growth
We need not repeat the policy failures of the past. Australia can seize the opportunity created
by the disruption of the COVID-19 pandemic to start seriously investing in new sources of
growth to guide us into a post carbon industrial framework. This will require a clearly articulated
long term and visionary industrial strategy and national innovation policy that commences with
a step change commitment to investment in Science, Research, and Innovation (SRI).
New investments in growth opportunities will require moving away from sources of growth
associated with exploitation of mineral fuels, and heavy utilisation of those fuels, including
energy production, building and construction, and transport and travel, to industries adopting
and applying “New Industry” technologies – autonomous systems, big data and analytics,
sensing and robotics, visualisation, and renewable energy sources. But the build-up of
compassion and humanity that has come out of the pandemic must be retained through the
adjustment processes.
There has already been a strong and growing pressure from within business and the
community to reduce Australia’s dependence on coal and other mineral fuels to achieve a
target of zero net carbon emissions in Australia by 2050. There is, of course, an entrenched
and vocal group more comfortable with the status quo. But satellite images of big polluting
cities before and after the onset of the pandemic and industry lockdowns provide the stark
reality of what life might look like in a post-carbon future.
Pressure is also mounting to reduce reliance on international tourism as a growth driver.
Greater pressure on the tourism industry is likely as governments introduce human health
safety checks on international travellers in a similar regime to biosecurity and food safety
inspections administered by the former Australian Quarantine and Inspection Service (AQIS).
In the future, the international cruise industry is likely to be much more tightly regulated from
a health risk perspective.
This may be opportune. Cruise ships and aircraft are heavy users of carbon fuels. The
pressure of tourism on metropolitan infrastructure is raising concerns, as is the environmental
impacts in both cities and regions. Economists are well paid to extol the benefits in terms of
“big numbers”, but now closer examination is being given to the costs – costs of crowding,
asset degradation, and provision of new public infrastructure. But this creates sensitivities, as
the industry is a substantial employer of unskilled casual and part-time workers. Moderation
must be embedded in the way forward.
A serious and sustained commitment to technical skills development and training for displaced
unskilled workers in the holiday economy can provide an opportunity for this cohort to work in
the high technology “knowledge” jobs that will be required in the transition to new sources of
growth. Already, technical skills are in short supply in growing technology-driven industries
and, continued reliance on the 482 TSS visa scheme is not a serious option. We all have a
responsibility to raise the education and training aspirations of this group.
Achieving net-zero emissions target by 2050, and the adjustments
that will be required in the structure of the economy is sufficiently
important for Australia’s future to be adopted as a national mission.
6Challenges for Australian Research & Innovation: UTS Innovation Occasional Paper
Above all, we need to reinvent manufacturing (“making things”) as a high technology industry
and disrupt the current policy model that reflects a historical path dependency, a protectionist
“hangover”, an aversion to “picking winners”, and address system failures. Market-based
resource allocation mechanisms are important, but they must be guided by a visible hand that
provides leadership and supporting investments in expensive next-generation infrastructure
(including broadband), scientific discovery to create new knowledge and the creation of new
technologies that capture the opportunities created by the digital revolution.
1.3 A national mission
Countries and regions are increasingly embracing missions to guide investment, technology
development, and resource allocation. Getting a Man on the Moon is probably the most well-
known and popularly used anecdote. Like winning a battle (or war), the path towards achieving
a mission requires plans (strategies) and tactics. It involved pulling through previously
unthought-of technologies, which were, in turn, widely taken up in industry. Think Teflon.
Achieving a national mission for net-zero carbon emissions will require the development of
industrial strategies that focus on developing the potential for new sources of growth – new
jobs in new industries and in industries that will be transformed by technology.
The impact and post-adjustment to COVID-19 provides a space to think about that. Some of
those industries will be brand new, while others might be extensions of existing ones, and
some might involve the reconstruction of industries decimated by the flood of imports that
followed the removal of tariff protection, or the failure to compete effectively on a global stage
– such as agriculture.
A national mission is both a set of challenges as well as a statement of intended achievement.
Of course, a national mission is a little hollow if there is little commitment to developing the
instruments of how to get there. Fundamentally, one of those instruments is new investment
in Science, Research, and Innovation.
Long term Science Research and Innovation Strategy policies must support the technological
breakthroughs and changes that will be required for the transformation of currently high
carbon-emitting industries – such as transport, electricity production, residential and
commercial buildings, and agriculture – to lower carbon footprints. It means innovation – not
continuous or incremental improvement.
Strategy development and design of implementation frameworks takes time. Moreover, design
must be sufficiently agile, responsive, and flexible to changing internal and external constraints
and opportunities – particularly when looking at a 30-year time frame.
SRI strategies must stimulate the new scientific discoveries that will provide the foundations
for technological breakthroughs. They must also provide the investments in education and
training that will build the skills, knowledge, and capabilities in applying new technologies in
new jobs in new industrial processes.
7Challenges for Australian Research & Innovation: UTS Innovation Occasional Paper
The capacity to create new technologies means reversing the trend
decline in business and government investment in SRI capability that
has occurred over the last 20 years
Strategy must also build commitment and engagement across the three main research
performing sectors of the economy – business, universities, and government (and specifically,
government research agencies). In Australia, Government commitment is captured principally
in the CSIRO. Most attention is required for sustained improvement in business-university
engagement.
1.4 Business-university engagement
We might be able to take some comfort from the trend increase in university commitment to
SRI research. However, this has been sourced precariously from growth in student fees and
accumulated internal funding. Moreover, the current direction of university SRI investment
reflects a significant mismatch between the priorities of university research and the purposes
identified by Australian industry for new knowledge and technologies.
The fundamentally different missions of universities and industry create a challenge for
effective engagement and collaboration between the two sectors.
Public pronouncements indicate that both sectors would like to be closer. This means that the
two sets of institutions must understand the barriers to, and the opportunities for productive
collaboration - including the role of universities in building national and regional innovation
capability in both existing firms and in high potential start-ups, and the obligation of business
to deliver a return on investment.
Governments cannot mandate collaboration and engagement, but they can invest in building
the frameworks for long term partnerships. This has not been happening. Both universities
and business consider that national government SRI policy has been failing in this endeavour.
Government SRI policy at the national level has been characterised by program gaps and
discontinuities and a lack of commitment over a considerable period. Apart from the
Cooperative Research Centre (CRC) program, there is no consistent long-term policy
framework to drive collaboration between business and universities – and even here, the focus
of the program has shifted many times. Many programs have been too small, and too short
term, to make a difference.
The Commonwealth commitment to SRI has declined (in inflation-
adjusted terms) from $10,639m in 2011-12 to $9,493m in 2019-20 a fall
of 10.8% over eight years.
State and Territory governments have stepped in to fill the gap, commencing with the
Queensland Smart State Program and the Victorian Science, Technology and Innovation
initiative at the beginning of the century. These were heavily concentrated in the health and
biosciences fields. Queensland commitment continues with the Advance Queensland
initiative. Other governments have an interest but invest very little. There is also an element
8Challenges for Australian Research & Innovation: UTS Innovation Occasional Paper
of opportunism as States look to developing their own Defence, Space, and Cybersecurity
industries.
1.5 A new national approach to SRI strategy and resourcing
The current approach to industrial strategy is nether mission-oriented or strategic. It is an
aggregation of largely disconnected funding programs, policy documents, and
announcements. There is a surfeit of glossy publications containing highly rendered images,
photos of Ministers, stock images of cross-cultural people in white coats, aspirational
phraseology, some big numbers, colourful charts - and overall slick presentation.
Some of the more serious efforts at strategy development are reflected in the Australia 2030
Innovation Strategy and the National Science Statement of 20172. The Government’s vision
for science, set out in the National Science Statement, covers:
• Engaging all Australians with science
• Building our scientific capability and skills
• Producing new research, knowledge and technologies
• Improving and enriching Australians’ lives through science and research
The Statement indicates that Government’s support is provided by “funding and other
resources for the spectrum of basic to applied scientific research, critical scientific
infrastructure and equipment, and science and mathematics education, directly investing in
Australia’s future”. The approach to implementation and delivery is very much “hands off”:
Through coordination and governance arrangements such as the National Science and Research
Priorities, the government will continue to set strategic direction and priorities for Australian science.
Along with advice from the Chief Scientist and bodies such as the Commonwealth Science Council
and Innovation and Science Australia, this coordination will help shape the research that is carried
out, delivering the outcomes and applications that tackle national and global challenges and take
advantage of Australia’s unique opportunities. Coordinated strategic action will also build awareness
of systematic strengths and gaps in Australia’s scientific capabilities3.
The way in which the current Australian Science and Research
priorities link to the development of Australian industry – or an
Industrial Strategy – is at best uncertain.
In 2019 the Government reported in the annual publication, Science, Research and Innovation
(SRI) Budget Tables4 there were 139 separate Commonwealth SRI assistance or support
programs unevenly spread over 14 Socioeconomic Objectives (SEOs). The allocation of 2019-
20 budget expenditure is shown in Table 1.
2 https://publications.industry.gov.au/publications/nationalsciencestatement/index.html
3 https://publications.industry.gov.au/publications/nationalsciencestatement/index.html
4 https://www.industry.gov.au/data-and-publications/science-research-and-innovation-sri-budget-tables
9Challenges for Australian Research & Innovation: UTS Innovation Occasional Paper
Table 1: Commonwealth Budget SRI allocated to Socioeconomic Objectives
SEO Category Number of Programs
2019-20 Budget Proportion of total
Expenditure ($m)
00. Multiple categories1 10 4,337.7 45.0%
01. Exploration and exploitation of the Earth 3 130.7 1.4%
02. Environment 7 53.1 0.6%
03. Space 1 42.8 0.4%
04. Transport, comms, other infrastructures 3 2.6 0.0%
05. Energy 4 235.5 2.4%
06. Industrial production 7 238.9 2.5%
07. Health 36 1,412.9 14.7%
08. Agriculture 23 479.5 5.0%
09. Education 0 0 0.0%
10. Culture, recreation, religion and mass media 0 0 0.0%
11. Political and social systems 23 48.1 0.5%
12. General advancement of knowledge 12 2,177.5 22.6%
14. Defence 10 476.5 4.9%
139 9,635.8 100.0%
1.Includes R&D Tax Incentive, CSIRO, ANSTO, GeoScience Australia, AIMS, Met Bureau, ARC, National Collaborative
Research Infrastructure.
Source:
There is a loose connection between the SEO categories and the National Science and
Research priorities, which cover nine functional areas:
• Food, Soil and water (08 Agriculture and 06 Industrial Production)
• Cybersecurity
• Energy (05 Energy)
• Resources (01 Exploration and Exploitation of the Earth)
• Advanced Manufacturing (06 Industrial Production)
• Environmental Change (02 Environment)
• Health (07 Health)
Table 1 indicates that 45% of the science budget is allocated to “Multiple categories” and
22.6% to General Advancement of Knowledge - where objectives are, in effect, determined
by the strategic priorities of the agencies concerned, including universities. These allocations
would be expected to take account of the National Science and Research priorities5. With the
exception of Health and Agriculture, the budget allocations to specific industry categories are
exceptionally small.
Table 1 would suggest that the RDI for industries that will be important for achieving new
sources of growth are grossly underfunded – particularly Industrial Production, Energy
(specifically renewable energy), the Environment, and Transport, Communication and
Infrastructure.
However, the classification indicates that expenditure associated with many of the SEOs that
are potentially important for a transition to new sources of growth are seriously underfunded
with commitment to many appearing to be uncoordinated across Ministerial Portfolio
responsibilities.
1.6 New investment and resource allocation frameworks
It is of note that the industries with the highest SRI investment commitment are the ones
supported by specific and long-standing resource allocation frameworks. Others have suffered
5 See https://www.industry.gov.au/data-and-publications/australias-national-science-statement
10Challenges for Australian Research & Innovation: UTS Innovation Occasional Paper
from austerity-driven budget cuts and very short-term program commitments. Two resource
allocation frameworks have achieved significant success in building RDI capability and
industry performance:
• Health and Medical Research – through the NH&MRC, the MRFF, Philanthropy, and
State government initiatives
• Agriculture – the Rural Research and Development Corporations (and a successor
organisation that addresses cross-sectorial research and innovation).
These frameworks provide models for the industries that will be expected to lead in
transitioning to new sources of growth.
Research in the SEOs that are important for the transition to new
sources of growth should be strongly supported by a substantial and
targeted increase in commitment and financial investment by
Government, Business, and Universities working collaboratively.
The allocation of that commitment should be mission-driven, strategically directed,
coordinated, and assigned through four new formally constituted Research Investment
Councils that would cover:
• Energy – particularly renewable energy and energy innovations including hydrogen;
• Land, Water, and Climate Change – to take a serious research and evidence-based
commitment to the protection, preservation, and restoration of our natural capital as a
basis for addressing the net zero emissions target
• Transport, Communications and Infrastructure - to address the urgent need for RDI in
the context of change and disruption that is occurring in these industry sectors
• Industrial Production and Technology – science, research, and innovation to discover
new knowledge and develop technologies in new industry categories.
The Councils would take on similar roles to the NH&MRC and the Rural Research and
Development Corporations. The role of the Australian Research Council would continue to
drive strategy in the Humanities, Arts and Social Sciences.
The work of the Councils would be coordinated by a Ministerial Council on Science, Research,
and Innovation. The Councils would include Ministers with Portfolio responsibility for the
Councils together with Ministers responsible for the ARC (Education), the NH&MRC (Health),
the Rural RDCs (Agriculture) and Defence Innovation.
This Paper provides a detailed analysis of the background relating to our current predicament
and enlarges on ways to set a direction for sustained growth in a carbon-neutral industrial
structure created by the opportunity of the COVID-19 crisis.
11Challenges for Australian Research & Innovation: UTS Innovation Occasional Paper
2 The challenge ahead: finding new sources of growth
Australia has enjoyed a prolonged period of economic growth, which has created jobs, raised
living standards and funded expansion of health and education services. However, serious
economic commentators and innovation analysts would argue that continued success is very
far from assured.
This has come to an end with the onset of the COVID-19 pandemic, the disruption created by
the public health response, and the instability introduced into the structure of employment,
incomes, and growth opportunities.
2.1 The problem
The problem for Australia in a post-mining boom context has been for some time, “How to
transition to new sources of growth as commodity prices and investments in resources
projects normalise” (Lydon et al., 2014, Green and Howard, 2015a, Green and Howard,
2015c, Green et al., 2012). But the question has not taken on the urgency that might be
expected. This may reflect some confidence that the mining boom will continue for some time
to come - but pressures are mounting with the increasing groundswell of opinion supporting a
commitment to net-zero carbon emissions by 2050.
New sources of growth will be the outcome of a national commitment to research,
development and innovation (RDI) to revitalise the performance of existing industries and the
evolution of new ones.
Prescience and preparedness through RDI must be key planks in
Australia’s industrial strategy and innovation policy.
In 2018-19 Australia’s exports of goods and services amounted to $469.9 billion, representing
24.1% of GDP6. The top 25 exports for the years 2016-17 to 2018-19, which amount to 79%
of all exports are listed in Table 2 below.
Table 2: Australia's top 25 Exports, goods and services (a)
Rank Commodity 2016-17 $m 2017-18 2018- 2018-19 Growth 5-year
$m 19 $m % 2017-18 – growth
share 2018-19 % trend
(%)
Mining and mineral fuels
1 Iron ores & concentrates 62,617 61,392 77,189 16.4 25.7 2.3
2 Coal (c) 54,236 60,379 69,592 14.8 15.3 14.1
3 Natural gas 22,308 30,907 49,731 10.6 60.9 23.7
6 Gold 18,979 19,293 18,867 4.0 -2.2 8.8
7 Aluminium ores & conc (incl alumina) 7,529 9,448 11,358 2.4 20.2 12.4
9 Crude petroleum 5,150 6,506 8,491 1.8 30.5 -4.8
10 Copper ores & concentrates 4,577 5,700 5,936 1.3 4.1 2.5
16 Aluminium 3,272 4,096 4,251 0.9 3.8 1.2
17 Copper 3,128 2,891 3,968 0.8 37.3 -0.7
20 Other ores & concentrates 2,602 3,140 3,554 0.8 13.2 -7.4
23 Refined petroleum 2,347 2,626 3,005 0.6 14.4 1.9
54.4
Rural production
8 Beef, f.c.f. 7,115 7,963 9,476 2.0 19.0 4.0
12 Meat (excl beef), f.c.f. 3,831 4,526 5,152 1.1 13.8 8.0
18 Wool & other animal hair (incl tops) 3,263 3,985 3,815 0.8 -4.2 10.2
19 Wheat 6,073 4,652 3,657 0.8 -21.4 -7.9
4.7
6 https://www.abs.gov.au/AUSSTATS/abs@.nsf/DetailsPage/5204.02018-19?OpenDocument
12Challenges for Australian Research & Innovation: UTS Innovation Occasional Paper
Rank Commodity 2016-17 $m 2017-18 2018- 2018-19 Growth 5-year
$m 19 $m % 2017-18 – growth
share 2018-19 % trend
(%)
Manufactured products
21 Alcoholic beverages 2,612 3,111 3,374 0.7 8.5 11.2
24 Pharm products (excl medicaments) 1,317 1,583 2,953 0.6 86.6 41.3
25 Edible products & preparations, nes 2,524 3,007 2,943 0.6 -2.1 27.1
1.9
Services
4 Education-related travel services (d) 28,093 32,602 37,556 8.0 15.2 15.2
5 Personal travel (excl education) 21,628 21,332 22,450 4.8 5.2 5.8
services
11 Professional services 4,943 5,196 5,626 1.2 8.3 3.5
13 Telecom, computer & information 3,332 4,219 5,081 1.1 20.4 14.6
services
14 Financial services 3,965 4,569 4,933 1.0 8.0 7.4
15 Technical & other business services 4,511 4,436 4,662 1.0 5.1 5.9
22 Passenger transport services (e) 2,833 2,936 3,075 0.7 4.7 5.4
17.8
Total – all exports (b) 373,769 403,360 470,170 16.6 7.4
Education (g) 28,604 33,197 nya .. .. ..
Tourism Satellite Account 34,561 37,200 nya .. .. ..
(a) Goods trade is on a recorded trade basis; Services trade is on a balance of payments basis. (b) Balance of payments (BOP)
basis. (c) Includes BOP adjustment. (d) Includes student expenditure on tuition fees and living expenses. (e) Mainly of Lead, Zinc
and Manganese ores & concentrates. (f) Includes Related agency fees & commissions. (g) Includes Education-related travel
services, Royalties on education services and Other education services.
nya = not yet available; f.c.f. - fresh, chilled, frozen
Based on ABS trade data on DFAT STARS database and ABS catalogues 5368.0 (Sep 2019) & 5429.0.
https://www.dfat.gov.au/sites/default/files/australias-goods-services-by-top-25-exports-2018-19.xlsx
Table 2 shows that the five-year trend growth in exports to 2018-19 has been 7.4%, but
between 2017-18 and 2018-19, exports grew by 16.6%. This growth has been driven by a
boom in mining and mineral fuels exports, due to increased volumes and high commodity
prices. In 2018-19, 54.4% of exports were mining and mineral related, contributing 13.1% to
GDP. Just three commodities (iron ore, coal, and natural gas) contributed almost 42% to
exports.
This position reinforces the question about transition.
2.2 Finding the opportunities
• It is widely acknowledged that mineral fuels have a limited future as an energy source
and iron ore exports are contingent largely on future trends in the Chinese economy.
• Unprocessed agriculture exports are subject to strong competition from developing
nations and the emergence of substitutes (plant-based protein as a replacement for
meat, for example).
• Drought and climate change will have long term impacts on capacity to produce at
current volumes, and ethical concerns and social license to operate will also have an
impact.
Australia relies heavily on the current boom in mining and mineral
fuels for our current prosperity. With many countries moving to a
position of net-zero carbon emissions and switching to renewable
energy sources, it is unrealistic to think that the boom will continue.
As a nation, and as an economy, it would seem highly unlikely that we can rely indefinitely on
commodity exports to underwrite our economic future. The dramatic decline of Australia’s wool
export market is a salutary example that things can go wrong (Massy, 2011).
At the same time, there are remarkable opportunities for Australian firms to export more
manufactured final and intermediate goods, as well as value-added knowledge-intensive
13Challenges for Australian Research & Innovation: UTS Innovation Occasional Paper
services, to meet the needs of the global market, particularly Asian end-users. This means
active participation in global value chains. But here again, Australia enjoys no guarantee of
success.
There are also opportunities to address the exceptionally large volume of imports into Australia
through “re-shoring” and de-risking reliance on some aspects of global supply chains. In 2018-
19 Australia imported goods and services to the value of $421.4 billion, up by 6.5% over the
previous year. The top 25 import categories are listed in Table 3 below.
Table 3: Australia’s top 25 imports, goods and services, (a) (b)
2016- 2017- 2018- 2018- Growth 5-year
Rank Commodity 17 $m 18 $m 19 $m 19 % 2017-18 – growth
share 2018-19 % trend (%)
Mining and mineral fuels
12 Gold 7,240 6,540 5,517 1.3 -15.6 7.6
2 Refined petroleum 17,389 21,688 25,083 6.0 15.7 5.7
5 Crude petroleum 8,574 11,738 13,412 3.2 14.3 -8.1
10.5
Manufactured products
3 Passenger motor vehicles 21,782 23,299 21,574 5.1 -7.4 4.7
4 Telecom equipment & parts 11,969 13,412 14,590 3.5 8.8 8.9
6 Goods vehicles 8,004 10,181 10,571 2.5 3.8 13.4
8 Computers 7,854 8,837 9,763 2.3 10.5 5.5
14 Civil engineering equipment & parts 2,879 4,244 5,085 1.2 19.8 10.1
11 Medicaments (incl veterinary) 7,340 7,169 7,481 1.8 4.4 -0.4
16 Furniture, mattresses & cushions 4,203 4,497 4,990 1.2 11.0 6.5
18 Pharm products (excl medicaments) 3,931 4,283 4,842 1.1 13.0 15.6
20 Electrical machinery & parts, nes 3,383 3,693 3,960 0.9 7.2 6.0
21 Plastic articles, nes 3,292 3,550 3,863 0.9 8.8 7.6
22 Household-type equipment, nes 3,330 3,346 3,664 0.9 9.5 6.5
23 Measuring & analysing instruments 3,038 3,256 3,641 0.9 11.8 2.4
24 Prams, toys, games & sporting goods 3,207 3,322 3,517 0.8 5.9 5.4
25 Medical instruments (incl veterinary) 2,946 3,268 3,412 0.8 4.4 8.0
23.9
Services
1 Personal travel (excl education) services 37,731 42,684 46,343 11.0 8.6 7.2
9 Professional services 6,123 6,657 7,775 1.8 16.8 7.7
7 Freight transport services 8,429 9,428 10,114 2.4 7.3 -0.3
10 Passenger transport services (d) 6,789 7,139 7,534 1.8 5.5 3.8
13 Technical & other business services 4,739 5,168 5,457 1.3 5.6 -3.0
15 Charges for the use of intellectual 4,304 4,625 4,996 1.2 8.0 2.5
property nie
17 Telecomms, Computer & information 3,559 4,253 4,878 1.2 14.7 10.7
services
19 Business travel services 4,176 4,208 4,296 1.0 2.1 2.7
21.7
Total – all imports(c) 362,898 395,645 421,394 6.5 4.1
Education (e) 515 452 nya .. .. ..
Tourism Satellite Account 46,766 48,610 nya .. .. ..
(a) Goods trade is on a recorded trade basis, Services trade is on a balance of payments basis. (b) Please note – imports of aircraft
were made confidential by the ABS from Sep-08 onwards. Imports of aircraft would be ranked in Australia's top 25 imports in 2018-
19 estimated to be valued at around $4.6bn. (c) Balance of payments basis. (d) Includes Related agency fees & commissions. (e)
Education includes Education-related travel services, Royalties on education services and Other education services.
nya = not yet available; nes - not elsewhere
specified.
Based on ABS trade data on DFAT STARS database and ABS catalogues 5368.0 (Sep 2019) & 5429.0.
Source: https://www.dfat.gov.au/sites/default/files/australias-goods-services-by-top-25-imports-2018-19.xlsx
2.3 Reinventing manufacturing
Table 3 indicates that Manufacturing imports accounted for almost a quarter (23.9%) of
imports. Two-thirds of Australia’s total imports in 2018-2019 were purchased from ASEAN
countries. European trade partners accounted for 19.2% and 12.3% from the United States7.
7 https://www.dfat.gov.au/sites/default/files/australias-goods-services-by-top-15-partners-2018-19.xlsx
14You can also read