INVESTMENT COSTS AND POLICY ACTION OPPORTUNITIES FOR REACHING A WORLD WITHOUT HUNGER (SDG 2) - Bundesministerium für wirtschaftliche ...
←
→
Page content transcription
If your browser does not render page correctly, please read the page content below
INVESTMENT COSTS AND POLICY ACTION
OPPORTUNITIES FOR REACHING A WORLD
WITHOUT HUNGER (SDG 2)

Center for Development Research (ZEF) of the University
of Bonn in cooperation with the Food and Agriculture
Organization of the United Nations (FAO)

                                        OCTOBER 2020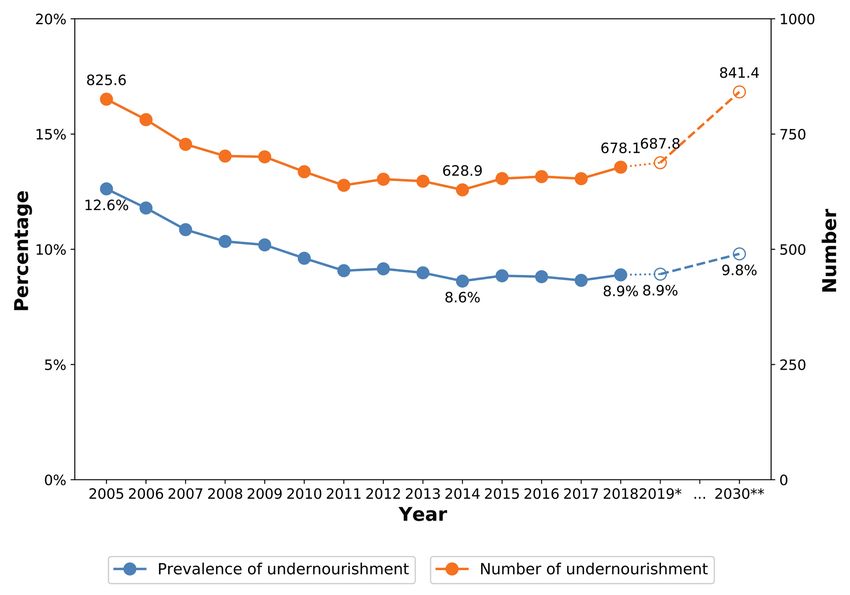
IMPRINT:
Center for Development Research (ZEF)
Genscherallee 3 ǀ 53113 Bonn ǀ Germany
E-Mail: presse.zef@uni-bonn.de
Phone: +49-(0)228 - 73 18 46

ACKNOWLEDGEMENTS

This study has been prepared by the Center for Develop-    Henry Kankwamba and Dr Maksud Bekchanov from ZEF
ment Research (ZEF) of the University of Bonn, in co-      and Jose Rosero, Carlo Cafeiro and Anne Kepple from
operation with the Food and Agriculture Organization of    FAO. Chapter 2 and Chapter 3.2 is based on Part 1 of The
the United Nations (FAO). It was funded by the German      State of Food Security and Nutrition in the World (FAO,
Federal Ministry for Economic Cooperation and Develop-     IFAD, UNICEF, WFP & WHO, 2020).
ment (BMZ).
                                                           The authors gratefully acknowledge Dr Heike Baumüller
Under the overall guidance of Professor Joachim von        and Dr Nicolas Gerber for their inputs and guidance, Ana-
Braun, the Director of Center for Development Research     stasiia Gordienko, Ergi Take and Madina Japakhova for
(ZEF) and Dr Maximo Torero Cullen, the Chief Economist     their technical support and assistance, and Dr Katharina
at FAO, the overall coordination and direction of prepa-   Friederike Gallant for her careful review of the report.
ring this report was carried out by Dr Bezawit Beyene      The authors are also grateful to Dr Joe Hill for the proof
Chichaibelu (from ZEF) and Dr Jose Rosero (Director of     reading and editing of the report, and to Katharina Zinn
Statistics of FAO). Contributing authors are Dr Bezawit    for the layout design of the report.
Beyene Chichaibelu, Dr Lukas Kornher, Dr Zaneta Kubik,
TABLE OF CONTENTS
Abbreviations iii
Executive Summary v
1 Introduction 1
2 Food Security And Nutrition Around The World In 2020 3
2.1 Progress Towards Global Hunger Reduction Targets 3
2.2 Beyond Hunger: Progress Towards Access to Nutritious and Sufficient Food for All 7
2.3 Progress Towards Global Nutrition Targets 8
2.4 Towards an Integrated Understanding of Food Security and Nutrition for Health and Well-being 11
3 Review of Outlooks Towards 2030 and Implications of COVID-19 12
3.1 Review of Foresight Methods and Exercises to Achieving SDG 2 by 2030 12
3.1.1 The Future of Food and Agriculture – Alternative Pathways to 2050, by FAO 12
3.1.2 Agricultural Investments and Hunger in Africa Modeling Potential Contributions
to SDG2 – Zero Hunger, by IFPRI 13
3.1.3 Alternative Futures for Global Food and Agriculture, by OECD 13
3.1.4 An Outlook on Hunger: A Scenario Analysis on the Drivers of Hunger Through 2030, by IARAN 16
3.2 How the COVID-19 Pandemic May Affect Hunger and Malnutrition in the World 16
3.2.1 Potential Impact of the COVID-19 Pandemic on Hunger 16
3.2.2 Potential Impact of the COVID-19 Pandemic on Malnutrition 18
4 The Changing Financial Commitments of G7 Countries to Food and Nutrition Security and Rural
Development 20
4.1 Global Flow of Development Assistance and the Contribution of G7 Countries 20
4.2 Allocation of ODA to Food Security, Nutrition and Rural Development by G7 Countries 20
4.3 G7 Commitments and Actions 22
4.4 The Relevance of ODA for Reducing Hunger and Malnutrition 23
4.5 Testing the Association Between ODA and Food and Nutrition Security 24
5 Progress in Hunger Reduction: Analysis of Best Performing Countries 28
5.1 Introduction 28
5.2 Data and Method 28
5.3 Best Performers 30
5.4 Economic Structure and Performance 33
5.5 Demographic Structure and Human Development 33
5.6 Public Interventions 33
5.7 Capital Investment 36
5.8 Governance 38
5.9 Discussion and Conclusion 396 Investment Needs to End Hunger and the G7 Commitments 40
6.1 Review of Selected Existing Cost-Estimation Models 40
6.2 A Food Systems Approach to Reducing Hunger and Child Malnutrition 44
6.3 Marginal Abatement Cost Curve Approach and Investment Scenario Assumptions 46
6.3.1 The Marginal Cost Curve and Key Steps of the Process 46
6.3.2 Reference Scenario 46
6.3.3 Opportunities of Investments in Policies and Programs for Hunger and Malnutrition Reduction 48
6.3.4 Investments to Reduce Hunger and Malnutrition: Marginal Cost Curve Results 50
6.3.5 Strength and Limitations of the Marginal Cost Curve Approach 51
6.3.6 Future Research Needs 52
6.4 Policy Implications of MaCC Analyses 53
References 54
Annexes 60
Annex 1: Boxes to Chapter 1 60
Annex 2: Instrumental Variable Approach Employed in Chapter 4.5 61
Annex 3: Statistical Tables to Chapter 5 64
Annex 4: Investments Scenario Assumptions and Hunger Reduction Potential of Investments
Considered in the Marginal Cost Curve 65TABLES AND FIGURES
Tables
Table 1: Prevalence of undernourishment (%) in the Table 19: Child malnutrition reduction potential of
world, 2005-2019 5 interventions from 2020 to 2030 52
Table 2: Number of undernourished people (millions) Table A1: Zero-stage regression of bilateral aid flows
in the world, 2005-2019 6 between 2000-2017 62
Table 3: Prevalence of food insecurity at severe level Table A2: First-stage regression of agricultural ODA 63
only, and moderate or severe level, measured with the
Table A3: Instrumental variable regression and error
FIES, 2014-2019 8
correlation with potentially problematic predictor
Table 4: Prevalence of child stunting, child overweight, variables 63
low birthweight, exclusive breastfeeding (Figures
Figure 1: Prevalence and number of undernourished Figure 7: Progress in PoU and ODA
people in the world, 2005-2030 4 development since 2001 25
Figure 2: How the COVID-19 pandemic may affect Figure 8: Change in PoU over 2001-2018:
hunger in the world: three scenarios, 2010-2030 17 Best and worst performers 32
Figure 3: Net ODA and ODA as percent of GNI Figure 9: Change in PoU over 2001-2018:
of DAC countries, 2000-2019 (millions of US$) 21 High fliers and last mile 32
Figure 4: Sectoral allocation of total G7 ODA, 2018 Figure 10: Hunger levels expected under various
(millions of US$) 21 socio-economic and climate change scenarios 47
Figure 5: Trend of food security (FS) and rural Figure 11: Marginal cost curve of the suggested
development (RD) ODA by G7 countries, interventions to eradicate hunger and malnutrition 52
2000-2018 (millions of US$) 22
Figure 6: Sub-sectoral allocation of G7 food security
and rural development ODA, 2018 (millions of US$) 23
ii1 ABBREVIATIONS
AARR Average Annual Rate of Reduction GDP Gross Domestic Product
AfCFTA African Continental Free Trade Area GFCF Gross Fixed Capital Formation
AFSI L’Aquila Food Security Initiative GFS Government Finance Statistics, IMF
AIM/GCE Asia-Pacific Integrated Model/ GHG Greenhouse Gas
Computable General Equilibrium GLOBIOM Global Biosphere Management Model
BAU Business As Usual (scenario) GNI Gross National Income
BMZ Federal Ministry for Economic GTAP Global Trade Analysis Project
Cooperation and Development HDI Human Development Index
(Bundesministerium für wirtschaftliche IARAN Inter-Agency Regional Analysts Network
Zusammenarbeit und Entwicklung) ICTs Information and Communication
CAADP Comprehensive Africa Agriculture Technologies
Development Programme IFAD International Fund for Agricultural
CC Climate Change (scenario) Development
CGE Computable General-Equilibrium IFPRI International Food Policy Research
(model) Institute
CGIAR Consultative Group for International IISD International Institute for Sustainable
Agricultural Research Development
COMP Comprehensive Investment IMF International Monetary Fund
in Agriculture Scenario IMPACT International Model for Policy Analysis
COVID-19 Coronavirus Disease 2019 of Agricultural Commodities and Trade
CRS Creditor Reporting System JME Joint Malnutrition Estimates
CV Coefficient of Variation of food kcal Kilocalorie
consumption LAC Latin America and the Caribbean
CV|r Coefficient of Variation of food LDCs Least Developed Countries
consumption linked to differences in LIFDCs Low-Income Food-Deficit Countries
energy requirements LiST Lives Saved Tool
DAC Development Assistance Committee, LMICs Lower- and Middle-Income Countries
of the OECD MaCC Marginal Cost Curve
DDA Doha Development Agenda MACC Marginal Abatement Cost Curve
DES Dietary Energy Supply MAFAP Monitoring and Analysing Food
DHS Demographic and Health Surveys and Agricultural Policies, FAO
DRC Democratic Republic of the Congo MAGNET Modular Applied GeNeral Equilibrium
ENVISAGE Environmental Impact and Sustainability Tool
Applied General Equilibrium (model) MDCs More Developed Countries
EU European Union MDER Minimum Dietary Energy Requirement
FAO Food and Agriculture Organization of the Mha Million Hectares
United Nations MICMAC Impact Matrix Cross-Reference
FAOSTAT Food and Agriculture Organization Cor- Multiplication Applied to a Classification
porate Statistical Database MIRAGRODEP Modelling International Relationships
FDI Foreign Direct Investment under Applied General Equilibrium for
FIES Food Insecurity Experience Scale agRODEP
FSWG Food Security Working Group, of the G7 NARS National Agricultural Research Systems
G7 The Group of Seven, an intergovernmen- NCDs Non-Communicable Diseases
tal economic organization NoCC No Climate Change Scenario
GAPS Global Agriculture Perspectives System ODA Official Development Assistance
iiiOECD Organization for Economic Co-operation UNICEF United Nations International Children’s
and Development Emergency Fund
pc per capita UNSCN United Nations System Standing
PE Partial-Equilibrium Committee on Nutrition
PoU Prevalence of Undernourishment VA Value Added
p.p. Percentage Points WDI World Development Indicators,
PPP Purchasing Power Parity of the WB
R&D Research and Development WEO World Economic Outlook, of the IMF
SDGs Sustainable Development Goals WFP World Food Programme
SOC Soil Organic Carbon WGI Worldwide Governance Indicators, of
SPEED Statistics on Public Expenditures for the WB
Economic Development WHA World Health Assembly, the decision-
SSP Shared Socioeconomic Pathways making body of the WHO
SSS Stratified Societies Scenario WHO World Health Organization
TSS Towards Sustainability Scenario WTO World Trade Organization
UNCTAD United Nations Conference on Trade and ZEF Center for Development Research
Development (Zentrum für Entwicklungsforschung)
UNESCO United Nations Educational, Scientific
and Cultural Organization
iv2 EXECUTIVE SUMMARY
Objectives of the study Recent and anticipated progress towards eradi-
cating hunger and malnutrition
At the heart of the 2030 Agenda was a promise to priori-
tize two objectives: to eradicate poverty and end hunger The study focuses on SDG 2 indicators – the prevalence
and malnutrition in all their forms. While global hunger, of undernourishment (PoU), the prevalence of moderate
measured by the prevalence of undernourishment, had or severe food insecurity based on the food insecurity
been on the decline, the absolute number of hungry peo- experience scale (FIES), and indicators of malnutrition –
ple remained very high. In response, heads of states at to assess the progress made to date in achieving the goal
the G7 Summit in Elmau in 2015 committed to lift 500 of ending hunger and malnutrition by 2030. The majority
million people out of hunger and malnutrition by 2030 as of the world’s undernourished – 381 million – are found
part of a broader effort undertaken with partner count- in Asia while the fastest growth in the number of under-
ries to support the 2030 Agenda for Sustainable Develop- nourished people is in Africa where more than 250 mil-
ment, i.e. Sustainable Development Goal (SDG 2) to end lion of the world’s undernourished live. Considering the
hunger and malnutrition by 2030. Nevertheless, the total number of people affected by moderate or severe
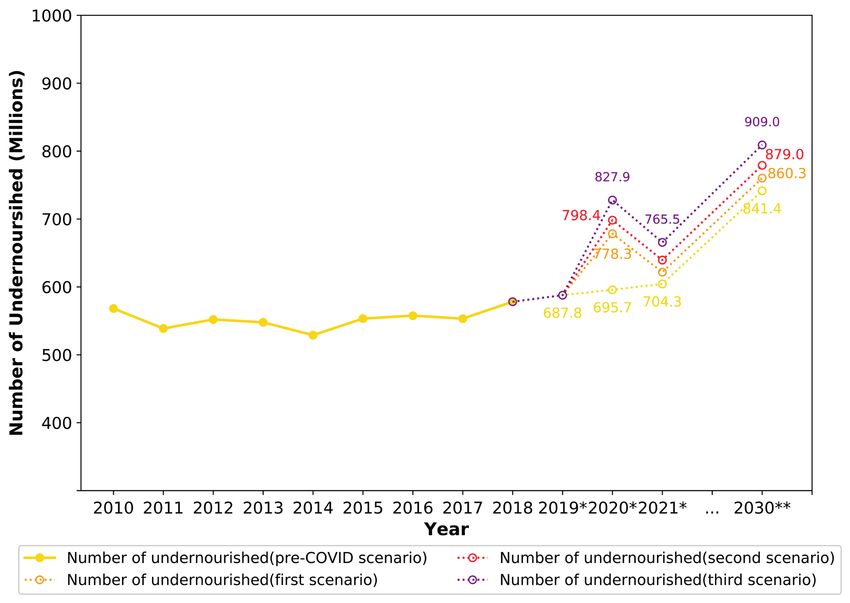
number of undernourished people in the world kept ri- levels of food insecurity, an estimated 2 billion people in
sing, from 653 million people in 2015 to 690 million peo- the world did not have regular access to safe, nutritious
ple in 2019, highlighting the challenge of achieving the and sufficient food in 2019, and 3 billion people could not
goal of Zero Hunger and malnutrition by 2030. afford healthy diets. A recent global projection of hun-
ger shows that the world is not on track to achieve Zero
This study reviews the food security situation and change Hunger by 2030. If recent trends continue, the number
therein in light of recent developments, including CO- of people affected by hunger will surpass 840 million by
VID-19. It also analyses to which extent G7 countries 2030, or 10 percent of the global population. The world
responded to the challenge and their commitment in is also not on track to achieve the 2025 and 2030 targets
terms of development assistance and outlines promising for child stunting and low birthweight, and for exclusive
investment opportunities to meet the 2030 targets. breastfeeding.
Obviously, more and different investments and policy ac- A review of foresight exercises provide alternative sce-
tions are needed to reach the goal of a world without narios in which challenges are addressed to varying
hunger. This study is about what needs to be done to re- degrees, building on historical trends of factors that
duce hunger by development partners, by countries that determine the performance of socio-economic and envi-
have large population shares of undernourished people, ronmental systems. Foresight studies agree that without
and by other stakeholders. The study conceptualizes en- a determined effort to fight climate change and mitigate
ding hunger from different perspectives: as an important its negative consequences, the adverse effects as well as
and feasible investment opportunity from human rights widening gaps of inequality will make it very difficult to
perspective, as a humanitarian obligation, and for econo- achieve the goal of ending hunger and malnutrition by
mic development. The incremental investment costs of 2030. COVID-19 is expected to worsen the overall pro-
ending hunger and malnutrition are identified. spects for food security and nutrition. Food insecuri-
ty may appear in countries and population groups that
were not previously affected. A preliminary assessment
suggests the pandemic may add up to 132 million people
to the total number of undernourished in the world in
2020, potentially increasing the number of undernouris-
hed to 909 million by 2030.
vTrends in G7 development assistance for food Targeting investment costs to meet the G7 El-
and nutrition security mau commitments and SDG to end hunger
To achieve the SDG 2 targets by 2030, concerted efforts While investments needed to end hunger and all forms
are needed to increase financial investments and aid of malnutrition are likely to be extensive, costly and dif-
contribution to food and agriculture to foster food and ficult to implement, it is a fair question to ask “costly re-
nutrition security. We evaluate the patterns and progress lative to what alternatives?”, or in economic terms, “are
of these efforts. Using official development assistance they costly relative to the benefits of a world without
(ODA) data from the Organization for Economic Co-ope- hunger?” As policymakers still need to prioritize the all-
ration and Development (OECD), this study assesses the ocation of resources, identifying optimal and least-cost
follow up to the G7 commitments expressed by heads of investment options is important for practical policy. In
states at Elmau in 2015 to increase bilateral and multi- this regard, the findings of various model- and cost-be-
lateral assistance to achieve SDG 2. Analyses of the ODA nefit and impact studies on hunger reduction measures
data concerning the goal of ending hunger and malnu- are systematically used in this study to identify the cost-
trition shows that in 2018, the total ODA from G7 coun- effectiveness of interventions.
tries specifically allocated to food security and rural de-
velopment was US$ 17 billion, a 109 percent increase As an original contribution, this study provides a margin-
compared to the value in 2000. By and large these ODA al cost curve (MaCC) to identify a mix of least-cost invest-
allocations are targeted at countries with a relatively hig- ment options with the highest potential for reduction in
her prevalence of undernourishment, mostly in Sub-Sa- hunger and malnutrition. Twenty-four different interven-
haran Africa. A further breakdown of these ODA flows tions are considered for reducing PoU and malnutrition.
shows that in 2018, a significant portion of G7 member The information about the interventions are drawn from
countries’ ODA were allocated to agricultural develop- best available evidence-based literature, including mo-
ment, with water and sanitation, food aid and environ- delling studies and impact assessments. Some of them
mental protection also receiving substantial investments. are more short-term interventions (such as social protec-
The data show that Germany added the most and Japan tion), and some are more long-term (such as agricultu-
and France also significantly increased ODA allocated to ral R&D, or soil fertility management). This MaCC can be
these sectors in recent years. considered when asking “what are the costs of ending
hunger?”, depending on the number of people who are
to be brought out of risk of hunger by 2030. The assess-
Lessons from successful countries ment can broadly guide global and country efforts to
achieve the SDG2 targets by 2030. The results from the
An in-depth evaluation of 19 countries that achieved MaCC indicate that:
substantial progress in reducing hunger over the period
2000-2017 points at opportunities. These best perform- 1. Achieving SDG2 would not be prohibitively expensi-
ing countries achieved on average more than 50 percent ve, provided that a mix of least-cost measures with
reduction in hunger (PoU). While the role of agriculture, large hunger reduction potential are prioritized. To
both in terms of value added and employment is still very achieve the 2030 goal of ending hunger, not only is
important in those countries, manufacturing is gaining it urgent to act now and not to lose any more time,
importance and labour is gradually moving out of agri- but also to optimally phase investments. Invest-
culture, and also out of rural areas. The countries spend ments that have more long-term impacts should be
a lot more on agriculture, had relatively high growth in frontloaded in the decade in order to reap their large
agricultural value added as well as higher capital for- benefits soon before 2030. A balanced approach is
mation and GDP growth. These findings emphasize that needed to reach the hungry poor soon – including
hunger reduction goes hand in hand with improvements those adversely affected by COVID-19 with job losses
in various human and macro-economic development and other socio-economic consequences - with soci-
outcomes, such as poverty reduction and fiscal attention al protection and nutrition programs.
to agriculture – which is particularly important from the 2. A bundle of promising investments that deliver
perspective of achieving the SDG 2. long-term and short-term impacts would meet the
G7 commitment of lifting 500 million people out
of hunger by 2030. An incremental average annual
investment ranging between about US$ 11 and 14
billion would be required for this mix of least-cost
intervention options. They include agricultural R&D,
viagricultural extension services, ICT - agricultural in- It is important to note that the marginal cost curve ele-
formation systems, small-scale irrigation expansion ments include many investments that contribute to long
in Africa, female literacy improvement, scaling up term development and sustainability, beyond 2030 and
existing social protection programs. Development not restricted to hunger reduction. The composition of
partners and national investors should not just tar- the investments facilitates an increase in resilience for
get their investments at least-cost short-term inter- populations affected by hunger today or at risk of hun-
ventions but consider a portfolio of short- and long- ger in this decade. As each intervention measure in the
term interventions. In view of the above mentioned MaCC is considered independently with its marginal
additional US$ 11 to 14 billion needed, a doubling costs and hunger reduction effects, beneficial synergies
of the G7’s ODA for agriculture, food and rural de- among interventions are not captured. This implies that
velopment (from the US$ 17 billion in 2018) could go costs are probably overestimated, and hunger reduction
a long way toward achieving the Elmau 500 million impacts underestimated, i.e. the MaCC indicates conser-
commitment. vative estimates of mixes of interventions. These MaCC-
3. To create a world without hunger by 2030 actually estimates should be combined with and compared with
means preventing a trend that otherwise - as men- comprehensive modelling that may capture synergies
tioned above - would lead to about 909 million hung- and tradeoffs. Moreover, the MaCC reflects interventions
ry people by 2030, including incremental hunger due at a global scale, therefore, the appropriate bundle of in-
to COVID-19. Preventing this level of hunger would terventions need to be established for individual count-
require total annual investments in a range of ab- ries. The above mentioned insights from best performing
out US$ 39 to 50 billion (which includes the above- countries provide some guidance in that respect, but
mentioned investments of US$ 11 to 14 billion). The countries need to develop and implement their own stra-
types of these additional investments include esta- tegies and consider their specific contexts.
blishing new social protection programs including to
address COVID-19 related hunger, crop protection,
integrated soil fertility management, African conti-
nental Free Trade Agreement (AfCTA), fertilizer-use
efficiency, and child nutrition programs. It is no sur-
prise that the investment required to lift the first 500
million people out of hunger is lower than what is
required for the remaining 400 million people who
live in more protracted circumstances. Overcoming
hunger related to complex emergencies combined
with violent conflicts and wars is not include in these
calculations.
vii1 INTRODUCTION
In 2014, after decades of steady decline, world hunger the G7 have published an annual Financial Report on
as measured by the prevalence of undernourishment be- Food Security and Nutrition, which presents aggregated
gan to rise again. By 2019 the number of undernourished data for each G7 member state on bilateral and multi-
people in the world reached nearly 690 million. At the lateral financial commitments in sectors relevant to food
G7 Summit in Elmau, Germany in 2015, as a contribution and nutrition security. Numerous qualitative aspects of
to the 2030 Agenda for Sustainable Development, the the Broad Food Security and Nutrition Development Ap-
G7 member states announced that, “As part of a broad proach, as laid out at Elmau, are summarized in a score-
effort involving our partner countries, and international card which serves as a methodology for G7 accountabi-
actors, and as a significant contribution to the Post 2015 lity reports.
Development Agenda, we aim to lift 500 million people
in developing countries out of hunger and malnutrition Efforts to monitor progress of the G7’s Elmau commit-
by 2030” (Leadersʼ Declaration, 2015).1 This declaration, ment are important and useful. Yet five years on from
known as the Elmau 500 million commitment, was wide- Elmau and with ten years remaining to the SDG 2 goal of
ly applauded as it underlined the G7’s commitment to 2030, there is a felt need to complement the G7’s ongo-
reduce global hunger in spite of the Sustainable Develop- ing accountability work to contribute to the internatio-
ment Goals’ general approach of leaving implementation nal discussion on SDG 2, foster analysis and action, and
to sovereign nations (UN, 2012, p. 14). provide further impulse for achieving SDG 2. This study
takes a fresh look at SDG 2 implementation based on
Achieving targets 2.1 and 2.2 of Sustainable Development new data and analysis, thus deepening the monitoring of
Goal No. 2 (SDG 2),2 to end hunger and all forms of mal- the G7’s Elmau commitment of 2015 beyond what is pro-
nutrition by 2030, remains a challenge. With respect to duced through the G7 accountability process and FSWG
the Elmau commitment, the rise in global hunger raises financial reports. In light of increasing global hunger, this
questions about the prospects of the goal of lifting 500 study seeks to provide an impetus for further national
million people out of hunger and malnutrition by 2030: and international engagement with regard to SDG 2. The-
refore, the objectives of the study are to:
• How are G7 countries and their international part-
ners contributing to addressing global hunger and • Undertake an independent assessment of SDG 2
malnutrition? status (undernourishment, food insecurity and
• What needs to be done to counter the current ne- malnutrition), considering relevant SDG 2 indica-
gative trend and to end hunger and malnutrition tors in developing countries,
by 2030? • Take stock of G7 and national and international en-
• Which interlinkages (synergies and trade-offs) gagement towards achieving SDG 2 in developing
should be considered when addressing the issue countries and assess G7 engagement,
of global hunger? • Analyse and identify further policy actions and in-
Through its accountability process, the G7 regularly vestments needed in order to achieve SDG 2,
monitors and reports progress on the Elmau 500 milli- • Compile a set of recommendations directed at
on commitment. The G7 Food Security Working Group all relevant stakeholders, for their consideration
(FSWG) has developed a financial resource tracking sys- regarding further engagement towards achieving
tem to add value to the monitoring efforts. Since 2017, SDG 2.
1 For the complete declaration on food security made by G7 heads
of states at the G7 Summit in Elmau in 2015, see Box 1 in Annex 1. Following this introduction, the report is structured into
2 For the complete text of the target of Sustainable Develop- five further chapters:
ment Goal No. 2 (SDG 2), see Box 2 in Annex 1. This report is mainly
concerned with the first two targets of SDG 2, namely ending hunger
and all forms of malnutrition. The term SDG 2 is therefore used
throughout much of the report to refer to targets 2.1 and 2.2 only.
1• Chapter two presents the trends in hunger, food and empirically tests the causal impact of ODA on
insecurity and various forms of malnutrition, bet- hunger reduction.
ween 2005 and 2030.3 • Chapter five examines the low- and lower-middle
• Chapter three reviews the state of current research income countries that achieved remarkable pro-
on outlooks towards meeting the SDG 2 goals by gress in hunger reduction over the period 2000–
2030, including the implications of the COVID-19 2017, to identify the factors that contributed to
pandemic. their success and highlight the strategies that
• Noting that development aid is only one part of should be prioritized by other countries in their
development cooperation, chapter four reports on fight against hunger.
the financial contributions (Official Development • Chapter six reviews recent estimates of the invest-
Assistance – ODA) of the G7 which relate to SDG 2, ments required to achieve the goals of SDG 2 and
ends by identifying the costs of reducing hunger
and malnutrition.
3 Data on PoU for the period 2005 to 2030 is used to present
trends in hunger; data on FIES is used for the period 2014 to 2019
for food insecurity; and indicators for the period 2012 onwards are
used for nutrition.
23
2 FOOD SECURITY AND NUTRITION AROUND
THE WORLD IN 2020
In 2015, the countries of the United Nations committed In extending the projections of the PoU to assess the
to the 2030 Agenda for Sustainable Development. This prospects for achieving the Zero Hunger target by 2030,
agenda recognized the importance of looking beyond an approach was followed based on projecting each of
hunger towards the goals of ensuring access to safe, nu- the three fundamental components of the PoU estima-
tritious and sufficient food for all people all year round, tes separately for each country. The PoU and number of
and eradicating all forms of malnutrition (SDG 2 Targets undernourished (NoU) values were then aggregated at
2.1 and 2.2). Five years into the 2030 Agenda, it is now the regional and global levels. First, projected population
time to assess progress and to question whether continu- size and composition (median variants), readily available
ing the efforts implemented thus far will allow countries from the World Population Prospects, were used. This
to reach these objectives. For this reason, this chapter allowed the projections of values of Minimum Dietary
presents an assessment of the state of food security and Energy Requirement (MDER) and coefficient of variation
nutrition in the world with projections of what the world of food consumption linked to differences in energy re-
may look like in 2030 if the trends of the last decade con- quirements (CV|r) up to 2030. Second, the current time
tinue. Importantly, as the COVID-19 pandemic continues series of total dietary energy supply (DES) from 2005 to
to evolve, this report attempts to foresee some of the 2017/2018 were forecast to 2030 using a simple ver-
impacts of this global pandemic on food security and sion of Exponential Smoothing, which treats weighted
nutrition. However, given that the devastation that CO- averages of past observations with the weights decay-
VID-19 will cause is still largely unknown, it is important ing exponentially as the observations get older. In other
to recognize that any assessment at this stage is subject words, the more recent the observation, the higher the
to a high degree of uncertainty and should be interpre- associated weight. The total DES was then divided by the
ted with caution. projected population numbers to provide an indication
of its evolution at per capita levels. Finally, trends in the
coefficient of variation of food consumption (CV) as es-
2.1 Progress Towards Global Hunger Reduction timated from 2015 or from the date of the last available
Targets survey were extended to 2030, following the same prin-
ciple that guided the update of the CV up to 2019.
The main indicator for monitoring progress on the eradi-
cation of hunger in the Sustainable Development Goals The three most recent editions of The State of Food Se-
global indicator framework is the prevalence of under- curity and Nutrition in the World offer evidence that the
nourishment (PoU).4 It is computed from aggregated decades-long decline in hunger/PoU across the world
country-level data on food available for human consump- has ended. Additional evidence available this year and
tion (compiled annually for most countries in the world several important data updates, including a revision of
in FAO’s Food Balance Sheets) and on less frequently ob- the entire PoU series for China back to 2000, show that
tained data on food consumption from surveys, available almost 690 million people in the world (8.9 percent of
for a growing (but still partial) number of countries. For the world population) are estimated to have been under-
each country, the distribution of average, daily dietary nourished in 2019 (Figure 1).5 The latest report’s revisions
energy consumption in the population is compared with confirm the conclusion of past editions that the number
the distribution of dietary energy needs (derived from of people affected by hunger across the world continues
the composition of the population by age, gender and
physical activity levels) to produce an estimate of the
5 All statistical series published in The State of Food Security and
proportion of the population that is chronically under- Nutrition in the World are carefully revised prior to the publication
nourished, i.e. lacking enough dietary energy for a healt- of each new edition to reflect all the new information the FAO re-
hy, active life. ceived since the release of the previous edition. The process implies
possible backward revisions of the entire series and readers are
warned against comparing values of the indicators across different
4 Throughout the report, hunger and PoU are used interchangea- editions of the report and encouraged to always refer to the series
bly. as presented in the most current report.
3to increase slowly. This trend started in 2014 and extends mated to exceed 840 million. These projections for 2030
to 2019. There are nearly 60 million more undernouris- indicate that Target 2.1 of the 2030 Agenda for Sustai-
hed people now than in 2014, when prevalence was 8.6 nable Development – “By 2030 end hunger and ensure
percent. Between 2018 and 2019 the number rose by 10 access by all people, in particular the poor and people
million people (FAO et al., 2020).6 in vulnerable situations including infants, to safe, nutriti-
ous and sufficient food all year round” – will not be met
Several reasons underlie the observed increase in hunger unless relevant stakeholders at all levels, from the sub-
over the past few years. Much of the recent increase in national all the way to the global level, undertake urgent
food insecurity can be attributed to a greater number of and consistent actions to reverse the current trends. The
conflicts, often exacerbated by climate-related shocks. projected situation in 2030 reflects the trends in recent
Even in some peaceful settings, food security has dete- years, without considering the impact of the COVID-19
riorated as a result of economic slowdowns threatening pandemic. The pandemic will most likely accelerate the
access to food for the poor. projected increase in the number of hungry people, at
least in the immediate future. This reinforces the need
Figure 1 also reveals that the world is not on track to achie- for urgent action to get back on track towards achieving
ve the SDG Target 2.1 of Zero Hunger by 2030. Combined the Zero Hunger goal.
projections of recent trends in the size and composition
of the population, in the total food availability, and in the The situation is most alarming in Africa, where it is esti-
degree of inequality in food access point to an increase mated that in 2019 more than 250 million people were
of the PoU by almost 1 percentage point. As a result, the undernourished, or 19.1 percent of the population, up
global number of undernourished people in 2030 is esti- from 17.6 percent in 2014. This prevalence is more than
twice the world average (8.9 percent) and is the highest
6 The analyses presented in this chapter use input data compiled among the world regions (Table 1).7 The majority of un-
up to March 2020, but with a reference period that ends in 2019.
Hence, the estimates should be understood to represent the food 7 The delineation of the world regions and sub-regions, as given in
security and nutrition situation before the outbreak of COVID-19. Tables 1-4, follows that used by the FAO et al. (2020).
Figure 1: Prevalence and number of undernourished people in the world, 2005-2030
Notes: Projected values in the figure are illustrated by dotted lines and empty circles. The shaded area represents projections for the longer period from 2019
to the 2030 target year. The entire series was carefully revised to reflect new information made available since the publication of the last edition of the report;
it replaces all series published previously.
Source: FAO et al. (2020).
4dernourished people in Africa are found in Sub-Saha- million people in 2019. Yet, the PoU in Asia as a whole
ran Africa, which shows an increase of about 32 million is 8.3 percent of the total population, below the world
undernourished people since 2015. Hunger has been average (8.9 percent), and less than half of that of Afri-
on the rise throughout Sub-Saharan Africa since 2014, ca (Tables 1 and 2). In addition, since 2005, the number
though the increase has been especially significant in of hungry people in Asia has reduced by more than 190
Eastern and Western Africa, as well as in Middle Africa million. This outcome reflects progress mostly in Eastern
where it affected 29.8 percent of the total population in Asia and Southern Asia.8 The situation in other sub-regi-
2019 (Table 1 and 2). The trends in Africa are driven by ons of Asia is stable since 2015, except for Western Asia,
a combination of factors, including economic slowdowns where it has been worsening primarily due to widespre-
and downturns, conflicts and extreme weather events ad protracted crises.9
that have affected a number of countries in Africa.
The projections for Asia in 2030 (Tables 1 and 2) show
In terms of outlook for 2030 (Table 1), Africa is signifi- that significant progress has been made in reducing un-
cantly off track to achieve the Zero Hunger target, even dernourishment in all sub-regions, with the exception
without considering the impact of COVID-19. If recent of Western Asia where undernourishment is increasing.
trends persist, its PoU will increase from 19.1 to 25.7 per-
cent. Undernourishment is expected to worsen, particu- 8 The two regions showing reductions in undernourishment
larly in Sub-Saharan Africa. By 2030, the projected rise – Eastern and Southern Asia – are dominated by the two largest
in the PoU would bring the number of hungry people in economies of the continent, China and India, where hunger has
reduced owing to long-term economic growth, reduced inequality,
Africa to almost 433 million, 412 million of whom would
and improved access to basic goods and services. In Southern Asia,
be in Sub-Saharan countries (Table 2). in countries like Nepal, Pakistan and Sri Lanka, significant progress
has also been made in reducing hunger in the past ten years, owing
Asia is home to more than half of the total number of largely to improved economic conditions.
9 Conflicts and instability are the primary drivers behind the rise
undernourished people in the world – an estimated 381 in hunger in Western Asia.
Table 1: Prevalence of undernourishment (%) in the world, 2005-2019
Prevalence of undernourishment (%)
2005 2010 2015 2016 2017 2018 2019* 2030**
WORLD 12.6 9.6 8.9 8.8 8.7 8.9 8.9 9.8
AFRICA 21 18.9 18.3 18.5 18.6 18.6 19.1 25.7
Northern Africa 9.8 8.8 6.2 6.3 6.6 6.3 6.5 7.4
Sub-Saharan Africa 23.9 21.3 21.2 21.4 21.4 21.4 22 29.4
Eastern Africa 32.2 28.9 26.9 27.1 26.8 26.7 27.2 33.6
Middle Africa 35.5 30.4 28.2 28.8 28.7 29 29.8 38
Southern Africa 4.9 5.4 7 8 7 7.9 8.4 14.6
Western Africa 13.8 12.1 14.3 14.2 14.6 14.3 15.2 23
ASIA 14.4 10.1 8.8 8.5 8.2 8.4 8.3 6.6
Central Asia 11 7.7 3 3 3 3 2.7 < 2.5
Eastern Asia 7.6 3.8 < 2.5 < 2.5 < 2.5 < 2.5 < 2.5 < 2.5
South-eastern Asia 17.3 11.7 10.5 10 9.8 9.8 9.8 8.7
Southern Asia 20.6 15.4 14.4 13.8 13.1 13.8 13.4 9.5
Western Asia 11.8 10.4 10.7 11.1 11.1 11.2 11.2 13.1
Western Asia and Northern Africa 10.9 9.7 8.6 8.9 9 8.9 9 10.4
LATIN AMERICA AND THE CARIBBEAN 8.7 6.7 6.2 6.7 6.8 7.3 7.4 9.5
Caribbean 21.3 17.5 17.3 17 16.6 17 16.6 14.4
Latin America 7.8 5.9 5.4 6 6.1 6.6 6.7 9.1
Central America 8.1 7.9 7.9 8.6 8.3 8.4 9.3 12.4
South America 7.6 5.1 4.4 4.9 5.2 5.8 5.6 7.7
OCEANIA 5.6 5.4 5.5 5.9 6 5.7 5.8 7
NORTHERN AMERICA AND EUROPE < 2.5 < 2.5 < 2.5 < 2.5 < 2.5 < 2.5 < 2.5 < 2.5
Notes: * Projected values. ** The projections up to 2030 do not reflect the potential impact of the COVID-19 pandemic. For the 2030 projections:
green = on track to achieve the 2030 target; yellow = some progress; red = no progress or worsening.
Source: FAO et al. (2020).
5Table 2: Number of undernourished people (millions) in the world, 2005-2019
Number of undernourished people (millions)
2005 2010 2015 2016 2017 2018 2019* 2030**
WORLD 825.6 668.2 653.3 657.6 653.2 678.1 687.8 841.4
AFRICA 192.6 196.1 216.9 224.9 231.7 236.8 250.3 433.2
Northern Africa 18.3 17.8 13.8 14.4 15.5 15 15.6 21.4
Sub-Saharan Africa 174.3 178.3 203 210.5 216.3 221.8 234.7 411.8
Eastern Africa 95 98.1 104.9 108.4 110.4 112.9 117.9 191.6
Middle Africa 39.7 40 43.5 45.8 47.2 49.1 51.9 90.5
Southern Africa 2.7 3.2 4.4 5.1 4.5 5.2 5.6 11
Western Africa 36.9 37 50.3 51.2 54.2 54.7 59.4 118.8
ASIA 574.7 423.8 388.8 381.7 369.7 385.3 381.1 329.2
Central Asia 6.5 4.8 2.1 2.1 2.2 2.1 2 n.r.
Eastern Asia 118.6 60.6 n.r. n.r. n.r. n.r. n.r. n.r.
South-eastern Asia 97.4 70.1 66.7 63.9 63.4 64.2 64.7 63
Southern Asia 328 264 263.1 256.2 245.7 261 257.3 203.6
Western Asia 24.3 24.2 27.6 29.2 29.5 30.4 30.8 42.1
Western Asia and Northern Africa 42.6 42 41.4 43.6 45 45.4 46.4 63.5
LATIN AMERICA AND THE CARIBBEAN 48.6 39.6 38.8 42.4 43.5 46.6 47.7 66.9
Caribbean 8.4 7.2 7.4 7.3 7.1 7.3 7.2 6.6
Latin America 40.1 32.4 31.4 35.1 36.3 39.3 40.5 60.3
Central America 11.8 12.4 13.4 14.7 14.4 14.7 16.6 24.5
South America 28.4 20 18 20.4 21.9 24.6 24 35.7
OCEANIA 1.9 2 2.2 2.4 2.4 2.4 2.4 3.4
NORTHERN AMERICA AND EUROPE n.r. n.r. n.r. n.r. n.r. n.r. n.r. n.r.
Notes: * Projected values. ** The projections up to 2030 do not reflect the potential impact of the COVID-19 pandemic. For the 2030 projections:
green = on track to achieve the 2030 target; yellow = some progress; red = no progress or worsening. n.r. = not reported, as the prevalence is
less than 2.5 percent. Regional totals may differ from the sum of regions, due to rounding.
Source: FAO et al. (2020).
Without considering the potential impact of the CO- The Latin America and Caribbean region is not on track to
VID-19 pandemic, Eastern and Central Asia are on track achieve the SDG Target 2.1 of Zero Hunger by 2030 (Ta-
to meet SDG Target 2.1 by 2030. Southern and South- bles 1 and 2). The region as a whole is projected to have
eastern Asia are making progress, but nevertheless are more than 19 million more hungry people in 2030 com-
not on track to achieve the target by 2030. The current pared to 2019, even without considering the likely impact
increasing trend in Western Asia is the opposite of what of the COVID-19 pandemic. A 3-percentage point increa-
is needed to achieve the target by 2030. se in the PoU is projected for Central America. In South
America, the PoU is projected to increase from 5.6 per-
In Latin America and the Caribbean (LAC), the PoU was cent in 2019 to 7.7 percent in 2030, a total of almost 36
7.4 percent in 2019, below the world prevalence of 8.9 million people. The Caribbean sub-region, while making
percent, which still translates into almost 48 million un- progress, is not on track to achieve the target by 2030.
dernourished people (Table 1 and 2). The region as a
whole has seen a rise in hunger in the past few years, In summary, despite having achieved the most progress
with the number of undernourished people increasing in reducing undernourishment, Asia as a whole is cur-
by 9 million between 2015 and 2019, but with important rently home to more than 55 percent of the undernou-
differences among the sub-regions. The Caribbean, the rished people in the world. Africa has the highest PoU
sub-region with the highest prevalence, showed some and (after Southern Asia) the second highest number of
moderate progress in the recent past, while in Central undernourished people, about 250 million, accounting
and South America the situation has worsened. Progress for 36.4 percent of the global total. A much smaller share
and setbacks in reducing hunger are a result of economic of the world’s undernourished people live in Latin Ame-
conditions, extreme climate events, political instability rica and the Caribbean (almost 7 percent). Even without
and conflicts. considering the effects of COVID-19, projected trends in
6undernourishment would change the geographic distri- exposed to severe levels of food insecurity in 2019, de-
bution of world hunger dramatically (Table 2, far right fined using the FIES global reference scale. This implies
column). While Asia would still be home to just over 329 reductions in the quantity of food consumed to the extent
million hungry people in 2030, its share of the world’s that they have possibly experienced hunger (Table 3).
hunger would shrink substantially (to 39 percent). Afri-
ca would overtake Asia to become the world region with Unsurprisingly, the prevalence of severe food insecurity
the highest number of undernourished people, over 433 in Africa (19.0 percent) is very close to the PoU in Africa
million people, accounting for 51.5 percent of the total. (19.1 percent, see Table 1), and is the highest among all
Comparing the sub-regions, Eastern Africa, predicted to world regions. In Asia as a whole, the prevalence of severe
have nearly 192 million hungry people in 2030, is forecast food insecurity is 9.2 percent (though in Southern Asia it is
to be second only to Southern Asia, predicted to have al- 17.8 percent). In Latin America and the Caribbean it is 9.6
most 204 million hungry in 2030. Central America, South percent. In all regions of the world except Northern Ame-
America and Western Asia are the three sub-regions out- rica and Europe (1.1 percent), the prevalence of severe
side of Africa which would host a much larger share of food insecurity has increased from 2014 to 2019 (Table 3).
people suffering from hunger in 2030 than today.
A broader look at the extent of hunger and food insecu-
Finally, the projections on undernourishment may be rity beyond severe levels reveals that an additional 16.2
substantially altered by differential impacts of the CO- percent of the world population, or 1.25 billion people,
VID-19 pandemic, which are still being assessed. The experienced food insecurity at moderate levels in 2019,
potential impact of the COVID-19 pandemic on under- meaning they did not have regular access to nutritious
nourishment is discussed in chapter 3. and sufficient food. The combination of moderate and
severe levels of food insecurity brings the estimated
prevalence of moderate or severe food insecurity (SDG
2.2 Beyond Hunger: Progress Towards Access to Indicator 2.1.2) to 25.9 percent of the world population
Nutritious and Sufficient Food for All in 2019, amounting to a total of about 2 billion people.
Food insecurity (moderate or severe) at the global level
Target 2.1 of Sustainable Development Goal 2 looks has increased each year since 2014, mostly because of
beyond hunger towards the goal of ensuring access to the increase in moderate food insecurity.
nutritious and sufficient food for all. The indicator to
monitor its progress, prevalence of moderate or seve- Prevalence of moderate or severe food insecurity is
re food insecurity, is assessed using the Food Insecurity much higher in Africa than in any other part of the world.
Experience Scale (FIES). Considering the universal scope It is estimated that about half of the population (51.6
of the 2030 Sustainable Development agenda, this indi- percent) of Africa experiences moderate or severe food
cator is relevant for all countries in the world – “deve- insecurity. Latin America and the Caribbean is next, with
loped” as well as “developing” countries. It refers not a prevalence of more than 30 percent, followed by Asia
only to severe conditions of food insecurity but also to at 22 percent. Northern America and Europe has an 8
situations at more moderate levels. People experiencing percent prevalence.
moderate food insecurity face uncertainties about their
ability to obtain food and have been forced to reduce, at The prevalence of food insecurity (moderate or severe) is
times during the year, the quality and/or quantity of food on an upward trend in Africa (Table 3). This is explained
they consume due to lack of money or other resources. by the increase in Sub-Saharan Africa. However, it is in
It thus refers to a lack of consistent access to food, which Latin America and the Caribbean where food insecurity
diminishes dietary quality, disrupts normal eating pat- is rising the fastest: from 22.9 percent in 2014 to 31.7
terns, and can have negative consequences for nutrition, percent in 2019, due to a sharp increase in South Ame-
health and well-being.10 rica (Table 3). In Asia, the percentage of people exposed
to moderate or severe food insecurity remained stable
According to the latest estimates, 9.7 percent of the world from 2014 to 2016, then started increasing from 2017
population (or slightly less than 750 million people) were onwards. The increase is concentrated in Southern Asia
where the total prevalence of food insecurity increased
10 The approach relies on data obtained by directly asking people, from 29.4 percent in 2017 to 36.1 percent in 2019. The
through an eight-question module inserted in surveys, about the global crisis induced by the COVID-19 pandemic will cer-
occurrence of conditions and behaviours that are known to reflect
constrained access to food. Based on their responses, the individuals tainly bring these figures to much higher levels, even in
surveyed are assigned a probability of being in one of three classes, regions of the world like Northern America and Europe
as defined by two globally set thresholds: food secure or marginally which have traditionally been more food secure.
insecure; moderately food insecure; and severely food insecure. See
FAO, 2016; Cafiero, Viviani & Nord, 2018.
7In terms of the distribution of food-insecure people in bly (WHA) in 2012 to be achieved by 2025, and extended
the world, from a total of 2 billion affected by modera- to 2030 to align with the 2030 SDG agenda (WHO, 2012;
te or severe food insecurity, 1.03 billion are in Asia, 675 WHO & UNICEF, 2017). The assessment examines pro-
million in Africa, 205 million in Latin America and the Ca- gress made since the baseline (2012) and projects tra-
ribbean, 88 million in Northern America and Europe and jectories towards the 2025 and 2030 targets, looking at
5.9 million in Oceania. It is also important to highlight the sub-regional, regional and global levels.11
differences across regions in the distribution of the popu-
lation by food-insecurity severity level. For example, in Globally, progress is being made towards the stunting
addition to being the region with the highest overall pre- and exclusive breastfeeding targets, but the pace must
valence of food insecurity, Africa is also the region where be increased to achieve them by 2025 and 2030. Cur-
severe levels represent the largest share of the total. In rently the prevalence of child wasting is above the 5 per-
Latin America, and even more so in Northern America cent target for 2025, putting the lives of tens of millions
and Europe, the proportion of food insecurity experien- of children at risk in the immediate term. Progress is
ced at severe levels is much smaller. being made in reducing low birthweight, but not enough
to achieve the target of a 30 percent reduction in low
birthweight by 2025 and 2030. The increasing trend in
2.3 Progress Towards Global Nutrition Targets childhood overweight is of great concern and must be
urgently addressed, as must the trend in adult obesity
This section presents the latest assessment of progress which continues to rise.
towards the global nutrition targets, which constitute
target 2.2 of the SDGs. These targets – to reduce child
stunting, childhood overweight, child wasting, low bir- 11 The assessment of progress on nutrition outcomes is based
thweight and adult obesity, and to increase exclusive bre- on data generated and made available prior to the outbreak of the
COVID-19 pandemic. The pandemic is likely to affect progress in the
astfeeding – were endorsed by the World Health Assem-
coming months and years.
Table 3: Prevalence of food insecurity at severe level only, and moderate or severe level, measured with the FIES, 2014-2019
Prevalence of severe food insecurity in the Prevalence of moderate or severe food inse-
total population (%) curity in the total population (%)
2014 2015 2016 2017 2018 2019 2014 2015 2016 2017 2018 2019
WORLD 8.3 7.9 8.1 8.6 9.4 9.7 22.4 22.4 23.2 24.8 25.8 25.9
AFRICA 16.7 16.8 18.2 18.5 18.3 19.0 46.3 46.5 49.4 51.4 50.6 51.6
Northern Africa 10.2 9.0 10.4 11.0 9.3 8.7 29.7 26.4 30.0 36.8 31.1 28.6
Sub-Saharan Africa 18.2 18.6 20.0 20.0 20.3 21.3 50.3 51.2 53.9 54.8 55.1 56.8
Eastern Africa 23.5 23.8 25.2 24.5 23.9 24.7 28.0 57.9 61.7 61.1 60.2 61.4
Middle Africa n.a n.a n.a n.a n.a n.a n.a n.a n.a n.a n.a n.a
Southern Africa 19.4 19.5 19.7 19.9 19.7 19.8 44.1 44.4 44.6 44.8 44.8 44.7
Western Africa 11.7 12.5 13.8 14.9 15.8 17.2 42.1 44.3 46.4 48.6 50.5 53.2
ASIA 8.0 7.5 7.1 7.6 9.1 9.2 19.4 18.9 18.9 20.6 22.6 22.3
Central Asia 1.6 1.4 2.0 2.8 2.2 2.3 8.5 9.1 10.0 13.9 13.6 13.2
Eastern Asia 0.8 0.8 1.5 1.7 1.9 1.3 6.0 5.9 6.3 10.0 9.6 7.4
South-eastern Asia 4.4 3.8 4.0 5.6 5.4 4.8 16.9 15.3 17.0 19.6 19.6 18.6
Southern Asia 15.9 14.8 13.1 13.3 16.9 17.8 31.6 30.8 30.1 29.4 34.6 36.1
Western Asia 8.3 8.7 8.8 9.8 9.4 9.0 28.0 28.0 26.9 28.9 28.1 28.5
Western Asia and Northern Africa 9.2 8.9 9.6 10.4 9.3 8.8 28.8 27.3 28.4 32.6 29.5 28.5
LATIN AMERICA AND THE CARIBBEAN 7.1 6.4 8.1 9.3 9.2 9.6 22.9 25.1 29.4 32.0 31.6 31.7
Caribbean n.a n.a n.a n.a n.a n.a n.a n.a n.a n.a n.a n.a
Latin America 6.9 6.2 7.9 9.2 9.1 9.5 22.6 24.9 29.4 32.0 31.6 31.7
Central America 10.4 10.2 10.0 11.8 13.6 14.1 31.8 32.0 31.4 34.7 38.3 39.3
South America 5.5 4.6 7.1 8.1 7.2 7.6 18.8 22.0 28.6 30.9 28.8 28.5
OCEANIA 2.5 2.6 3.3 4.1 3.7 4.2 11.1 9.5 11.5 14.2 12.9 13.9
NORTHERN AMERICA AND EUROPE 1.4 1.4 1.3 1.2 1.0 1.1 9.4 9.4 8.8 8.5 7.6 7.9
Notes: n.a. = not available, as data are available only for countries, representing less than 50 percent of the population in the region.
Source: FAO et al. (2020).
8Progress towards the nutrition targets at the global le- stem the rate of overweight for most of the sub-regions
vel is summarised in Table 4 (excluding child wasting). between 2012 and 2019 (Table 4). Africa as a whole has
Worldwide, 21.3 percent of children under 5 years of age halted the increase in childhood overweight so far, but
were stunted in 2019, or 144 million. Although there has increased efforts are needed to achieve the target of 3
been some progress globally, rates of stunting reduction percent by 2030. All regions require urgent action to end
are far below what is needed, at 2.3 percent per year in the rise in childhood overweight by 2025 and achieve the
recent years (defined as the period from 2008 to 2019). target of no more than 3 percent by 2030.
A rate of 3.9 percent per year is required to reach the tar-
gets of 40 percent reduction for 2025 and 50 percent re- Globally, 6.9 percent of children under 5 years (a total
duction for 2030, starting from the baseline year (2012) of 47 million) were affected by wasting in 2019 – signi-
(UNICEF, WHO & World Bank, 2020). If recent trends ficantly above both the 2025 target (5 percent) and the
continue, these targets will only be achieved in 2035 and 2030 target (3 percent) (UNICEF, WHO & World Bank,
2043, respectively. 2020). The prevalence of wasting in Africa is 6.4 percent,
with only the Southern Africa sub-region having a preva-
The prevalence of stunting is unequally distributed across lence below 5 percent. Oceania excluding Australia and
the world, and even within regions and sub-regions, with New Zealand has the highest prevalence of wasting of
contrasting severity levels. More than nine out of ten all regions (9.5 percent), followed by Asia (9.1 percent).
stunted children lived in Africa or Asia in 2019, making Southern Asia, which is home to more than half of the
up 40 percent and 54 percent of all stunted children in world’s wasted children under 5 years of age, is the only
the world, respectively. Most regions have made some sub-region having a high prevalence of 14.3 percent (25
progress to reduce stunting between 2012 and 2019 but million) in 2019. By contrast, Latin America and the Ca-
not at the rate needed to achieve the 2025 and 2030 tar- ribbean is the only region with a prevalence of wasting
gets. The prevalence of stunting in Sub-Saharan Africa is (1.3 percent) already below the 2025 and 2030 targets.12
decreasing, but only at half the rate needed, and is still
very high (31.1 percent in 2019). Moreover, Sub-Saharan Worldwide, 14.6 percent of infants were born with low
Africa has actually seen an increase in the number of birthweight (less than 2,500 g) in 2015 (UNICEF & WHO,
stunted children from 51.2 million in 2012 to 52.4 million 2019). The Average Annual Rate of Reduction (AARR)
in 2019. Central Asia, Eastern Asia and the Caribbean are for this indicator of 1 percent per year shows that some
on track to achieve the 2025 and 2030 targets (Table 4). progress has been made in recent years, but not enough
If current progress continues, Asia and Latin America and to achieve the target of a 30 percent reduction in low
the Caribbean will be very close to achieving the targets birthweight by 2025 (the 2030 target is the same). If
for 2025 and 2030 (missing them by only one year), while progress continues at the current rate, the target will be
Africa will need to triple its progress rate if population achieved only in 2046. The estimates also indicate that
growth continues to increase as projected. none of the regions are on track to achieve the target
of 30 percent relative reduction in the proportion of ba-
The global prevalence of overweight among children un- bies born with low birthweight, even by 2030. Notably,
der 5 years of age has not improved, increasing slightly Southern Asia had the highest prevalence estimate (26.4
from 5.3 percent in 2012 to 5.6 percent, a total of 38.3 percent in 2015). Rates of reduction for this indicator are
million children, in 2019 (UNICEF, WHO & World Bank, very low for all sub-regions, with a maximum AARR of
2020). Of the 38.3 million children who were overweight 1.2 percent per year in Southern Asia. Moreover, recent
in 2019, 24 percent lived in Africa and 45 percent in Asia, trends indicate no reduction in South America, Eastern
despite these being the regions with the lowest preva- Asia and Northern America (i.e. the US), and a slight in-
lence of children who are overweight (4.7 percent in Af- crease in Australia and New Zealand (Table 4).
rica and 4.8 percent in Asia). Australia and New Zealand
has a very high prevalence rate (20.7 percent), Southern As of 2019, it was estimated that globally, 44 percent of
Africa (12.7 percent) and Northern Africa (11.3 per- infants aged less than six months were exclusively bre-
cent) have prevalence rates considered high (de Onis astfed (UNICEF, 2020a). The world is currently on track
et al., 2019), followed closely by Oceania (9.4 percent), to achieve the 2025 target of at least 50 percent for this
Northern America (i.e. the US) (8.9 percent) and Western
Asia (8.4 percent). Australia and New Zealand has expe- 12 Wasting is an acute condition that can change frequently and
rienced the largest increase in childhood overweight, as rapidly over the course of a calendar year. This makes it difficult to
has Oceania (excluding Australia and New Zealand); both generate reliable trends over time with the input data available.
As such, only the most recent global and regional estimates are re-
require concerted efforts to reverse their rapidly rising
ported. The assessment of child wasting is made based on the latest
upward trends. There has been little or no progress to estimates (2019) through a straight comparison to the target levels
of 5 percent and 3 percent for 2025 and 2030, respectively.
9You can also read