What will last? The long-term implications of COVID-19 - December 2020 - Credit Suisse
←
→
Page content transcription
If your browser does not render page correctly, please read the page content below

December 2020

Research
Institute
What will last?
The long-term implications of COVID-19

Thought leadership from Credit Suisse and the world’s foremost experts

Editorial

Crises often have a transformative effect. While         vulnerability of cities – all of these developments
some developments turn out to be temporary,              were already under way prior to the outbreak of
others prevail long after a crisis is over. As we        the virus. The pandemic only acted as a catalyst.
take stock of the COVID-19 pandemic, the
Credit Suisse Research Institute brought together        The speed at which these trends are now pro-
academic, business and political leaders at its Fall     gressing is challenging modern society to keep
2020 Conference to reflect upon the long-lasting         pace. Legislation is lagging behind in several
consequences.                                            areas from data protection to labor laws, and
                                                         governments, just like companies, have to
The rapid spread of COVID-19 in early 2020               strengthen their resilience by adopting more
caught most of the world by surprise and turned          sustainable economic paradigms.
the global economy upside down. The pandemic
made us aware that contagious diseases can               Acting now with a view to the world after
still threaten society as a whole and that such          COVID-19 can help minimize the likelihood of
outbreaks are in fact by-products of human prog-         another pandemic-driven global crisis. It can also
ress. Throughout history, however, health crises         be an opportunity to address issues that have
have also helped to drive scientific and social          undermined growth and prosperity in the last few
innovation, shaping the paths of future economic         decades.
development. We believe that the current health
crisis will be no exception in this regard.              We hope that our findings will prove valuable and
                                                         I wish you a most insightful read.
Yet, rather than radically changing the world as
we know it, COVID-19 has accelerated existing
trends. The digitalization of everyday life, the trend   Urs Rohner
toward more flexible work arrangements, the              Chairman of the Board of Directors
deceleration of globalization, the weakening of          Credit Suisse Group AG
multilateralism, the expansion of the state or the

2
02    Editorial

04    Ten trends to watch

05    Introduction: What history tells us

08    1. On balance, a deflationary shock

15     2. Reshaping international relations?

20     3. States pushing the limits

30     4. Less global, more resilient
41     Interview: Assessing the impact on
       the logistics sector

44     5. A new era of surveillance?

51     6. Flexibility at work

59     7. Disruption in education

63     8. The great divide

72     9. Urban life at a crossroads?

78     References

83     General disclaimer / important information

Authors
Sara Carnazzi Weber
Pascal Zumbühl
Jan Schüpbach
Emilie Gachet
Oliver Adler
Manuel Rybach
Nannette Hechler-Fayd'herbe

Contributors
Ross Hewitt
Christa Jenni
Reto Hess
Claude Maurer
Franziska Fischer
Maxime Botteron
Tiziana Hunziker

Cover photo: Paris, France; GettyImages,
Bellurget Jean Louis
Photo left: GettyImages, ArtistGNDphotography

For more information, contact:
Nannette Hechler-Fayd’herbe
CIO International Wealth Management and
Global Head of Economics & Research, Credit Suisse
nannette.hechler-fayd’herbe@credit-suisse.com

Credit Suisse Research Institute
research.institute@credit-suisse.com
credit-suisse.com/researchinstitute

          What will last? The long-term implications of COVID-19   3
Ten trends to watch

1. Inflation tail risks                                6. Surveillance
The benign inflation regime of past decades will       Surveillance and personal data collection
persist in the medium term, but deflation and          now enable states and companies to become
inflation tail risks have grown.                       information empires. Comprehensive privacy
                                                       protection is crucial.
2. Multilateralism 2.0
Multilateralism is either reset and reformed or will   7. Work
cede to multipolarism as a result of US-China          Remote work is here to stay, fostering an even
interactions.                                          broader flexibilization and new standards in the
                                                       working world.
3. Democracy/autocracy
Both can fail or thrive in a pandemic as crisis        8. Education
management, state capacity and citizens’ trust         Lifelong learning will become a key part of
matter more than political systems. Both will          everyone’s life to create an adaptable work force
continue to co-exist.                                  and develop skills that stress human advantage
                                                       over machines.
4. Big state
State power extensions will outlast the crisis,        9. Inequality
initiating desirable changes, but at the same          Inequality will remain a core focus and possibly
time increasing the risk of undermining market         initiate more redistributive taxes, triggering labor
dynamics and individual responsibility.                and capital flows in response.

5. Nearshoring                                         10. Decentralization
Globalization will not reverse, but slow further,      Cities will survive, but adapt, leaving room for
with more emphasis on regional diversification,        more regional decentralization and a renaissance
nearshoring of production and resilience rather        of small towns in the developed world.
than cost efficiency.

4
Introduction:
What history tells us

For centuries, people have suffered outbreaks of infectious diseases.
The Black Death and the Spanish Flu, for instance, not only claimed
millions of lives, but had far-reaching consequences for those who
survived. Despite the tragic effects, pandemics have also helped drive
scientific and social progress, shaping the path of economic development.
Indeed, past pandemics offer important insights about how to deal
with crises.

            Pandemics and human progress                          to inventions along the way such as trains, ships
            are intertwined                                       and automobiles, the world became increasingly
                                                                  interconnected. By facilitating the movement of
            For much of history, humans lived in hunter-          people and goods between once-isolated com-
            gatherer societies, with mobility as a survival       munities, these inventions made it easier for
            strategy. Yet when they began to settle, popula-      infectious diseases to spread. In other words,
            tions began to grow in size and villages were es-     the pursuit of economic progress has regularly
            tablished. Increasingly, crowded neighborhoods        brought more opportunities for humans, but also
            and unsanitary living conditions became a reality     enabled diseases to develop and spread.
            for these sedentary societies. Animals were no
            longer hunted, but bred and thus kept close to
            humans. By altering ecosystems and blurring
            natural frontiers, humans became increasingly
            exposed to viruses and bacteria. COVID-19,
            assumed to have originated in Wuhan’s wet             History is another way of thinking
            markets, is the latest example of how close           about the present and helps
            interaction of animals and humans can still lead      identify what is truly new and
            to pandemics.
                                                                  what not – Dr. Margaret McMillan,
            The ability of sedentary societies to store food      Professor of History, University of
            made it possible to feed the non-food-producing       Toronto
            population, leaving these people to focus on other
            tasks. This division of labor eventually led to new
            inventions such as the plough or the knife, which
            made food-producing individuals more productive.      The Black Death, the deadliest pandemic in
            Over time, a diminishing share of society had to      history with an estimated death toll of 75–200
            produce food for the whole community, allow-          million people, was caused by the bacterium
            ing even more non-food-producing people to            Yersinia pestis, which passed from rats to
            specialize in other fields. This reinforcing cycle    humans via infected fleas. Historians believe
            made societies wealthier and cities bigger. Thanks    that the plague originated in Central Asia in the

                                                                     What will last? The long-term implications of COVID-19   5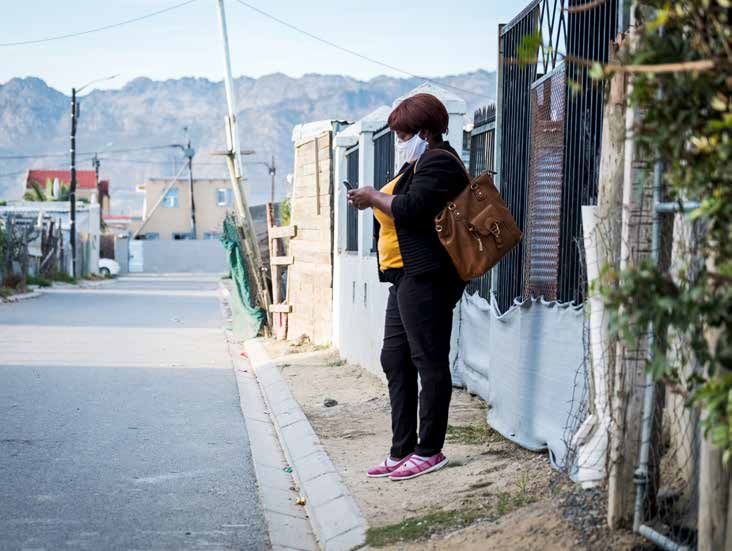
1330s and found its way to Messina, Sicily,          Shifts in power and fortunes
through galleys in 1347, and from there to
other parts of Europe. In an attempt to control      While disease outbreaks have preoccupied
the plague, Italian cities gave health authori-      communities for centuries, they have also
ties emergency powers and built barricades to        shaped the balance of power across the world.
limit the movement of people and goods. More-        For instance, historians argue that diseases
over, cities established a 40-day confinement        endemic to Europe played a decisive role in
period. These containment measures effectively       the European conquests of the New World.
changed the role of the state for centuries to       In Europe, the Black Death and subsequent
come. The plague justified top-down measures         waves of the plague laid the foundation for
to mitigate the negative impact on the popula-       diverging developments across the continent.
tion and the economy through surveillance and        The outbreak of the plague in the 17th century,
the suspension of human liberties. COVID-19          for instance, affected some regions much more
has the potential to be a similar catalyst for new   than others. Italy was severely struck, while
relations between the state and individuals.         Northwestern Europe continued to develop,
                                                     shaping the subsequent path of economic
                                                     development. Similarly, the COVID-19 crisis
                                                     could redefine the geopolitical balance of
                                                     power, as countries that have handled the crisis
                                                     better gain an advantage over others.
We cannot rule out future
pandemic scenarios – Albert M.
Baehny, Chairman of the Board of                     The world after COVID-19
Directors, Lonza                                     Most pandemics underline the role that environ-
                                                     mental, social and cultural factors play in their
                                                     emergence and spread. As long as people do
                                                     not take into account the human factor and the
Affected societies felt overwhelmed by the sheer     circumstances that have led to new disease
ferocity of the Black Death, believing that the      outbreaks, human knowledge of pandemics is
plague was a punishment for human sins. Their        incomplete when it comes to preventing them.
powerlessness turned into anger aimed at the
population groups believed to have caused the
health crisis. It was only by 1894 – after the
Third Plague – that scientists discovered the
bacterium behind the outbreak. This discovery
triggered a series of developments in microbi-       COVID-19 can be seen as a
ology, medicine, urban planning and sanitation,      dress-rehearsal of some of
which led to treatments and the prevention of        the exacerbating stresses in
the plague. Today, thanks to strict public health
measures and modern antibiotics, the plague no
                                                     precariously poised unbalanced
longer affects great numbers of people and is        systems – Jeremy Lent, author of
much less deadly.                                    the “Patterning Instinct: A cultural
                                                     history of humanity’s search for
The most devastating disease outbreak in recent      meaning”
history was the Spanish Flu, a contagious
respiratory disease that claimed between 20 and
50 million lives in 1918 and 1919. To combat
it, governments closed places of entertainment,
schools and public transportation. Moreover,         History has shown that the human factor can also
masks were distributed and people were ordered       decrease the susceptibility to infectious diseases,
to stay at home. Although it was primarily World     with the current outbreak no exception. In their
War I that ended the first era of globalization in   efforts to limit the negative impact of COVID-19,
the industrialized world, historians argue that      governments are adopting more sustainable
the Spanish Flu may well have loosened the           economic paradigms such as strengthening public
increasing economic ties among nations. Similar      health systems and addressing the vulnerability
considerations have been made with regard to         of cities. Countries are thus starting to plan the
COVID-19 – even if it may not reverse globaliza-     world after COVID-19 in an effort to minimize
tion, it may come to be seen as having changed       the likelihood of another pandemic-driven global
the nature of globalization.                         catastrophe. Some experiences of the COVID-19
                                                     pandemic may well prevail long after the crisis.
                                                     This report discusses how the world might look
                                                     after COVID-19.

6
Berlin, Germany; GettyImages, Alvarez

                                        What will last? The long-term implications of COVID-19   7
1. On balance, a
deflationary shock

The short- to medium-term impact of COVID-19 on growth and
inflation has clearly been negative. Yet the longer-term impact may be
less negative than that of other major recessions. Despite significant
fiscal deficits, we think government debt should be sustainable as long
as deficits are gradually reined in. It seems premature to worry that the
low-inflation regime of past decades will end anytime soon, but an
eventual excessive rise of inflation is a tail risk that needs monitoring.

A negative growth shock in the short term              Figure 1: Broader downturn than the Great Depression
                                                       Share of countries in recession, in %, 1871–2020
While the COVID-19 crisis led to a sharper and
more synchronized downturn than the Great              100
Depression of the 1930s (Figure 1), it will most        90
likely not last nearly as long. In the Great
                                                        80
Depression, severe policy errors, particularly tight
monetary policy, a virtually non-existent counter-      70
cyclical fiscal policy and rigid labor market struc-    60
tures caused a decade of massive unemploy-              50
ment and general economic calamity. This time,
                                                        40
the policy responses have been quite different.
Jordà et al. (2020) analyzed the macroeconomic          30
consequences of past pandemics back to the              20
14th century and found persistent negative              10
growth impacts over 30–40 years. Yet, in the
                                                          0
past, a massive death toll among the working
                                                              1871
                                                                     1878
                                                                            1885
                                                                                   1892
                                                                                          1899
                                                                                                 1906
                                                                                                        1913
                                                                                                               1920
                                                                                                                      1927
                                                                                                                             1934
                                                                                                                                    1941
                                                                                                                                           1948
                                                                                                                                                  1955
                                                                                                                                                         1962
                                                                                                                                                                1969
                                                                                                                                                                       1976
                                                                                                                                                                              1983
                                                                                                                                                                                     1990
                                                                                                                                                                                            1997
                                                                                                                                                                                                   2004
                                                                                                                                                                                                          2011
                                                                                                                                                                                                                 2018

age population led to a significant decline in
the return on capital and low growth, even if it
boosted the wages of the survivors. Given the
lower mortality rate of the COVID-19 pandemic          Source: Bolt et al. (2018); Kose, Sugawara, and Terrones (2019, 2020); World Bank,
among the young and middle-aged and in view            Credit Suisse
of advances in science and medical care, the
economic impact of this pandemic is likely to be
far less severe than that of past pandemics.

Even so, the question arises whether the
COVID-19 recession could break the longer-
term growth trend. Given the rapid and forceful

8
Figure 2: Post-World War II shocks have dampened the growth trend
Countries where rolling 5-year GDP growth deviates more than one standard from trend

10

 8

 6

 4

 2

 0

-2

-4

-6
     1945         1950       1955      1960        1965        1970        1975      1980   1985       1990         1995       2000        2005        2010

      Australia          Switzerland      Denmark           France         United Kingdom   Greece          Italy       Sweden          United States

Source: Maddison Project Database, version 2018, Bolt et al. (2018), Credit Suisse

                              fiscal and monetary policy responses, it is
                              close to certain that any longer-term impact on
                              growth will be far more limited than after the                 Falling productivity of innovation
                              Great Depression. Yet a negative impact similar                activities is a long-term problem –
                              to that of the oil shocks of the mid-1970s or                  David Dorn, Professor of Globalization
                              the financial crisis of 2008–09 cannot be ruled
                              out (Figure 2). Permanently increased costs
                                                                                             and Labor Markets, University of
                              related to heightened preventative medical care                Zurich
                              or safety measures in public transport, trade
                              and office usage could raise unit labor costs
                              and weigh on global productivity growth. There
                              could also be second-round effects on growth                   Limited risk to debt sustainability, for now
                              from reduced consumer or business consumer
                              confidence, with the latter harming domestic                   As a result of the fiscal support measures, the
                              and international investment (“scarring” effects;              loss in tax revenue and the growth slump, public
                              Kozlowski et al. [2020]). If the pandemic has                  sector debt-to-GDP ratios have surged in 2020.
                              also reinforced protectionist trends (see Chapter              The International Monetary Fund (IMF) expects
                              4), these negatives would be exacerbated. In                   debt-to-GDP ratios in advanced economies to
                              combination, these negatives will likely outweigh              rise by over 20 percentage points on average
                              some of the transformational and productivity-                 in 2020, far exceeding the rise in 2008–09
                              enhancing results of the pandemic like the                     (Figure 3). The key issue is whether debt will
                              accelerated digitalization. Since the COVID-19                 become unsustainable and/or add to pressure
                              pandemic is an exogenous and well-identified                   on central banks to fund the debt with potential
                              shock that can be counteracted in a highly                     inflationary consequences.
                              targeted manner, the longer-term negative
                              effects should be less severe than those                       Three parameters determine whether debt is
                              resulting from a prolonged build-up in economic                sustainable: the primary fiscal deficit (i.e. the
                              imbalances, which caused the financial crisis, for             deficit excluding interest payments), the interest
                              instance.                                                      rate on debt and the GDP growth rate.

                                                                                                   What will last? The long-term implications of COVID-19     9
Figure 4 provides a range of scenarios under            Figure 3: Sharp rise in debt ratios as a
which debt could become unsustainable by                consequence of COVID-19
focusing on critical interest rate levels and           Change in general government gross debt, % of GDP
changes. We assume that countries will manage           30
to achieve balanced primary budgets from 2022
onward and return to their projected trend GDP          25
growth by then. Under those assumptions,                20
Japanese government bond yields, for example,
                                                        15
could rise by one percentage point relative to
the average for 2020 without destabilizing the          10
debt ratio. In Germany, yields could even rise            5
by 3.7 percentage points, and in the USA by
1.9 percentage points. Given our view (and the            0
consensus view) that yields on advanced economy          -5
government bonds will remain low for quite some

                                                                 Japan

                                                                         Spain

                                                                                 Italy

                                                                                                                                        Portugal

                                                                                                                                                              Switzerland

                                                                                                                                                                                Ireland
                                                                                                                                                   Germany
                                                                                           Canada

                                                                                                    Greece

                                                                                                                     USA

                                                                                                                             France
                                                                                                              UK
time, such increases seem unlikely.

The situation is different for Italy. Although its             Change 2020               Change 2008/2009
benchmark yield declined in 2020, it remains            Source: IMF, Credit Suisse
above the tolerable interest-rate level. Still, Italy
will require a primary surplus of about 0.6% of
GDP to stabilize its debt ratio after 2022. Yet,
if we remember that Italy had a primary surplus         Figure 4: Debt sustainability scenarios
of 1.6% on average in the decade before the             Actual vs. tolerable level of interest rates (l.h.s., in %) and government
COVID-19 shock, this requirement may not be             debt ratios (r.h.s., % of GDP)
unfeasible. Moreover, this analysis does not take       4                                                                                                                   400
into account that additional central bank bond
purchases would ease financing conditions and           3                                                                                                                   300
increase the fiscal leeway of governments.
                                                        2                                                                                                                   200

                                                        1                                                                                                                   100
Base case is low inflation, excessive
inflation a tail risk
                                                        0                                                                                                                   0

A key issue is whether the COVID-19 crisis              -1                                                                                                                  -100
might eventually boost inflation. In recent months,               USA            UK             Germany Switzerland             Japan                 Italy
inflation declined sharply in advanced economies
(Figure 5) and many emerging markets although                Tolerable interest rates (trend GDP growth)
                                                             Actual interest rates (2020 benchmark yield average)
the lockdowns early in the COVID-19 pandemic                 Projected debt-to-GDP ratio (rhs)
constituted a negative supply shock, which should
have boosted prices. Yet such short-term devel-         Source: IMF, European Commission, Datastream, Credit Suisse

opments do not necessarily mean that inflation will
not eventually rise more than expected or desired
by central banks.                                       Figure 5: Declines in core inflation at the start of the pandemic
                                                        Core inflation rate in developed markets* (% YoY), median and range
Drawing on the so-called quantity theory of             6
money, some observers worry that the dramatic           5
expansion of central bank balance sheets since          4
the beginning of the pandemic implies substan-
                                                        3
tially heightened inflation risks (Goodhart [2020]).
                                                        2
Indeed, as a share of GDP, the increase in the
balance sheets of the Federal Reserve (Fed)             1
and European Central Bank (ECB) has been                0
more than twice the expansion during the Global         -1
Financial Crisis (Figure 6). Moreover, larger           -2
money aggregates such as M2 have also surged.           -3
Meanwhile, the velocity of circulation has              -4
mechanically dropped in recent months                     2004                   2008                        2012                     2016                              2020
(Figure 7) as GDP not only failed to respond to
                                                                   Minimum                 Median                  Maximum
the increase in money supply but actually shrank.
However, the sharp rise in M2 and other large           * Sample: USA, UK, Canada, Korea, Switzerland, Japan, Austria, Belgium, Denmark, Finland, France,
money aggregates was essentially due to two             Germany, Greece, Ireland, Italy, Netherlands, Norway, Portugal, Spain, Sweden.
special factors. First, guaranteed and/or               Source: Datastream, Credit Suisse

10
Figure 6: Dramatic expansion of central bank money subsidized loans sharply accelerated credit
Total assets, % of GDP growth in many economies. This credit creation
by banks boosted the money supply because
160 the funds were redeposited with banks. This
140 acceleration in credit growth is likely to be
temporary since many companies will pay back
120
at least some of the loans, while governments
100 phase out their credit guarantee programs.
80 Second, central bank purchases of financial
assets from the non-financial private sector also
60
added to the money supply. These purchases
40 should be wound down once economic activity
20
and inflation reach central bank targets.
0 Conversely, as GDP recovers, velocity should
2007 2008 2010 2011 2013 2014 2016 2017 2019 2020
mechanically increase and might even rise above
Fed ECB BoJ SNB its early 2020 starting point. Yet the downward
trend of the past decades is unlikely to reverse
Source: Datastream, Credit Suisse as long as interest rates, i.e. the opportunity cost
of holding money, remain low. Even if velocity
did increase, inflation would not necessarily rise.
Figure 7: Significant drop in velocity In fact, the relationship between money supply
Money velocity (M2) growth and consumer price index (CPI) inflation
has weakened significantly over past decades.
2.5
Generally, we find no statistically significant rela-
tionship between the two from 1990 to 2019. In
economies with modern transaction technologies,
2
it seems that the volume of spending on goods
and services, which determines prices, can be
1.5 increased without requiring “more money.” We
see little reason for the relationship between the
1 two variables to be re-established anytime soon.
0.5 In our view, inflation would only rise if the so-
called output gap tightened significantly. This
0 could happen, for example, if the combined fiscal
1980 1984 1988 1992 1996 2000 2004 2008 2012 2016 2020 and monetary impulses and demand multipliers
were substantive. So far, this is not the case.
USA Switzerland Eurozone Despite their unprecedented size, however, fiscal
packages and short-time work schemes were
Source: Datastream, Credit Suisse
the most important component, compensating
60%–80% of incomes for a limited number of
households. In the USA, income support tem-
Figure 8: Closing the output gap is a challenge porarily raised disposable income above trend.
GDP growth rate (in %) and fiscal impulse (% of GDP) required to Loan guarantees were another large part of the
close the output gap in 2021 fiscal reaction, but were likely spending-neutral in
the first round. Figure 8 shows that the growth
16 rates required to close the output gap by end-
2021 would need to be higher than currently
14
forecast. Closing the output gap would thus
12 require additional large fiscal packages – unlikely
10 for political reasons – or an implausibly high fiscal
multiplier of at least unity. In fact, the multipliers
8
for such programs are estimated to be much
6 smaller as a considerable share of the impulse
4
goes into savings.1
2
0 1. Fiscal interventions may also affect potential GDP,
USA UK Eurozone Switzerland Japan i.e. government action could result in growth-enhancing
investments or in growth-reducing distortions. The former
Projected growth Required fiscal stimulus Required growth more successful fiscal program would delay the closing of
the output gap and thereby limit inflation risks, while the
Source: Datastream, Credit Suisse latter would boost inflation, but on a lower growth path.
What will last? The long-term implications of COVID-19 11The “workhorse” of macroeconomics, the claim that central banks’ current asset purchase
so-called Philips curve, postulates that unem- programs and their extraordinarily low interest
ployment drives inflation. From a cyclical per- rates are, in fact, just that. However, while
spective, the COVID-19 crisis will lead to higher central banks are currently experiencing fiscal
unemployment, which should dampen inflation expansion through asset purchases and low
pressure, all else being equal. Yet measuring interest rates, this seems to be fully justified
this link would be difficult, particularly in Europe, by their mandates in the current low-inflation
where wage subsidies and short-time work environment. It is difficult to detect any signs of
schemes have prevented unemployment from waning central bank independence at this point.
rising. Most studies have shown that the Philips While a few politicians have called for specific
curve relationship has weakened in past decades easing policies or have intervened in central
(Del Negro et al. [2020]). In the USA, the curve banks’ long-term strategies, it is worth noting
is particularly flat, suggesting that inflation hardly that it has tended to be the central bankers who
responds to changes in labor market conditions have called on politicians to further support the
(Figure 9). The correlation between the unem- economy by means of fiscal policy.
ployment rate and wage growth is slightly stronger.
As one would expect, higher unemployment
leads to slower wage growth and vice versa.
There is also some correlation between wage
growth and CPI inflation. Goodhart suggests that
demographic change could trigger inflation, as Central banks will continue pursuing
ample government support for a rising number of low-interest monetary policies
retirees boosts demand for goods, services and – David Dorn
fewer workers. However, the example of Japan
suggests that the elderly have tended to boost
savings rather than spending.
That said, the critical question is how central
banks would react if the objectives of monetary
How much do we need to worry about and fiscal policy began to diverge, i.e. once higher
central bank independence? interest rates (and, more specifically, rates at
levels that make debt-servicing costs for govern-
Finally, the coincidence of a severe recession ments unsustainable) become necessary to avoid
with high government debt has raised fears that economic overheating. Yet, even in such a case,
central banks will be “subjugated” by govern- it is not clear that central banks would become
ments and forced to inflate debt away. Some the extended arm of their finance ministries.
Figure 9: Philips curve particularly flat in the USA
x-axis: ILO unemployment rate; y-axis: inflation rate; in %
8
7
6
5
4
3
2
1
0
-1
-2
0 2 4 6 8 10 12 14
USA Switzerland Eurozone UK Linear (USA) Linear (Switzerland) Linear (Eurozone)
Source: Datastream, Credit Suisse
12At least in past decades, we do not observe a Takeaways
strong relationship between the change in nominal
government debt and inflation. Cross-correlation ȹ The COVID-19 crisis is a sharper and
analyses for a sample of developed and emerging more synchronized downturn than the
countries2 show no conclusive results. If any- Great Depression. Yet it will most likely not
thing, inflation appears to lead the change in last nearly as long thanks to better policy
debt levels, suggesting that higher inflation rates responses. The measures taken should be
in the past and the resulting easing of the debt sufficient to mitigate second-round effects
burden could incentivize governments to take on that could weigh heavily on future growth,
more debt. Conversely, tighter monetary policy but risks are to the downside.
that lowered inflation tended to reduce debt ex- ȹ As a result of fiscal support measures, losses
pansion. Yet this relationship only holds for some in tax revenues and the growth slump, public
countries and sub-periods. sector debt-to-GDP ratios have surged in
2020. Despite these significant fiscal deficits,
A 2015 study by Bodea and Hicks suggests government debt should be sustainable as
that central bank independence did not change long as deficits are gradually reined in and
between 2000 and 2014, when debt levels growth rates exceed interest rates.
surged and central banks began massive asset ȹ The fiscal packages did not compensate for
purchase programs in response to the Global the collapse in demand. This opened up a
Financial Crisis. All this does not prove that significant output gap, which is disinflationary.
central bank independence cannot be lost or Further fiscal expansion would only create
weakened going forward. What would happen, inflationary pressures if it managed to close
for example, if markets lost confidence in a the output gap rapidly before supply could
government’s ability to service its debt (i.e. if adjust to the recovery of demand, which is a
risk premiums in government bond yields began rather unlikely scenario.
to rise)? Would central banks provide support ȹ Both central bank balance sheets and larger
and increase their debt purchases to support monetary aggregates have ballooned during
governments? the crisis. Yet this was due to special factors
such as government-guaranteed credits and
We believe they would, but mainly to maintain enhanced asset purchases. Meanwhile, the
price and financial stability. The key question linkage between money supply measures and
is under what conditions this would occur. If inflation has weakened over past decades.
support by central banks is conditional on fiscal ȹ We see fears of rising inflation as
consolidation and other reforms – as during the exaggerated and are more concerned that the
Eurozone crisis – worries over a loss of central post-COVID-19 world will be one of sluggish
bank independence and rising inflation would be growth and barely visible inflation. That said,
misplaced. We are confident that this will remain a structural shift toward higher inflation, either
the scenario in the Eurozone. Whether it will be due to demographic or political factors, is a
the case elsewhere remains to be seen. That tail risk.
said, it is the population at large that is likely
to discipline profligate governments eventually.
High inflation is seriously damaging to most
households, especially pensioners, and firms.
If governments go down that path, a political
reaction is likely. All in all, we consider fears of
rising inflation exaggerated and believe that the
post-COVID-19 world will see sluggish growth
and barely visible inflation.
2. USA, UK, Germany, Switzerland, Japan, Turkey, Brazil
What will last? The long-term implications of COVID-19 1314
GettyImages, Elena_Sistaliuk2. Reshaping international
relations?
As a recurring element of history, pandemics have often had profound
effects on governments and the course of war and peace between
nations. What impact will COVID-19 have on geopolitics? What does
the crisis mean for China’s future role in an increasingly multipolar and
multi-aligned world? Will the European Union emerge from the crisis
weaker or stronger?
The crisis of multilateralism The changed attitude toward multilateralism
has as much to do with China’s rise as with the
Even before the COVID-19 crisis, multilater- USA’s retreat from the geopolitical and multilat-
alism and multilateral institutions were under eral scene. Under the Trump administration, the
siege, with a few notable exceptions such as USA adopted a more transactional foreign policy
the International Monetary Fund. Unfortunately, as priorities shifted inward. US troop withdrawals
the COVID-19 pandemic has neither drawn the ranged from Iraq, Syria and Afghanistan to a
world closer together nor fostered more cooper- planned reduction of the USA’s military pres-
ation across nations. Governments have acted ence in Germany. The USA also withdrew from
largely on their own, with borders often closed the Trans-Pacific Partnership (TPP), the Paris
unilaterally. Even within the Schengen Area, food Climate Accord, the Iran Nuclear Deal and the
exports were halted and governments blamed World Health Organization. The World Trade
one another, similar to other pandemics in human Organization has been seriously weakened,
history. Demands from the USA, Australia and with its hallmark dispute settlement mechanism
other nations for an inquiry into the origin of the currently not working due to disputes over the
virus and China’s response further illustrate the nomination of new judges. To the credit of the
exchange of allegations. USA, the Trump administration successfully
fostered a rapprochement between some states
in the Gulf region and Israel. North Korea has
arguably dialed down its aggressive behav-
ior. The North American Free Trade Agree-
ment (NAFTA) was replaced by the United
COVID is less transformative as States-Mexico-Canada Agreement (USMCA).
a lens of longer-lasting changes
– Joseph Nye, former Dean of the China’s rise on the multilateral scene gained
momentum with its adherence to the World Trade
Kennedy School of Government at Organization in 2001. As China’s economic
Harvard University weight increased, so did its soft power (Figure 1).
Arguably, the recent conclusion of the Regional
Comprehensive Economic Partnership (RCEP),
What will last? The long-term implications of COVID-19 15the world’s largest plurilateral trade agreement The result is an increasingly emerging trend
covering about a third of the world’s population toward multi-alignment, best visible in Asia and
and global GDP, can be considered a win for increasingly evident in other emerging mar-
China in the Asian trade-policy arena. The rivalry ket countries. Singapore’s Prime Minister Lee
between the USA and China has thus broadened Hsien Loong (2020) recently summed it up:
well beyond US-China trade issues and other “Asia-Pacific countries do not wish to be forced
bilateral tensions. It involves questions about the to choose between the USA and China. They
freedom of navigation in the Pacific, human rights want to cultivate good relations with both. They
and how to interact with civil society, technology cannot afford to alienate China, and other Asian
standards with regard to data governance or cyber countries will try their best not to let any single
security, and much more. Today, China’s foreign dispute dominate their overall relationships with
policy is visibly more assertive. China’s military Beijing. At the same time, those Asian countries
spending, still a third of the amount spent in the regard the USA as a resident power with vital
USA, has been rising at a rapid pace. China’s interests in the region.” While the world may well
course of action in the China Seas and, most see more multilateralism again under a Biden ad-
recently, tensions over border territories with ministration in areas such as climate change and
India are all illustrative of China’s rise to a more non-proliferation as well as more alliance-building
forceful power. (particularly in Asia), growing multi-alignment
should be expected.
Figure 1: China’s soft power on the rise
The big question is whether China's score in the Soft Power 30 ranking
we are at a geopolitical turning 60
point and, if so, what values and 50.5 51.9 51.3
norms will govern in the future 50 45.1
– The Rt Hon Sir John Major KG CH, 40.9
former Prime Minister of the UK and 40
Senior Adviser to Credit Suisse
30
20
From multilateralism to multi-alignment 10
Against the backdrop of a growing rivalry for 0
economic and technological dominance, Ameri- 2015 2016 2017 2018 2019
cans hold an increasingly negative view of China,
Source: Portland
and calls for economic decoupling have grown
louder across the political spectrum. According to
a survey by the Pew Research Center released
in summer 2020, 73% of Americans say they Figure 2: Increasingly negative views of China
have an unfavorable view of China, the highest Share of respondents who have an unfavorable view of China in %
level in 15 years and up 26 percentage points
100%
since 2017 (Figure 2). Negative views of China
90%
are up seven percentage points since March,
showing the impact the pandemic has had on 80%
American perceptions. But China has been 70%
regarded with increasing suspicion outside of the 60%
USA as well. In Europe, for example, the views 50%
of China have become increasingly unfavorable 40%
in Spain, France and Germany. In Italy, although 30%
medical equipment and doctors sent by China to 20%
help fight the virus have mitigated the increase
10%
in negative attitudes since the beginning of the
0%
pandemic, views have overall become more un- 2005 2008 2011 2014 2017 2020
favorable in the last decade. Australia, India and
Japan all have their own issues with China, as do Australia UK Germany USA
Spain France Italy Japan
smaller nations like Taiwan (Chinese Taipei), the
Philippines and Vietnam. Source: Pew Research Center
16Smaller countries might look to strengthen their (ASEAN), according to Herrmann and Wuebbeke
own positions by joining competing dominating (2020) of the consulting firm Sinolytics. This could
powers depending on their own national interests be both positive and negative for Russia, support-
and thereby possibly leading to a stable multipolar ive of the Belt and Road Initiative (BRI) as a lever
balance. The “Quad,” a rather informal security to bring about a more multipolar world challenging
framework and coordination mechanism uniting US hegemony. On the other hand, some observers
Australia, India, Japan and the USA, for example, view increased Chinese investment in Russia’s
may well step up its efforts in Asia by trying to “backyard” as unwanted competition.
involve other countries such as Indonesia or
Vietnam. In technology, countries like Australia
and the UK, faced with a difficult situation over
the 5G networks, have opted for Western technol-
ogy, while Chinese technology will likely play an
important role in many emerging market countries The rise of a competitive market-
and the developing world. In infrastructure finance, place in international relations is
China’s Belt and Road Initiative is competing foreseeable – Parag Khanna, Global
with the European Bank for Reconstruction and
Development. In pharma, China and Russia have
Strategy Advisory and bestselling
sought to be supportive during the COVID-19 author of “The Second World”
crisis, delivering aid and sending medical workers
to severely challenged European countries, as well
as giving Latin American and Central European
countries access to their vaccine technologies, as And Europe? More, not less European
an alternative to the European Union (EU) and the integration
USA.
Europe’s response to the pandemic has under-
scored that policymaking in the EU is not yet
guided fully by cooperation and coordination. A
European dimension also remains largely absent
in public health policy. For the populist govern-
China has the ambition of ments in some EU countries, the COVID-19
transforming the international crisis reinforces the narrative that the enemy
system to one that aligns more comes from the outside and that the nation state
should remain the center of political power and
to its own – Elizabeth Economy, in control of its destiny. The COVID-19 crisis has
Senior Fellow Hoover Institution, also again highlighted internal differences be-
Stanford University tween the economically strong northern member
states and southern and eastern Europe. Still,
the European Central Bank (ECB) played an
important role, acting swiftly with its EUR 1.35
trillion pandemic emergency purchase program.
Shifting priorities in a multipolar world –
supply chain safety and more self-reliance Despite the initial lack of coordination and oppo-
sition from the so-called “Frugal Four” (Austria,
Countries around the world, including in Asia, are Denmark, the Netherlands and Sweden), an
attempting to broaden their base and reduce their agreement was reached in July 2020, spear-
dependence on others, notably China, as suppliers, headed by France and Germany, on a massive
investors or key markets. This will likely entail EU Recovery Fund authorizing the European
efforts to return manufacturing to the respec- Commission to borrow up to EUR 750 billion
tive home countries and diversify supply lines, from markets to help finance EU member states’
and could present interesting opportunities for COVID-19 recovery for the 2021–23 period
countries like Vietnam or Taiwan (Chinese Taipei, (including EUR 360 billion in the form of loans).
see Chapter 4). Japan, for instance, has offered The fund is focused on accelerating the green
incentives to foster this trend toward reshoring. and digital transitions, and aimed at enhancing
In March 2020, then-prime minister Shinzo Abe “strategic autonomy” in the EU. The latter priority
announced subsidies of up to USD 2 billion for entails efforts in regard to data localization,
Japanese companies that relocate factories from digital infrastructure sovereignty, financial market
China to Japan or other countries in Asia. self-sufficiency, a stronger international role for
the euro and redomiciled or shortened medical
China, in turn, will likely scale back its connectivity supply chains – all feeding into the debate about
programs with Latin America, the Middle East and how the EU can increase its autonomy and
Central Asia, and increase its focus on members international assertiveness, while remaining open
of the Association of Southeast Asian Nations and competitive.
What will last? The long-term implications of COVID-19 17Provided the resistance of some Eastern Yet divisions between member states have
European member states against rule of law made prompt and effective EU action to address
conditionality can be overcome, this agreement security issues posed by Libya and Russia all
on increased EU spending and the doubling of but impossible. Europe has also been unable to
the EU budget are significant steps toward fiscal speak with one voice when dealing with Turkey’s
union and further European integration. It not drift from the North Atlantic Treaty Organization
only aims to safeguard the EU common market, (NATO) and the EU in order to realize its own
but also monetary union and the euro. Hence the geopolitical ambitions. Another challenge is the
COVID-19 crisis should lead to more European still unsolved issue of migration. Owing to the
integration, not less. pandemic, the economic situation in many devel-
oping countries has deteriorated rapidly, making
According to the plans of the European an increase in migration flows likely. However,
Commission, 30% of the EUR 750 billion will member states remain divided on the issue of
be raised through green bonds, with 37% of sharing the volume of migrants. Calls to provide
the recovery budget spent on European Green debt relief for these countries can be expected to
Deal objectives and 20% on digital initiatives. grow louder.
This is in keeping with the European Commis-
sion’s ambitions to position the EU as a global
leader in the fight against climate change, and Takeaways
reduce CO2 emissions by 55% by 2030. It is
a response to growing calls for recovery efforts ȹ The COVID-19 pandemic impacts geopolitics
to focus on a green rebuilding of the economy in various ways, primarily by exacerbating
after the crisis by those who see the pandemic existing trends away from multilateralism to
as a catalyst for a more sustainable economic increasing multi-alignment.
order (see Chapter 9). ȹ The focus on a stable multipolar balance will
gradually shift toward supply-chain safety and
greater self-reliance.
ȹ The EU’s agreement on an EU Recovery
Fund with significant green-economy targets
again illustrates that crises usually lead to
more, not less, European integration.
Europe needs to develop the
ability to respond more quickly
and in a more coordinated way to
China’s assertive behavior on the
global stage – Elizabeth Economy
In terms of EU foreign and security policy, the
pandemic provided an early reality check for the
President of the European Commission, Ursula
von der Leyen, who early on called for her
institution’s mandate to be geopolitical, intending
to advance efforts toward a European Defense
Union. In contrast, observers like Steven
Blockmans (2020), an expert on EU external
relations law at the Brussels-based Centre for
European Policy Studies, maintained that “in a
world dominated by Sino-American rivalry, there
is a space for a third way – one that is defined
by the EU in alliance with like-minded states
and organizations.”
18New York, USA; GettyImages, Alexi Rosenfeld
What will last? The long-term implications of COVID-19 193. States pushing the limits
Fighting the COVID-19 pandemic and offsetting its economic impact
have led to the biggest expansion of state power since World War II.
The scale of the economic response has been very large in historical
comparison, but what is even more crucial are the changes in how
policymakers manage the economy. If history is any guide, the rise in
state power is likely to outlast the crisis.
Government interventions during the crisis Looking at Europe and the USA, the fiscal
packages vary between 6.4% of gross
The global policy reaction to the COVID-19 domestic product (GDP) in Greece and 48.7%
emergency was quick and powerful. Policymakers in Italy (Figure 1). In most countries, deferrals of
passed emergency laws, approved large-scale certain payments (e.g. taxes) and other liquidity
fiscal measures and launched interventions provisions, guarantees and credit lines through
reminiscent of wartime policies. Hoping to avoid national banks make up the lion’s share of the
domestic shortages of essential supplies and limit fiscal response. The fiscal impulse, however,
their dependency on foreign producers, several which includes additional government spending
countries also imposed restrictions on exports, (e.g. medical resources and public investment,
tried to relocate part or all of international value short-time work schemes) and foregone public
chains domestically, or tightened restrictions on revenues (e.g. cancellation of taxes and social
foreign investment in critical infrastructure. security contributions), has so far been more in
Governments also expanded efforts in surveillance line with government responses in previous
practices to prevent the virus from spreading (see crises. As a consequence of the unprecedented
Chapters 4 and 5). fiscal response, debt ratios, measured as a per-
centage of GDP, are expected to increase world-
On average, the fiscal response to the pandemic wide (Figure 2). Whether the rising debt levels
by far surpasses the measures taken by govern- will become problematic will depend mainly on
ments in previous 21st century crises such as the conditions at which governments can borrow
the 2001–02 Argentine Economic Crisis or the money in capital markets (see Chapter 1).
2008–09 Global Financial Crisis (see Chapter
1). Countries’ responses have differed in terms The fiscal response to the pandemic has been
of scope and measures, with the reaction in complemented by swift and decisive monetary
emerging economies more limited so far due policy action. To ease financial stress and ensure
to an initially lower incidence of the pandemic, a smooth flow of credit to the private sector,
narrower fiscal policy space and less-developed central banks worldwide deployed the full range
safety nets and automatic stabilizers (Bank for of crisis tools within weeks. The first measure
International Settlements [2020b]). was to cut policy rates. Lending operations,
asset purchase programs and foreign-exchange
20Figure 1: A powerful fiscal response liquidity measures also played a key role in
Fiscal measures in response to COVID-19 as per 24 November alleviating stress in the financial markets (Bank
2020, % of GDP for International Settlements [2020a]). Compared
50%
to the Global Financial Crisis, central banks
40%
focused less on the financial sector and more
30%
on supporting the flow of credit to households
and non-financial corporations.
20%
10%
0%
Big government: The persistence of
-10%
state power extensions
Spain
Japan
Portugal
Switzerland
Germany
Italy
Greece
Denmark
France
Belgium
USA
Netherlands
UK
State interventions in times of crisis are common
throughout history. Conflicts, diseases, economic
2020 other fiscal measures (incl. loan guarantees) downturns and mass unemployment have often
2020 fiscal impulse led to an expansion of the state and had a
2008/2009 fiscal impulse
2001/2002 fiscal impulse greater impact on government spending than party
programs (Figure 3). In the 20th century, both
Source: International Monetary Fund (IMF), Bruegel, Federal Council, Credit Suisse
world wars led to a large expansion of govern-
ment, especially through defense spending. After
World War II, the economic damage and related
Figure 2: Debt ratios on the rise social needs triggered the development of the
Debt ratios as per 13 October 2020, % of GDP welfare state, which has been driving government
spending in the advanced world for decades
300
(Figure 4).
250
200 Regardless of conflicts and crises, the public
sector has an inherent tendency to expand. As
150 countries become wealthier, demand for govern-
100 ment services grows. Production processes be-
come more complex and require more regulation,
50
state intervention and legal enforcement, fos-
0 tering complex public administrations. Measures
Japan
Spain
Portugal
Ireland
Italy
Germany
Switzerland
Greece
Canada
USA
France
UK
designed to be temporary often tend to become
permanent. If history is any guide, the extension
of state power during the COVID-19 pandemic
End of 2019 Increase due to COVID-19
Source: International Monetary Fund (IMF)
Figure 3: Government expansion in times of crisis
Total government spending, including government interest expenditures, 1880–2011, % of GDP
80%
70%
60%
50%
40%
30%
20%
10%
0%
1880
1885
1890
1895
1900
1905
1910
1915
1920
1925
1930
1935
1940
1945
1950
1955
1960
1965
1970
1975
1980
1985
1990
1995
2000
2005
2010
Australia France Germany Italy Japan Switzerland UK USA
Source: Our World in Data based on IMF and Mauro (2015)
What will last? The long-term implications of COVID-19 21Figure 4: The rise in social spending
Public social spending,* 1880–2018, % of GDP
35%
30%
25%
20%
15%
10%
5%
0%
1880
1885
1890
1895
1900
1905
1910
1915
1920
1925
1930
1935
1940
1945
1950
1955
1960
1965
1970
1975
1980
1985
1990
1995
2000
2005
2010
2015
Australia France Italy Japan Switzerland UK USA
* Public social spending includes spending on health, old age, family, unemployment, active labor market programs, incapacity-related benefits and housing.
Source: Our World in Data based on OECD and Lindert (2004)
may well outlast the crisis. But at what risk? opment of a sound social safety net may be
First, public debt, which reached new highs, will desirable in countries that did not have robust
need to be paid off. In the absence of sufficient social security programs in place prior to the pan-
economic growth or high inflation, this will need to demic. Yet public intervention pursued at any cost
occur through heavier taxation, austerity programs may cause inefficiencies and undermine market
or longer-lasting financial repression. The latter dynamics. What has been appropriate during the
not only implies an invisible tax on savers, but pandemic should be revoked once the crisis is
also exacerbates the underfunding problems of over, but this will not be an easy task. Delegat-
pension systems. ing too many responsibilities to the government
could also create citizens who grow accustomed
Another lasting effect of the public sector to receiving financial support and therefore lack
response to the COVID-19 pandemic could be incentives to participate in a competitive economy.
the increasingly blurred boundaries between In the context of COVID-19, some observers
fiscal and monetary policy. During the crisis, have warned about the negative effects of what
fiscal authorities supported central bank actions they call “epidemic socialism” (Gujer [2020]).
through, for example, fiscal backing of newly
established programs. Compressing the costs Finally, the emergency situation of the pandemic
of raising and servicing public debt, central has allowed political leaders worldwide to expand
banks supported the fiscal expansion of gov- their powers, bypassing parliaments and ruling
ernments (Bank for International Settlements by decree. Once the crisis is over, some leaders
[2020a]). For now, scenarios of hyperinflation will surrender these powers, while others will
seem unlikely and central banks have acted want to keep them. Mature democracies with
within their mandates (see Chapter 1). Yet strong political institutions will likely see leaders
policymakers may grow accustomed to zero surrender such powers, but countries with weak
interest rates to support government borrowing institutions may not.
and could even consider relying on central
banks to fund initiatives unrelated to economic
and monetary stability. Stopping the spread of the pandemic:
A variety of approaches
The pandemic may also prove decisive in shaping
the attitude of policymakers and the public toward While the coronavirus pandemic is a global
individual responsibility and risk. Preventing firms phenomenon, it has been felt in different ways
from going bankrupt and employees from losing around the world, with governments taking
their jobs can be justified initially, especially if the different approaches to tackle it. The response
measures prove effective. Similarly, the devel- in terms of containment measures has been
22Figure 5: Early and decisive action in Vietnam* Figure 6: Lockdown and reduced mobility in Italy*
140 2 140 2
120 120
100 1.5 100 1.5
80 80
1 1
60 60
40 0.5 40 0.5
20 20
0 0 0 0
13 Oct
27 Oct
3 Mar
4 Aug
17 Mar
31 Mar
12 May
26 May
18 Aug
1 Sep
15 Sep
29 Sep
14 Apr
28 Apr
9 Jun
10 Nov
24 Nov
18 Feb
23 Jun
7 Jul
21 Jul
13 Oct
27 Oct
3 Mar
4 Aug
17 Mar
31 Mar
12 May
26 May
18 Aug
1 Sep
15 Sep
29 Sep
14 Apr
28 Apr
9 Jun
10 Nov
24 Nov
18 Feb
23 Jun
7 Jul
21 Jul
Stringency Index Stringency Index
Death rate per 100,000 population (daily) Death rate per 100,000 population (daily)
Retail and recreation Retail and recreation
Workplaces Workplaces
Residential Residential
Figure 7: High US mobility despite stringent measures* Figure 8: Few restrictions in authoritarian Belarus*
140 2 140 2
120 120
100 1.5 100 1.5
80 80
1 1
60 60
40 0.5 40 0.5
20 20
0 0 0 0
13 Oct
27 Oct
3 Mar
4 Aug
17 Mar
31 Mar
12 May
26 May
18 Aug
1 Sep
15 Sep
29 Sep
14 Apr
28 Apr
9 Jun
10 Nov
24 Nov
18 Feb
23 Jun
7 Jul
21 Jul
13 Oct
27 Oct
3 Mar
4 Aug
17 Mar
31 Mar
12 May
26 May
18 Aug
1 Sep
15 Sep
29 Sep
14 Apr
28 Apr
9 Jun
10 Nov
24 Nov
18 Feb
23 Jun
7 Jul
21 Jul
Stringency Index Stringency Index
Death rate per 100,000 population (daily) Death rate per 100,000 population (daily)
Retail and recreation Retail and recreation
Workplaces Workplaces
Residential Residential
Figure 9: Herd immunity strategy in Sweden* Figure 10: Stringent measures for India*
140 2 140 2
120 120
100 1.5 100 1.5
80 80
1 1
60 60
40 0.5 40 0.5
20 20
0 0 0 0
13 Oct
27 Oct
3 Mar
4 Aug
17 Mar
31 Mar
12 May
26 May
18 Aug
1 Sep
15 Sep
29 Sep
14 Apr
28 Apr
9 Jun
10 Nov
24 Nov
18 Feb
23 Jun
7 Jul
21 Jul
13 Oct
27 Oct
3 Mar
4 Aug
17 Mar
31 Mar
12 May
26 May
18 Aug
1 Sep
15 Sep
29 Sep
14 Apr
28 Apr
9 Jun
10 Nov
24 Nov
18 Feb
23 Jun
7 Jul
21 Jul
Stringency Index Stringency Index
Death rate per 100,000 population (daily) Death rate per 100,000 population (daily)
Retail and recreation Retail and recreation
Workplaces Workplaces
Residential Residential
Least stringent (0) Stringency scale Most stringent (100)
* L.h.s.: Change of visits and length of stay at different places compared to a baseline value** (7-day moving average), index baseline = 100; r.h.s.: reported daily deaths per 100,000
people; below chart: Stringency Index value, scale 0–100. ** The baseline value corresponds to the median value for the corresponding day of the week, during the 5-week period from 3
January to 6 February 2020.
Reading example: When Italy declared a national lockdown on 10 March, Italy had a composite score of 82 in the Stringency Index. At this time, Italian citizens on average
reduced their visits and length of stay to retail and recreational locations by approximately 45.9% compared to pre-crisis levels (baseline value). Meanwhile, visits at residencies
increased by 15.7% compared to pre-crisis levels.
Source: Google Community Mobility Reports, Blavatnik School of Government, Worldometer, Credit Suisse
What will last? The long-term implications of COVID-19 23You can also read