ALPS II Autonomous and Lagrangian Platforms and Sensors - Upper-Ocean Temperature Profiles - Geo Prose
←
→
Page content transcription
If your browser does not render page correctly, please read the page content below
ALPS II
Autonomous and Lagrangian
Platforms and Sensors
Upper-Ocean
Temperature Profiles
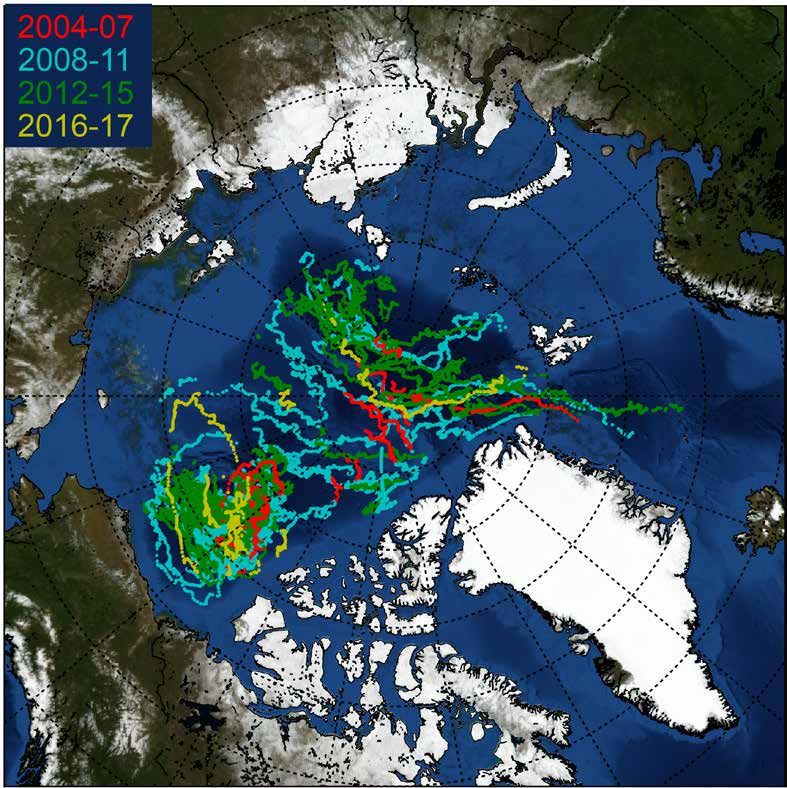
Arctic TS
Profiles
Western Boundary
Current Profiles
Animal Tag CTD
A Report of the ALPS II Workshop
Held February 21–24, 2017, La Jolla, California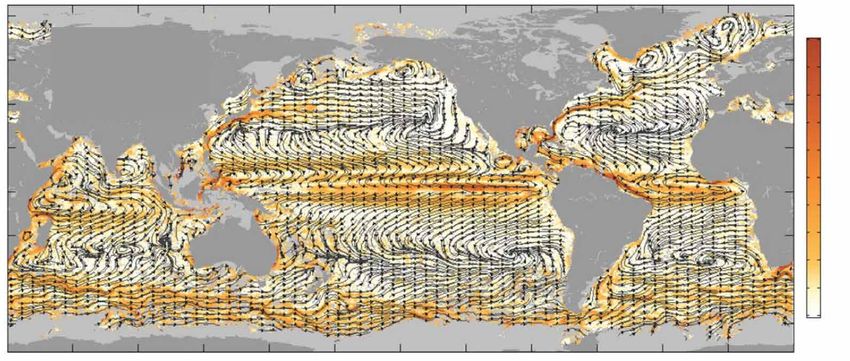
The ALPS II Workshop
The ALPS II workshop was held on February 21–24, 2017, in La Jolla,
California, USA, to address the question: what are the broad visions for
ALPS technology, capabilities, infrastructure, and user base in the next
decade, and in the coming decades?

The ALPS II Mission
1. To survey progress in autonomous platforms and sensors for ocean
   research since the original ALPS meeting 13 years ago.
2. To assess future prospects and challenges.

The ALPS II Steering Committee
Daniel Rudnick
Daniel Costa
Ken Johnson
Craig Lee
Mary-Louise Timmermans

Acknowledgments
The ALPS II workshop and this report were supported by the National
Science Foundation under Grant No. OCE-1722716. Any opinions, find-
ings, and conclusions or recommendations expressed in this material
are those of the author(s) and do not necessarily reflect the views of the
National Science Foundation.

Report Citation
Rudnick, D., D. Costa, K. Johnson, C. Lee, and M.-L. Timmermans, eds.
2018. ALPS II – Autonomous Lagrangian Platforms and Sensors. A Report
of the ALPS II Workshop, February 21–24, La Jolla, CA, 66 pp.
ALPS II
Autonomous and Lagrangian
  Platforms and Sensors

          A Report of the ALPS II Workshop
     Held February 21–24, 2017, La Jolla, California
Contents

Introduction..........................................................................................................................................................................................................................1

Technologies...................................................................................................................................................................................................................... 3
Lagrangian Ocean Observing......................................................................................................................................................................................... 4
Observing the Biological Carbon Pump with Optical and Imaging Sensors.................................................................... 8
On the Use of Animal-Borne Instruments to Monitor the Ocean........................................................................................... 12
Measuring the Ocean and Air-Sea Interactions with Unmanned Aerial Vehicles.................................................... 16

Global.............................................................................................................................................................................................................................................20
Observing the Global Ocean with the Argo Array.................................................................................................................................. 21
Investigating Small-Scale Processes from an Abundance of Autonomous Observations........................... 25
Air-Sea Observations from ALPS............................................................................................................................................................................ 28
Current Usage of ALPS Data and Future Challenges for ALPS Network Design................................................... 32

Regional.................................................................................................................................................................................................................................... 36
ALPS in the Arctic Ocean.................................................................................................................................................................................................. 37
ALPS in the Antarctic.......................................................................................................................................................................................................... 40
ALPS in Coastal Oceanography................................................................................................................................................................................. 43
Boundary Current Observations with ALPS................................................................................................................................................. 47
Underwater Glider Observations for Atlantic Tropical Cyclone Studies and Forecasts................................... 51

Infrastructure................................................................................................................................................................................................................ 55
Developing the Infrastructure for a World-Class Marine Robotics Fleet......................................................................... 56
Data Services for ALPS: Challenges and Opportunities................................................................................................................... 59

Appendices........................................................................................................................................................................................................................ 63
Appendix 1. ALPS II Workshop Agenda............................................................................................................................................................. 63
Appendix 2. ALPS II Workshop Participants................................................................................................................................................. 65
Appendix 3. ALPS II White Papers.......................................................................................................................................................................... 66
Introduction
Daniel Rudnick, Daniel Costa, Ken Johnson, Craig Lee, and Mary-Louise Timmermans
The fundamental observational problem in oceanography is Technologies
sampling a global, turbulent fluid where physical, biological, ALPS technologies include both platforms and sensors.
and chemical processes act over a wide range of scales. Relevant Lagrangian platforms move with the water, including drifters
length scales range from the size of ocean basins down to milli- that track the surface horizontal flow, and neutrally buoy-
meters where turbulent dissipation occurs. Time scales of inter- ant floats that are capable of three-dimensional trajectories
est are as small as seconds and as large as decades or centuries. (D’Asaro). Unmanned aerial vehicles (Reineman) and animals as
An approach to this daunting problem is to use autonomous platforms (Roquet and Boehme) have exploded in use in recent
platforms, defined here as being unconnected either to a ship years, and were not considered during the original ALPS meet-
or the seafloor. This approach relies on many relatively small, ing in 2003. Optical sensors find special application in ALPS for
inexpensive platforms. The wide range of scales favors observa- biological studies as of the carbon pump (Estapa and Boss).
tional systems that are scalable. Intermittence and regionality Lessons from the past 14 years focus around the importance
require observational systems to be portable. of sustained observations to establish reliability. Experimental
The notion of an observing system of small, scalable, and tools are often tried first in more targeted studies. Technology
portable devices was the driver of the first Autonomous and development for sensors must extend through quality control
Lagrangian Platforms and Sensors (ALPS) meeting in 2003. This and data management to achieve the greatest impact.
meeting took place during a time in the early 2000s when there In general, platform development has outpaced improve-
were several competing ideas on how to observe the ocean. ments in sensors. Needed investments in sensors should target
Resources for observing were relatively abundant at the time, Essential Ocean Variables (www.goosocean.org/eov). Devoted
and there were many planning exercises based around the turn centers might be considered to encourage sensor develop-
of the millennium. There were already a number of successes in ment. Sensors for measuring throughout different trophic lev-
the early 2000s, with the Global Drifter Program and the Argo els would contribute to marine resource management. Finally,
profiling float array getting underway. Underwater gliders were education in the use of new sensors could be improved through
just beginning to be used for science as opposed to engineering summer schools or webinar series.
tests. Propeller driven autonomous underwater vehicles (AUVs) A major challenge for sensors is the continuing need to
were starting to see wide use. The trend toward miniaturization improve quality and accuracy. Progress requires cooperation
was leading to sensors for a wide range of physical and biogeo- between manufacturers and practicing scientists. This ongoing
chemical variables. Whether by design or luck, the ALPS meet- quest for improvement is sometimes not as attractive for fund-
ing presaged the rapid growth in autonomous observation that ing, but is essential. While a fine goal is a set of standardized
has fundamentally changed observational oceanography. protocols for each sensed variable, an open question is whether
The ALPS-II meeting took place in early 2017, 14 years after this is an oversimplification or an impediment to creativity.
the first ALPS meeting. Given the growth in the ALPS enterprise,
the topics of interest had grown to include autonomous surface Global
vehicles, unmanned aerial vehicles, and animal borne sensors. The use and value of ALPS on a global scale have grown sig-
Applications of ALPS had also grown, especially in concert with nificantly over the past decade. Key applications include global
the improvement in numerical ocean forecasts and state esti- maps and trends of physical parameters (Gray), numerical state
mates. The topics covered in ALPS-II were thus much broader estimates and network design (Nguyen and Heimbach), global-
than 14 years ago. The collection of brief articles in this report scale assessments of small-scale processes (Cole), and air-sea
reflects the breadth of discussion at the meeting. interactions (Thomson).
The articles are roughly grouped into collections on ALPS The most effective employment of ALPS for global assess-
Technologies, Global and Regional scientific issues, and ments requires filling regional sampling gaps. Essential under-
Infrastructure. This introduction includes a distillation of the sampled areas include coastal shelves, boundary currents, polar
ideas about these topics derived from breakout groups at regions, the deep ocean, the near-surface atmospheric bound-
the meeting. The appendices include the workshop agenda, ary layer, and remote environments such as at ice-sheet ocean
participants, and a list of white papers that were solicited from boundaries. Filling these gaps also requires higher sampling
workshop participants prior to the meeting. resolution for the global array in some cases, and a committed
1
integration effort to ensure connectivity between boundary currents that drive oceanic heat transport and eastern bound-
regions and the interior ocean to produce a single global data ary regions where the effects of global climate variability are felt
set. It is important to recognize the value of multi-platform by society are targets for ALPS networks (Todd et al.). Targeted
experiments, which require making the distinction between deployments of ALPS are an active component of observations
programs (e.g., Argo) and sensor platforms (e.g., floats). for studies of hurricanes (Goni et al.).
In the coming decade, global ALPS systems will be invalu- The specific observational requirements of regions prompt
able tools for event detection and resolution. For example, Argo the use of certain ALPS approaches. Fast, propeller-driven
data enabled the detection (in 2013) and monitoring of a large AUVs are ideal for the short time and space scales near coasts.
mass of warm water in the Pacific Ocean. Sustained systems for Underwater gliders find special application in boundary cur-
identification of such global anomalies will be key to under- rents, and to connect the coast and open ocean. Surface drifters
standing climate processes and making reliable projections. are especially useful to identify circulation patterns and to quan-
Adaptive sampling needs to be an important capability of ALPS tify dispersion. Profiling floats excel at broad coverage, for exam-
platforms in the global array. ple, in the equatorial region. Instrumented animals are perfect
The biggest achievements with respect to global ALPS have for high-density observations where the animals live. Ice-based
been largely physical. There is an immediate need to extend systems are essential for collecting collocated measurements of
global maps and trends to properties like biomass and inor- the upper ocean, ice, and atmosphere at high latitudes.
ganic carbon. Plans for biogeochemical studies on global scales Special challenges in regional settings revolve around the
(BGC-Argo; biogeochemical-argo.org) are presently being merging of data and strengths of different platforms. In this
implemented. Global standards for biogeochemical sensing respect, data services are key to successful regional observing
remain to be fully developed. In the coming decade, it is antic- systems. Assimilative modeling and state estimation yield opti-
ipated that there will be significant progress using ALPS to link mized fields and forecasts for research and decision-making, and
biogeochemical changes to changing physics on a global scale. assessments of network design. Local logistical issues including
Other key focus areas over the coming decade should Exclusive Economic Zones must be respected in regional studies.
include identifying and maintaining core parameters for global
ALPS systems (e.g., the physical ocean data set is critical for con- Infrastructure
tinued monitoring of climate change and viable projections). With the growth of ALPS over the last decade and a half, there
Community needs should be defined for individual sensors, are new requirements for infrastructure for support. Indeed,
encompassing physical, biological, and chemical properties; ALPS systems should begin to be appreciated as infrastructure
for example, air-sea fluxes, waves and velocity measurements as much as ships have been during the last several decades.
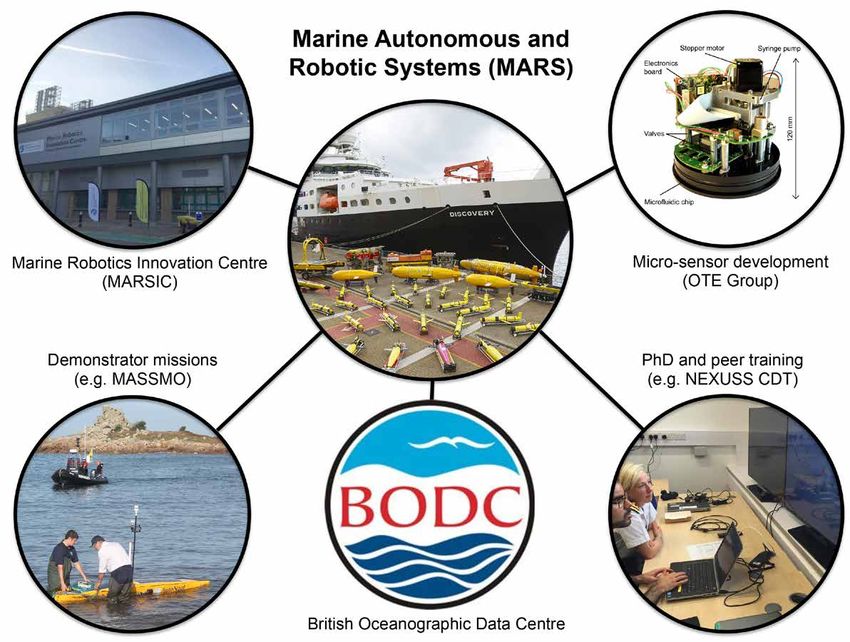
are immediate needs for global ALPS. Other focus areas should Wynne and White present an approach to providing ALPS ser-
be continued improvements in data services for better accessi- vices as infrastructure in the UK. The massive amounts of data
bility of ALPS data, and robust uncertainty estimates (both for created by thousands of ALPS presents challenges and oppor-
global maps and trends as well as for individual data). Novel tunities for data services (Zykov and Miller).
and unanticipated uses of these global ALPS will continue to be ALPS may improve observational capability in environments
made possible by open-access quality-controlled data. Along where resources are constrained, presenting an opportunity as
with essential public access to data for advancing science, there well as a challenge. A key to moving forward is to broaden the
is the need to educate users by providing guidance on appro- user base by lowering barriers of expertise. At the same time,
priate use and limitations. Finally, there is a continual obligation existing expertise must be maintained to continue progress.
for training of early career scientists to maintain quality and Improved data services would increase the use of ALPS data,
reliability of data over the duration of an observational system. creating additional justification for technological development.
Opportunities exist for educational efforts in platform and
Regional sensor use at sea, and in data analysis on land. Communities
Because ALPS are scalable and portable, they are uniquely of practice must be built and supported. This is an area where
suited to regional studies. The scientific and societal motiva- cooperation between agencies may help to identify viable
tions depend on the region, as do the mix of platforms and models and to craft pilot efforts.
approaches. Because the time and length scales of regional With robotics a growing field, ALPS may especially benefit
processes can cover such a wide range, a mix of platforms is from focusing on partnerships between academia, govern-
often required. Among the regions considered in this report ment, and the private sector. With a number of private founda-
are high latitudes in both the Arctic (Timmermans et al.) and tions focusing on the ocean and climate, new ideas for support
Antarctic (Purkey and Dutrieux). Shallow coastal areas are may arise in the coming years. A future network of connected
energetic and biologically active, with many ALPS technologies ALPS covering the global ocean and extending into societally
finding application (Nidzieko et al.). The western boundary important regions is and exciting possibility.
2
Technologies

                                                                                        SPURS-II 2017 Tropical Pacific
                          12°N
                                       Eulerian
                                                                                                                                     a     ngian
                                                      x 10 −3
                                                                15 Sep                                                          Lagr
                          11°N          0                1.0
                                                                           1 Oct
                                      −100                0.8

                                      −200                0.6
                                              Depth (m)

                          10°N                                  1 Sep
                                      −300                0.4

                                      −400                0.2

                                       −500               0.0
06/20   07/10   07/30       9°N
                        08/19     09/08
                                                                                                15 Oct
                                                                                                                    20 km
        Date

                                            100 km
                            8°N
                                                 125°W             124°W     123°W      122°W      121°W    120°W     119°W    118°W       117°W

                                                                         Lagrangian Float                              Central Mooring
                                                                                                     Seagliders
                                                                         Wave Gliders                                  PRAWLER Moorings

                                                                                                                                       3
Lagrangian Ocean Observing
Eric A. D’Asaro

A "Lagrangian" measurement platform moves with the sur-                       and a density close to that of the water, either being slightly
rounding water and, ideally, measures the changing properties                 buoyant (a “surface drifter”; Lumpkin et al., 2017) or accurately
of the same water over time. In contrast, an ideal "Eulerian"                 matching their density to that of the water so as to float at a
measurement platform stays at one location and measures                       subsurface depth (a “float”; Rossby, 2007). The minimal instru-
the velocity and varying properties of different water masses                 mentation is a measurement of their position, which usually
as they move past. Neither is perfect; Lagrangian platforms                   requires small electronics and little power (Rossby et al., 1986).
cannot exactly follow water molecules, particularly their verti-              Small size and lightweight construction are easily possible and
cal motion, while Eulerian platforms always move, particularly                an advantage, increasing the drag and making near-neutral
in strong currents, due to surface waves. The advantages and                  buoyancy easier. Lagrangian instruments thus tend to be inex-
problems of the Lagrangian approach are discussed here.                       pensive so that deploying large numbers is feasible. Thus, the
    The ocean is complicated. Resolving this complexity is only               Global Drifter Program (Lumpkin and Pazos, 2007) maintains
possible with a large number of measurements. Even in phys-                   a global array of about 1500 drifters. The average of velocities
ical oceanography with only a few basic variables, sampling                   computed from these drifters measure the average and vari-
the vast range of spatial and temporal scales, millimeters to                 ability of ocean surface currents both globally (Figure 1) and
megameters and seconds to decades or longer, presents a diffi-                regionally. Similarly, hundreds of subsurface floats measured
cult challenge. For chemistry and biology, with an equal degree               the circulation of the North Atlantic (Bower et al., 2002) and
of variability, but many more things to measure, the challenge                Brazil Basin (Hogg and Owens, 1999). Hundreds of drifters have
is greater. Many of the great successes of oceanography, for                  been deployed in dense local arrays (Poje et al., 2014) to study
example, real-time, eddy-resolving models (Bell et al., 2015) and             smaller-scale eddy properties.
accurate decadal monitoring of the ocean heat content (Riser                     Accurate Lagrangian measurements, like all oceanographic
et al., 2016), rely on large and continuous data streams, satellite           measurements, require attention to instrumental details. For
altimetry, and the Argo float array, respectively. Future progress            surface drifters, minimizing the effects of wind and waves
is likely to require lots of measurements in lots of places.                  requires a sufficiently large underwater drogue area (Lumpkin
    Lagrangian instruments are well suited to deployment in                   and Pazos, 2007) relative to the surface expression, or a clever
large numbers. They move with the flow by having a high drag                  design backed by laboratory and field evidence (Novelli et al.,

80°N
                                                                                                                                                   cm s–1
              Global 15 m Currents                                                                                                                    100
60°N            Annual Average
                                                                                                                                                     90
                  1979–2012
                                                                                                                                                     80
40°N          Global Drifter Program
                                                                                                                                                     70

20°N                                                                                                                                                 60

                                                                                                                                                     50
  0°
                                                                                                                                                     40

20°S                                                                                                                                                 30

                                                                                                                                                     20
40°S
                                                                                                                                                     10

                                                                                                                                                     0
60°S

    30°E      60°E        90°E      120°E       150°E       180°      150°W       120°W       90°W       60°W        30°W        0°         30°E
Figure 1. Mean current speeds (colors) from Global Drifter Program trajectories with streamlines (black lines). Adapted from Lumpkin and Johnson (2013)

4
0
2017). Subsurface floats require careful ballasting and attention Start End
to the compressibility and thermal expansion coefficients of
the instrument relative to seawater (Rossby, 2007). Measuring Surface cooling
the three-dimensional trajectories, including the vertical as well
as horizontal components, is possible with care (Rossby et al.,
1985; D’Asaro, 2003). However, most so-called "Lagrangian"
200
measurements, including surface drifters and Argo floats, only
measure the horizontal component of the trajectory. Warm water
With appropriate instruments, Lagrangian sampling allows Cold water advected up
Pressure (dbar)
measurement of unique flow characteristics. The average of advected
down
many Eulerian velocity measurements in a region can define
the average and variability of the currents. However, only 400
Lagrangian methods directly measure where the water goes
and how it spreads. For example, a week of measurements
at the mouth of a river may indicate that the water is moving
south at 0.5 ± 0.3 m s–1, but give little information as to where
that water, and any pollutants that it carries, will be in a week.
The positions of an array of Lagrangian sensors deployed at the 600
river mouth directly measure both this and the area over which Deep warming
the river water has spread. A large literature tackles the details of Hourly ticks
such "dispersion" statistics (LaCasce, 2008) and has developed
–0.02 –0.01 0.00 0.01 0.02
a number of sophisticated Lagrangian diagnostics (Samelson,
Temperature Change (°C)
2013), including methods to detect "coherent structures" that
trap and transport water masses. The relationship between Figure 2. Variation of temperature and depth along a three-dimensional
these Lagrangian properties and Eulerian statistics and dynam- trajectory of a Lagrangian float during deep convection in the Labrador
Sea (Steffen and D’Asaro, 2002) illustrate the cycle of warming and cool-
ical understanding is an important, but difficult problem.
ing that drives the convection. Water parcels cool and become heavier at
Lagrangian measurements of scalar properties, for example, the surface and thus sink, carrying cold water downward and warming
temperature, salinity, and oxygen, can yield additional insights. slightly by mixing with the surrounding water. At about 600 m depth, they
The equation for variation in the concentration of ascalar C, encounter warmer, saltier water at the bottom of the convective layer,
and warm by mixing with this water. They then move upward, carrying
advected by currents, mixed by a diffusivity and with a growth/
warmer water, until they reach the surface to repeat the cycle.
decay rate S is
∂C + u • C = DC = • κ C + S. (1)
∂t Dt
Often, we want to estimate the left-hand terms in order to mea- profiles within a boundary layer (D’Asaro 2004; D'Asaro and
sure S or κ. Using Eulerian measurements, three quantities in McNeil, 2007). Biogeochemical rates (S) can similarly be com-
the left-hand terms must be measured: the rate of change of C, puted by measuring quantities following a Lagrangian instru-
the velocity and the gradient. Using Lagrangian measurements, ment. For example, Landry et al. (2009) measured changes in
only the center term, the Lagrangian rate of change of C, is nec- phytoplankton and zooplankton biomass along Lagrangian
essary. For a conserved quantity (S = 0), the rate of change of C trajectories in the California upwelling system and compared
following a Lagrangian trajectory (DC/Dt) directly measures the them with incubation-based growth and grazing rates to close
effect of mixing. budgets for the biomass.
For example, temperature changes measured along a Lagrangian instruments are often said to follow a "parcel" of
three-dimensional Lagrangian trajectory during deep convec- water. However, the mass of water initially near a Lagrangian
tion in the Labrador Sea (Figure 2) shows the cycle of surface instrument usually does not remain localized, but spreads over
cooling, downward transport of cold, heavy water, warming by a wide region, with its molecules eventually becoming distrib-
entrainment at the bottom of the convective layer, and finally uted over the entire ocean and beyond. A single Lagrangian
transport upward to the surface. This cycle is implicit in the instrument can at best follow only one of many trajectories
traditional Eulerian formulations of convective heat flux, but originating in its vicinity and provides no information on the
is explicitly demonstrated by Lagrangian measurements. Such surrounding water. Arrays of Lagrangian instruments (Poje
Lagrangian data have been used to compute the value of κ in et al., 2014) address this issue, but alone often do not provide
a stratified fluid (D’Asaro, 2008) and heat, salt, and oxygen flux sufficient measurements of the right type in the right places.
5The combination of an Eulerian survey conducted around and the best combination to address any particular problem
a Lagrangian instrument effectively combines the advantages will depend on the problem. My experience has been that
of both approaches. The advective effects are minimized by combinations of these tools are often the most effective
moving with water, so that Equation (1) can be used, while the approach (Figure 3).
surrounding surveys provide a context for these measurements
and allow corrections due to lateral and vertical shear. For References
Alkire, M.B., E. D’Asaro, C. Lee, M.J. Perry, A. Gray, I. Cetinić, N. Briggs, E. Rehm,
example, during the 2008 North Atlantic Bloom Experiment
E. Kallin, J. Kaiser, and A. Gonzalez-Posada. 2012. Estimates of net community pro-
(Alkire et al., 2012), four gliders surveyed around a mixed layer duction and export using high-resolution, Lagrangian measurements of O2, NO –3 ,
float for 60 days supplemented by several ship surveys. Variants and POC through the evolution of a spring diatom bloom in the North Atlantic.
Deep Sea Research Part I 64:157–174, https://doi.org/10.1016/j.dsr.2012.01.012.
of Equation (1) were used to diagnose the bloom’s evolution Bagniewski, W., K. Fennel, M.J. Perry, and E.A. D’Asaro. 2011. Optimizing models of
(Bagniewski et al., 2011) along the float trajectory, while the the North Atlantic spring bloom using physical, chemical and bio-optical obser-
vations from a Lagrangian float. Biogeosciences 8:1,291–1,307, https://doi.org/
surveys revealed the importance of submesoscale eddies in 10.5194/bg-8-1291-2011.
its dynamics (Mahadevan et al., 2012). Associated chemical Bell, M.J., A. Schiller, P.-Y. Le Traon, N.R. Smith, E. Dombrowsky, and K. Wilmer-
and biological measurements made from a ship were critical Becker. 2015. An introduction to GODAE OceanView. Journal of Operational
Oceanography 8(sup. 1):s2–s11, https://doi.org/10.1080/1755876X.2015.1022041.
to these interpretations. Similar approaches have proved suc- Boyd, P.W., T. Jickells, C.S. Law, S. Blain, E.A. Boyle, K.O. Buesseler, K.H. Coale,
cessful even in the extreme currents and shears of the Gulf J.J. Cullen, H.J. De Baar, M. Follows, and M. Harvey. 2007. Mesoscale iron
enrichment experiments 1993–2005: Synthesis and future directions.
Stream (Thomas et al., 2016). Combinations of Lagrangian Science 315(5812):612–617, https://doi.org/10.1126/science.1131669.
instruments, dye, and ship surveys can also be very powerful Bower, A.S., B. Le Cann, T. Rossby, W. Zenk, J. Gould, K. Speer, P.L. Richardson,
M.D. Prater, and H.J. Zhang. 2002. Directly measured mid-depth circulation in the
(Boyd et al., 2007).
northeastern North Atlantic Ocean. Nature 419(6907):603–607, https://doi.org/
The broader lesson is that a variety of sampling approaches— 10.1038/nature01078.
Lagrangian, Eulerian, or other—are necessary to address the D’Asaro, E.A. 2003. Performance of autonomous Lagrangian floats. Journal of
Atmospheric and Oceanic Technology 20(6):896–911, https://doi.org/10.1175/1520
variety of sampling problems faced in measuring the compli- -0426(2003)0202.0.CO;2.
cated ocean. Autonomous technologies have given us many D’Asaro, E.A. 2004. Air–sea heat flux measurements from nearly neutrally buoyant
floats. Journal of Atmospheric and Oceanic Technology 21(7):1,086–1,094,
new and powerful measurement tools; many more will become https://doi.org/10.1175/1520-0426(2004)0212.0.CO;2.
available. Each of these tools has strengths and weaknesses,
SPURS-II 2017 Tropical Pacific
12°N
Eulerian n
angia
15 Sep Lagr
11°N 1 Oct
10°N 1 Sep
9°N
15 Oct
20 km 15 Nov
100 km
8°N
125°W 124°W 123°W 122°W 121°W 120°W 119°W 118°W 117°W 116°W
Lagrangian Float Central Mooring
Seagliders
Wave Gliders PRAWLER Moorings
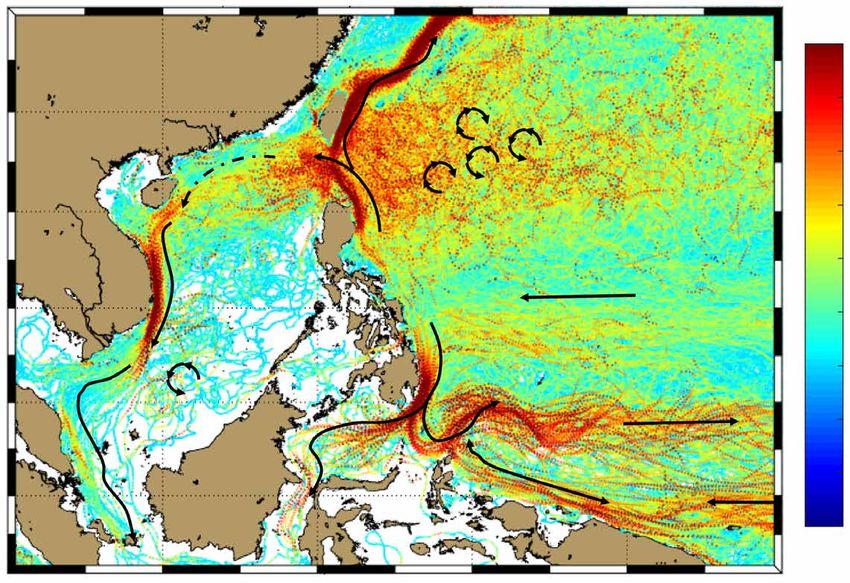
Figure 3. Experimental design for the autonomous components of the SPURS-II program shows a combination
of Eulerian and Lagrangian components (from Lindstrom et al., 2017). A central mooring (star) provides intensive
Eulerian measurements; Seagliders and Wave Gliders survey around it. A Lagrangian float (orange), launched at
the mooring, is advected eastward in the strong currents and provides a reference point for a Seaglider (purple)
and Wave Glider (green) surveying around it. The inset figure, rotated to align to the direction of the float drift,
shows the Seaglider and Wave Glider trajectories relative to the float. A region approximately 20 km around the
float is surveyed every few days. This design addresses the central goal of SPURS-II, which is understanding the
salinity dynamics in this region by measuring both Eulerian and nearly Lagrangian time series and the spatial
context of both.
6D’Asaro, E.A. 2008. A diapycnal mixing budget on the Oregon shelf. Limnology and
Oceanography 53:2,137–2,150, https://doi.org/10.4319/lo.2008.53.5_part_2.2137.
D’Asaro, E., and C. McNeil. 2007. Air–sea gas exchange at extreme wind
speeds measured by autonomous oceanographic floats. Journal of Marine
Systems 66(1):92–109, https://doi.org/10.1016/j.jmarsys.2006.06.007.
Hogg, N.G., and W.B. Owens. 1999. Direct measurement of the deep circu-
lation within the Brazil Basin. Deep Sea Research Part II 46(1–2):335–353,
https://doi.org/10.1016/S0967-0645(98)00097-6.
LaCasce, J.H. 2008. Statistics from Lagrangian observations. Progress in
Oceanography 77(1):1–29, https://doi.org/10.1016/j.pocean.2008.02.002.
Landry, M.R., M.D. Ohman, R. Goericke, M.R. Stukel, and K. Tsyrklevich. 2009.
Lagrangian studies of phytoplankton growth and grazing relationships
in a coastal upwelling ecosystem off Southern California. Progress in
Oceanography 83(1):208–216, https://doi.org/10.1016/j.pocean.2009.07.026.
Lindstrom, E., A.Y. Shcherbina, L. Rainville, J.T. Farrar, L.R. Centurioni, S. Dong,
E.A. D’Asaro, C.C. Eriksen, D.M. Fratantoni, B.A. Hodges, and V. Hormann. 2017.
Autonomous multi-platform observations during the Salinity Processes in the
Upper-ocean Regional Study. Oceanography 30(2):38–48, https://doi.org/10.5670/
oceanog.2017.218.
Lumpkin, R., and G.C. Johnson. 2013. Global ocean surface velocities from drifters:
Mean, variance, El Niño–Southern Oscillation response, and seasonal cycle.
Journal of Geophysical Research 118:2,992–3,006, https://doi.org/10.1002/
jgrc.20210.
Lumpkin, R., T. Özgökmen, and L. Centurioni. 2017. Advances in the application of
surface drifters. Annual Review of Marine Science 9:59–81, https://doi.org/10.1146/
annurev-marine-010816-060641.
Lumpkin, R., and M. Pazos. 2007. Measuring surface currents with Surface
Velocity Program drifters: The instrument, its data, and some recent results.
Pp. 39–67 in Lagrangian Analysis and Prediction of Coastal and Ocean Dynamics.
A. Griffa, A.D. Kirwan Jr., A.J. Mariano, T. Özgökmen, and H.T. Rossby, Cambridge
University Press.
Mahadevan, A., E. D’Asaro, C. Lee, and M.J. Perry. 2012. Eddy-driven stratification
initiates North Atlantic spring phytoplankton blooms. Science 337(6090):54–58,
https://doi.org/10.1126/science.1218740.
Novelli, G., C.M. Guigand, C. Cousin, E.H. Ryan, N.J. Laxague, H. Dai, B.K. Haus, and
T.M. Özgökmen. 2017. A biodegradable surface drifter for ocean sampling on a
massive scale. Journal of Atmospheric and Oceanic Technology, https://doi.org/
10.1175/JTECH-D-17-0055.1.
Poje, A.C., T.M. Özgökmen, B.L. Lipphardt, B.K. Haus, E.H. Ryan, A.C. Haza, G.A. Jacobs,
A.J.H.M. Reniers, M.J. Olascoaga, G. Novelli, and A. Griffa. 2014. Submesoscale dis-
persion in the vicinity of the Deepwater Horizon spill. Proceedings of the National
Academy of Sciences of the United States of America 111(35):12,693–12,698,
https://doi.org/10.1073/pnas.1402452111.
Riser, S.C., H.J. Freeland, D. Roemmich, S. Wijffels, A. Troisi, M. Belbéoch, D. Gilbert,
J. Xu, S. Pouliquen, A. Thresher, and P.Y. Le Traon. 2016. Fifteen years of ocean
observations with the global Argo array. Nature Climate Change 6(2):145–153,
https://doi.org/10.1038/nclimate2872.
Rossby, T. 2007. Evolution of Lagrangian methods in oceanography. Pp. 2–38 in
Lagrangian Analysis and Prediction of Coastal and Ocean Dynamics. A. Griffa,
A.D. Kirwan Jr., A.J. Mariano, T. Özgökmen, and H.T. Rossby, Cambridge
University Press.
Rossby, T., D. Dorson, and J. Fontaine. 1986. The RAFOS system. Journal
of Atmospheric and Oceanic Technology 3(4):672–679, https://doi.org/
10.1175/1520-0426(1986)0032.0.CO;2.
Rossby, H.T., E.R. Levine, and D.N. Connors. 1985. The isopycnal Swallow
float—A simple device for tracking water parcels in the ocean. Progress in
Oceanography 14:511–525, https://doi.org/10.1016/0079-6611(85)90025-4.
Samelson, R.M. 2013. Lagrangian motion, coherent structures, and lines of per-
sistent material strain. Annual Review of Marine Science 5:137–163, https://doi.org/
10.1146/annurev-marine-120710-100819.
Steffen, E.L., and E.A. D’Asaro. 2002. Deep convection in the Labrador Sea as
observed by Lagrangian floats. Journal of Physical Oceanography 32(2):475–492,
https://doi.org/10.1175/1520-0485(2002)0322.0.CO;2.
Thomas, L.N., J.R. Taylor, E.A. D’Asaro, C.M. Lee, J.M. Klymak, and A. Shcherbina. 2016.
Symmetric instability, inertial oscillations, and turbulence at the Gulf Stream
front. Journal of Physical Oceanography 46(1):197–217, https://doi.org/10.1175/
JPO-D-15-0008.1.
Author
Eric A. D’Asaro, Applied Physics Laboratory, University of Washington, Seattle, WA,
USA, dasaro@apl.washington.edu
7Observing the Biological Carbon Pump
with Optical and Imaging Sensors
Meg L. Estapa and Emmanuel Boss
Background fluorescence, beam attenuation) or imaging sensors (e.g., cam-
The biological carbon pump starts with the fixation of CO2 into eras, Laser Optical Particle Counter [LOPC], P-Cam). The more
organic matter by phytoplankton in the surface ocean (Volk mature, bulk bio-optical sensors are easily integrated onto
and Hoeffert, 1985). Most of this material is cycled through standard profiling float and glider platforms, have low power
the food web and respired back to CO2, but a portion is trans- requirements and data volumes, but are not always specific
ferred into deep water, resulting in a net flux of carbon from to the sinking fraction of particles; imaging sensors are still
the atmosphere into the deep ocean that is globally estimated maturing and have higher power and data requirements but
at 5 to >12 PgC per year (Boyd and Trull, 2007; Henson et al., provide information on particle size and transparency and can
2011; Siegel et al., 2014). The estimate has a large uncertainty better elucidate specific mechanisms of the biological pump.
because observations of the vertical, biological carbon flux in However, while particles carrying carbon into the deep ocean
the global ocean are scarce, particularly in the upper 1,000 m have been observed to range from 10 μm (Durkin et al., 2015)
where rapid flux attenuation occurs. Processes that contribute all the way up to several centimeters (e.g., Bochdansky et al.,
to the biological carbon pump include the direct sinking of 2016), no single imaging or particle counting sensor covers
phytoplankton cells, aggregates, and zooplankton fecal matter; this entire size range. Another issue is that most sensor optical
the subduction of suspended particulate organic carbon (POC) sampling volumes are too small to capture some of the largest,
and dissolved organic carbon (DOC), and active transport by rarest particles. Finally, the present lack of a sensor for DOC that
vertically migrating zooplankton (Ducklow et al., 2001; Siegel is suitable for deployment on autonomous platforms restricts
et al., 2014). Open questions include identification of specific carbon flux measurements to the particle-mediated export
biological mechanisms that drive carbon export and how pathways listed above.
these vary spatially and temporally; the interaction between Sensor-platform combinations for measuring sinking particle
physical processes and export of biologically derived carbon; flux have tended to fall into two categories: (1) those that phys-
the importance of particle size and density (including content ically collect sinking particles, either temporarily for imaging, or
of ballast minerals such as biogenic silica and particulate inor- for sample return to a ship, and (2) those that repeatedly collect
ganic carbon) to export efficiency; and the development of optical or image profiles of large (assumed sinking) particles in
process-based rather than statistical models that will enable us the water column and then use a deduced or assumed particle
to predict future behavior of the biological pump under chang- sinking rate to derive fluxes. Both approaches have advantages
ing climate conditions. and drawbacks that are detailed in the following section, which
covers significant developments since 2003.
Observational Techniques
Biological carbon fluxes can change on time scales of days to Advances Since 2003
weeks, and can be spatially patchy on scales smaller than 10 km DIRECT PARTICLE INTERCEPTION TECHNIQUES
(Estapa et al., 2015). Measurements made in a Lagrangian frame Semi-Autonomous Sediment Traps. The collection of sinking,
aboard autonomous platforms have therefore featured heavily upper-ocean particle samples from an untethered, quasi-
in key studies since the last ALPS workshop in 2003 (Rudnick Lagrangian platform is advantageous even disregarding the
and Perry, 2003). A review chapter by Stemmann et al. (2012) other benefits of platform autonomy, because of biases from
broadly summarizes developments in biogeochemical sensors hydrodynamic effects associated with surface tethered sedi-
on autonomous platforms; here we focus specifically on prog- ment traps (Buesseler et al., 2007). Standard profiling floats have
ress in measurements of the biological pump. been modified independently by two groups to carry sediment
Measurement of sinking or subducting particle fluxes requires traps for ship-supported sample collection. Both designs—the
a sensor-platform combination that can detect the small flux Neutrally-Buoyant Sediment Trap (NBST; based around a SOLO
of sinking particles against the much larger background stock float and designed at Woods Hole Oceanographic Institution;
of suspended particles. Typically, particle detection is carried Valdes and Price, 2000) and PELAGRA (based around an APEX
out with bulk bio-optical sensors (e.g., backscatter, turbidity, float and designed at the National Oceanography Centre,
8Southampton; Lampitt et al., 2008), have featured prominently use of imaging sensors. The CFE consists of an imaging trap
in recent biological carbon pump process studies. Both plat- mounted aboard a profiling SOLO float; power and data are
forms have more recently been modified to carry bulk optical self-contained but at the time of this writing, physical platform
sensors and camera systems, which are described separately collection is required to retrieve data post-deployment.
in sections below. In this respect they serve as an important
intercalibration link between completely autonomous, sensor- INDIRECT TECHNIQUES REQUIRING ESTIMATES
based approaches and traditional sediment trap and 234Th OF SETTLING VELOCITY
tracer-based observations that are still the primary tools of the Optical Spike Flux. Profiles of bulk optical properties collected
longest-running time-series programs (Estapa et al., 2017). at a fast sampling rate often contain many spikes, which have
for some time been interpreted as arising from large particles
Transmissometer as “Optical Sediment Trap”. The first truly passing through the optical detection volume (Bishop, 1999;
autonomous measurements of sinking carbon flux were Gardner, 2000; Bishop and Wood, 2008). By filtering optical
made by using a vertically mounted transmissometer aboard profiles of fluorescence and backscattering to separate the
a profiling float to physically collect sinking particles on the baseline signal from this “spike” signal, Briggs et al. (2011,
upward-looking optical window during the drift phase of the 2013) were able to estimate the relative vertical distribution of
float’s mission cycle (Bishop et al., 2004; Bishop and Wood, large particles from autonomous float and glider observations
2009; Estapa et al., 2013, 2017; Figure 1). This method has the during the 2008 North Atlantic Bloom Experiment. In that
advantages of not requiring a particle sinking-rate assumption study, the export flux of large aggregates occurred as distinct
to be made, and utilizing commercially available, mature sensor pulses during the study period and so the increasing penetra-
technology with relatively low power and data transmission tion depth of the large particle spikes was used to deduce the
requirements. It is best suited to use in areas where calibration particle sinking rate and estimate the particulate carbon flux.
samples (for instance, versus a neutrally buoyant sediment trap) This method also has the advantage of using only low power,
can be collected, and in the upper few hundred meters of the commercially mature sensors, although some means of esti-
water column where ambient turbulence is sufficient to carry mating the particle sinking rate and converting the bulk optical
sinking particles into the transmissometer sensing volume properties to carbon are required. The profile repeat interval
(Estapa et al., 2017). and the sensor sampling rate must also be relatively fast in
order to implement this method.
Imaging Sediment Traps. Building further upon the concept of
optical detection of physically intercepted, sinking particles is Fluxes Derived from Changes in the Vertical Distribution of
a class of new devices that are best described as imaging sed- Particles Over Time. Optical or imaging sensors aboard auton-
iment traps. Observations from one such device, the Carbon omous profiling platforms can be used to estimate the change
Flux Explorer (CFE), are presented by Bishop and Wood (2009) in the vertical distribution of particles over time down to some
and Bishop et al. (2016), and illustrate the wealth of information reference depth, and therefore derive a flux estimate. In this
about sinking particle size and origin that is gained through method, the particle sinking speed must again be derived
bbp(700) x 10 −3
0.05 0 1.0
0.04 −100 0.8
Flux proxy (m−1 d−1)
0.03 −200 0.6
Depth (m)
0.02 −300 0.4
0.01 −400 0.2
0.00 −500 0.0
05/11 05/31 06/20 07/10 07/30 08/19 09/08
Date
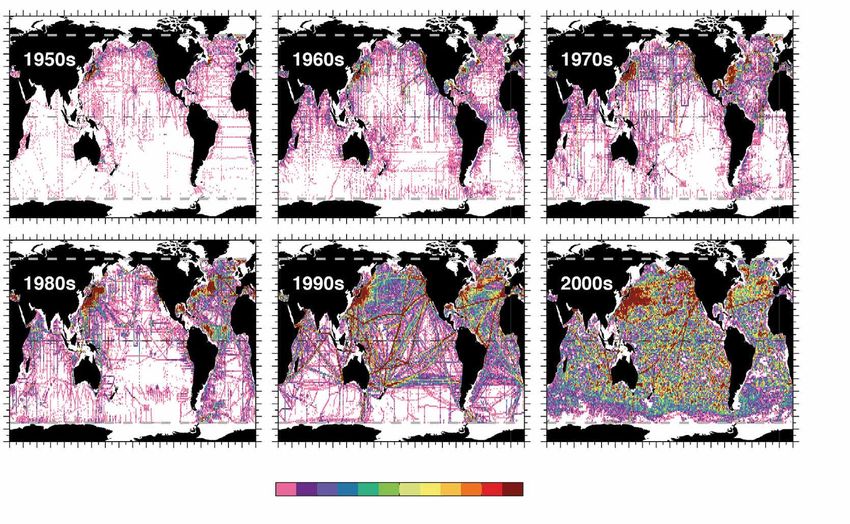
Figure 1. Upper water column optical backscatter (color contours) and particle flux measured at 1,000 m between bio-optical
float profiles using an optical sediment trap (magenta bars). Right-hand y-axis denotes depth in meters. Data were collected
in 2012 in the western Sargasso Sea. From Estapa et al. (2013)
9from observations, and the water column must not experience imagery must be translated into geochemical (usually carbon)
appreciable shear during the measurement period. The optical flux units, and the accuracy of flux estimates is only as good as the
or imaging sensor properties determine the type(s) of sinking calibration. Sinking particles range through six orders of magni-
particles that can be observed. Recent papers illustrate differ- tude in size, which currently requires a multi-sensor approach;
ent applications of the method. Dall’Olmo and Mork (2014) particles responsible for carbon export also have a broad range
and Dall’Olmo et al. (2016) utilized bulk optical backscattering in composition, fractal dimension, and pigmentation. These
sensors to show how the spring/summer shoaling of the mixed factors will continue to make the site-specific calibration of
layer in part drives the seasonal export cycle (the “mixed layer particulate flux sensors a requirement in studies going forward.
pump” described by Gardner et al.,1995). As optical backscat- Further complicating the need for calibration is the lack of a
tering is mainly sensitive to particles 90 μm in diameter (Jackson and Checkley, 2011). Ongoing such as a backscattering sensor. Binned profiles every one to
efforts to adapt and integrate imaging sensors onto profiling two days to 1,000 m would be sufficient for this technique.
floats also include onboard image processing to allow fully Utilization of the “optical spike flux” method would require sam-
autonomous operations. These include the GUARD1 system pling at very high vertical resolution, and implementation of
(Corgnati et al., 2016) and the Octopus sensor (a miniaturized, the “optical sediment trap” technique would require measure-
low-power version of the Underwater Vision Profiler), which is ments to be made during the “drift” phase at a depth shallower
being integrated into the NKE float platform (Mar Picheral, pers. than 1,000 m. Both of these methods could be implemented
comm.). The main drawbacks of these particle imaging meth- on a large scale (perhaps on a subset of floats in a globally
ods are the requirement for an accurate estimate of the particle distributed program) using currently available platforms and
settling velocity size spectrum, and the current lack of an imag- technology. All of the other methods described above require
ing sensor capable of resolving the entire, relevant particle size the collection and transmission of large amounts of image
range (from 10 μm up to tens of millimeters). data using sensors with high power requirements and are thus
better suited at present to medium-length deployments or
Future Challenges ship-supported process studies.
The benefits of making particle flux measurements from auton-
omous platforms will include broader spatiotemporal cover- References
Bishop, J.K.B. 1999. Transmissometer measurement of POC. Deep Sea Research
age, better links to satellite remote-sensing observations, and
Part I 46:353–369, https://doi.org/10.1016/S0967-0637(98)00069-7.
higher-resolution measurements of a patchy set of processes. Bishop, J.K.B., M.B. Fong, and T.J. Wood. 2016. Robotic observations of high winter-
However, such measurements are not yet widespread. One of time carbon export in California coastal waters. Biogeosciences 13:3,109–3,129,
https://doi.org/10.5194/bg-13-3109-2016.
the main challenges is that bulk optical properties and particle
10Bishop, J.K.B., and T.J. Wood. 2008. Particulate matter chemistry and dynamics Henson, S.A., R. Sanders, E. Madsen, P. J. Morris, F. Le Moigne, and G.D. Quartly.
in the twilight zone at VERTIGO ALOHA and K2 sites. Deep Sea Research 2011. A reduced estimate of the strength of the ocean’s biological carbon pump.
Part I 55:1,684–1,706, https://doi.org/10.1016/j.dsr.2008.07.012. Geophysical Research Letters 38, L04606, https://doi.org/10.1029/2011GL046735.
Bishop, J.K.B., and T.J. Wood. 2009. Year-round observations of carbon biomass and Jackson, G.A., and D.M. Checkley Jr. 2011. Particle size distributions in the upper
flux variability in the Southern Ocean. Global Biogeochemical Cycles 23, GB2019, 100 m water column and their implications for animal feeding in the plankton.
https://doi.org/10.1029/2008GB003206. Deep Sea Research Part I 58:283–297, https://doi.org/10.1016/j.dsr.2010.12.008.
Bishop, J.K.B., T.J. Wood, R.A. Davis, and J.T. Sherman. 2004. Robotic observations of Jackson, G.A., D.M. Checkley Jr., and M. Dagg. 2015. Settling of particles in the upper
enhanced carbon biomass and export at 55°S during SOFeX. Science 304:417–420, 100 m of the ocean detected with autonomous profiling floats off California. Deep
https://doi.org/10.1126/science.1087717. Sea Research Part I 99:75–86, https://doi.org/10.1016/j.dsr.2015.02.001.
Bochdansky, A.B., M.S. Clouse, and G.J. Herndl. 2016. Dragon kings of the deep sea: Lampitt, R.S., B. Boorman, L. Browna, M. Lucas, I. Salter, R. Sanders, K. Saw, S. Seeyave,
Marine particles deviate markedly from the common number-size spectrum. S.J. Thomalla, and R. Turnewitsch. 2008. Particle export from the euphotic zone:
Scientific Reports 6:22633, https://doi.org/10.1038/srep22633. Estimates using a novel drifting sediment trap, 234Th and new production. Deep
Boyd, P.W., and T.W. Trull. 2007. Understanding the export of biogenic particles Sea Research Part I 55:1,484–1,502, https://doi.org/10.1016/j.dsr.2008.07.002.
in oceanic waters: Is there consensus? Progress in Oceanography 72:276–312, McDonnell, A.M.P., and K.O. Buesseler. 2010. Variability in the average sinking
https://doi.org/10.1016/j.pocean.2006.10.007. velocity of marine particles. Limnology and Oceanography 55:2,085–2,096,
Briggs, N., M.J. Perry, I. Cetinić, C. Lee. E. D’Asaro, A.M. Gray, and E. Rehm. 2011. https://doi.org/10.4319/lo.2010.55.5.2085.
High-resolution observations of aggregate flux during a sub-polar North Atlantic McDonnell, A.M.P., and K.O. Buesseler. 2012. A new method for the estimation
spring bloom. Deep Sea Research Part I 58:1,031–1,039, https://doi.org/10.1016/ of sinking particle fluxes from measurements of the particle size distribution,
j.dsr.2011.07.007. average sinking velocity, and carbon content. Limnology and Oceanography
Briggs, N.T., W.H. Slade, E. Boss, and M.J. Perry. 2013. Method for estimating Methods 10:329–346, https://doi.org/10.4319/lom.2012.10.329.
mean particle size from high-frequency fluctuations in beam attenuation or Rudnick, D.L., and M.J. Perry, eds. 2003. ALPS: Autonomous and Lagrangian
scattering measurements. Applied Optics 52:6,710–6,725, https://doi.org/10.1364/ Platforms and Sensors, Workshop Report. 64 pp, https://geo-prose.com/pdfs/
AO.52.006710. alps_report.pdf.
Buesseler, K.O., A.N. Antia, M. Chen, S.W. Fowler, W.D. Gardner, Ö. Gustafsson, Siegel, D.A., K.O. Buesseler, S.C. Doney, S.F. Sailley, M.J. Behrenfeld, and P.W. Boyd.
K. Harada, A.F. Michaels, M. Rutgers v. d. Loeff, M. Sarin, and others. 2007. An 2014. Global assessment of ocean carbon export by combining satellite
assessment of the use of sediment traps for estimating upper ocean particle observations and food-web models. Global Biogeochemical Cycles 28:181–196,
fluxes. Journal of Marine Research 65:345–416. https://doi.org/10.1002/2013GB004743.
Buesseler, K.O., S. Pike, K. Maiti, C.H. Lamborg, D.A. Siegel, and T.W. Trull. 2009. Stemmann, L., H. Claustre, and F. D’Ortenzio. 2012. Integrated observation system
Thorium-234 as a tracer of spatial, temporal and vertical variability in particle for pelagic ecosystems and biogeochemical cycles in the oceans. Pp. 261–278 in
flux in the North Pacific. Deep Sea Research Part I 56:1,143–1,167, https://doi.org/ Sensors for Ecology: Towards Integrated Knowledge of Ecosystems. J.-F. Le Galliard,
10.1016/j.dsr.2009.04.001. J.-M. Guarini, and F. Gaill, eds, Institut Écologie et environnement, CNRS, France.
Corgnati, L., S. Marini, L. Mazzei, E. Ottaviani, S. Aliani, A. Conversi, and A. Griffa. Valdes, J.R., and J.F.A. Price. 2000. A neutrally buoyant, upper ocean sediment trap.
2016. Looking inside the ocean: Toward an autonomous imaging system for Journal of Atmospheric and Oceanic Technology 17:62–68, https://doi.org/10.1175/
monitoring gelatinous zooplankton. Sensors 16, 2124, https://doi.org/10.3390/ 1520-0426(2000)0172.0.CO;2.
s16122124. Volk, T., and M.I. Hoffert. 1985. Ocean carbon pumps: Analysis of relative strengths
Dall’Olmo, G., J. Dingle, L. Polimene, R.J.W. Brewin, and H. Claustre. 2016. Substantial and efficiencies in ocean-driven atmospheric CO2 changes. Pp. 99–110
energy input to the mesopelagic ecosystem from the seasonal mixed-layer pump. in The Carbon Cycle and Atmospheric CO: Natural Variations Archean to
Nature Geoscience 9:820–823, https://doi.org/10.1038/ngeo2818. Present. E.T. Sundquist and W.S. Broecker, eds, American Geophysical Union,
Dall’Olmo, G., and K.A. Mork. 2014. Carbon export by small particles in the Washington, DC.
Norwegian Sea. Geophysical Research Letters 41:2,921–2,927, https://doi.org/
10.1002/2014GL059244.
Ducklow, H.W., D.K. Steinberg, and K.O. Buesseler. 2001. Upper ocean carbon export Authors
and the biological pump. Oceanography 14(4):50–58, https://doi.org/10.5670/ Meg L. Estapa, Skidmore College, Saratoga Springs, NY, USA, mestapa@
oceanog.2001.06. skidmore.edu
Durkin, C.A., M.L. Estapa, and K.O. Buesseler. 2015. Observations of carbon export Emmanuel Boss, University of Maine, Orono, ME, USA, emmanuel.boss@maine.edu
by small sinking particles in the upper mesopelagic. Marine Chemistry 175:72–81,
https://doi.org/10.1016/j.marchem.2015.02.011.
Estapa, M.L., K. Buesseler, E. Boss, and G. Gerbi. 2013. Autonomous,
high-resolution observations of particle flux in the oligotrophic ocean.
Biogeosciences 10:5,517–5,531, https://doi.org/10.5194/bg-10-5517-2013.
Estapa, M., C. Durkin, K. Buesseler, R. Johnson, and M. Feen. 2017. Carbon flux
from bio-optical profiling floats: Calibrating transmissometers for use as optical
sediment traps. Deep Sea Research Part I 120:100–111, https://doi.org/10.1016/
j.dsr.2016.12.003.
Estapa, M.L., D.A. Siegel, K.O. Buesseler, R.H.R. Stanley, M.W. Lomas, and N.B. Nelson.
2015. Decoupling of net community and export production on submesoscales in
the Sargasso Sea. Global Biogeochemical Cycles 29:1,266–1,282, https://doi.org/
10.1002/2014GB004913.
Gardner, W.D. 2000. Sediment trap sampling in surface waters. Pp. 240–281 in The
Changing Ocean Carbon Cycle: A Midterm Synthesis of the Joint Global Ocean Flux
Study. R.B. Hanson, H.W. Ducklow, and J.G. Field, eds, Cambridge University Press.
Gardner, W.D., S.P. Chung, M.J. Richardson, and I.D. Walsh. 1995. The oceanic
mixed-layer pump. Deep Sea Research Part II 42:757–775, https://doi.org/
10.1016/0967-0645(95)00037-Q.
Guidi, L., S. Chaffron, L. Bittner, D. Eveillard, A. Larhlimi, S. Roux, Y. Darzi, S. Audic,
L. Berline, J.R. Brum, and others. 2016. Plankton networks driving carbon
export in the oligotrophic ocean. Nature 532:465–470, https://doi.org/10.1038/
nature16942.
Guidi, L., L. Stemmann, L. Legendre, M. Picheral, L. Prieur, and G. Gorsky. 2007.
Vertical distribution of aggregates (>110 um) and mesoscale activity in the north-
eastern Atlantic: Effects on the deep vertical export of surface carbon. Limnology
and Oceanography 52:7–18, https://doi.org/10.4319/lo.2007.52.1.0007.
11You can also read