Collective motion - arXiv.org
←
→
Page content transcription
If your browser does not render page correctly, please read the page content below
Collective motion
arXiv:1010.5017v2 [cond-mat.stat-mech] 26 Jan 2012

                                                                                            Tamás Vicsek1,2 & Anna Zafeiris1,3

                                                             1
                                                                 Department of Biological Physics, Eötvös University - Pázmány Péter stny. 1A, Budapest, Hungary
                                                                                                               H-1117
                                                     2
                                                         Statistical and Biological Physics Research Group of HAS - Pázmány Péter stny. 1A, Budapest, Hungary
                                                                                                         H-1117
                                                         3
                                                             Department of Mathematics, National University of Athens - Panepistimioupolis 15784 Athens, Greece

                                                                                                                   Abstract
                                                                     We review the observations and the basic laws describing the essential aspects of collective motion – being
                                                                 one of the most common and spectacular manifestation of coordinated behavior. Our aim is to provide
                                                                 a balanced discussion of the various facets of this highly multidisciplinary field, including experiments,
                                                                 mathematical methods and models for simulations, so that readers with a variety of background could get
                                                                 both the basics and a broader, more detailed picture of the field. The observations we report on include
                                                                 systems consisting of units ranging from macromolecules through metallic rods and robots to groups of
                                                                 animals and people. Some emphasis is put on models that are simple and realistic enough to reproduce
                                                                 the numerous related observations and are useful for developing concepts for a better understanding of
                                                                 the complexity of systems consisting of many simultaneously moving entities. As such, these models allow
                                                                 the establishing of a few fundamental principles of flocking. In particular, it is demonstrated, that in
                                                                 spite of considerable differences, a number of deep analogies exist between equilibrium statistical physics
                                                                 systems and those made of self-propelled (in most cases living) units. In both cases only a few well
                                                                 defined macroscopic/collective states occur and the transitions between these states follow a similar scenario,
                                                                 involving discontinuity and algebraic divergences.
2                                                                                        1   INTRODUCTION

Contents                                                  5 Modeling actual systems                           52
                                                            5.1 Systems involving physical and chem-
1 Introduction                                       2          ical interactions . . . . . . . . . . . . .   52
  1.1 The basic questions we address . . . .         3          5.1.1 The effects of the medium . . .         52
  1.2 Collective behavior . . . . . . . . . . .      3          5.1.2 The role of adhesion . . . . . .        54
  1.3 The main difference between equilib-                      5.1.3 Swarming bacteria . . . . . . .         56
       rium and self-propelled systems . . . .        3     5.2 Models with segregating units . . . . .       59
  1.4 Goals to be achieved . . . . . . . . . .        5     5.3 Models inspired by animal behavioral
                                                                patterns . . . . . . . . . . . . . . . . .    62
2 Basics of the statistical mechanics           of              5.3.1 Insects . . . . . . . . . . . . . .     62
  flocking                                           5          5.3.2 Moving in three dimensions –
  2.1 Principles and concepts . . . . . . .     .    5                  fish and birds . . . . . . . . . .    63
  2.2 Definitions and expressions . . . . .     .    7      5.4 The role of leadership in consensus
  2.3 Correlation functions . . . . . . . . .   .    8          finding . . . . . . . . . . . . . . . . . .   66
                                                            5.5 Relationship between observations
3 Observations and experiments                       10         and models . . . . . . . . . . . . . . .      67
  3.1 Data collection techniques . . . . . . .       11
                                                          6 Summary and conclusions                           68
  3.2 Physical, chemical and biomolecular
      systems . . . . . . . . . . . . . . . . .  12
  3.3 Bacterial colonies . . . . . . . . . . . . 15 1     Introduction
  3.4 Cells . . . . . . . . . . . . . . . . . . .19
  3.5 Insects . . . . . . . . . . . . . . . . . .23 Most of us must have been fascinated by the eye-
  3.6 Fish schools and shoals . . . . . . . . .  25 catching displays of collectively moving animals.
  3.7 Bird flocks . . . . . . . . . . . . . . . .27 Schools of fish can move in a rather orderly fash-
  3.8 Leadership in groups of mammals and           ion or change direction amazingly abruptly. Under
      crowds . . . . . . . . . . . . . . . . . . 29 the pressure from a nearby predator the same fish
  3.9 Lessons from the observations . . . . .    32 can swirl like a vehemently stirred fluid. Flocks of
                                                    hundreds of starlings can fly to the fields as a uni-
4 Basic models                                   33 formly moving group, but then, after returning to
  4.1 Simplest self-propelled particles (SPP)       their roosting site, produce turbulent, puzzling aerial
      models . . . . . . . . . . . . . . . . . . 33 displays. There are a huge number of further exam-
      4.1.1 The order of the phase transition 35 ples both from the living and the non-living world for
      4.1.2 Finite size scaling . . . . . . . . 36 the rich behavior in systems consisting of interacting,
                                                    permanently moving units.
  4.2 Variants of the original SPP model . . 36
                                                       Although persistent motion is one of the conspic-
      4.2.1 Models without explicit align-
                                                    uous features of life, recently several physical and
             ment rule . . . . . . . . . . . . 36
                                                    chemical systems have also been shown to possess
      4.2.2 Models with alignment rule . . 39 interacting, “self-propelled” units. Examples in-
  4.3 Continuous media and mean-field ap-           clude rods or disks of various kinds on a vibrat-
      proaches . . . . . . . . . . . . . . . . . 41 ing table [Blair et al., 2003, Kudrolli et al., 2008,
  4.4 Exact results . . . . . . . . . . . . . . 46 Deseigne et al., 2010, Narayan et al., 2006, 2007,
      4.4.1 The Cucker-Smale model . . . 46 Yamada et al., 2003, Ibele et al., 2009].
      4.4.2 Network and control theoreti-              The concept of the present review is to on one hand
             cal aspects . . . . . . . . . . . 48 introduce the readers to the field of flocking by dis-
  4.5 Relation to collective robotics . . . . . 49 cussing the most influential “classic” works on collec-
1.2 Collective behavior                                                                                        3

tive motion as well as providing an overview of the       ments during interactions)?
state of the art for those who consider doing research      In Fig. 1, we show a gallery of pictures representing
in this thriving multidisciplinary area. We have put      a few of the many possible examples of the variety
a special stress on coherence and aimed at presenting     of collective motion patterns occurring in a highly
a balanced account of the various experimental and        diverse selection of biological systems.
theoretical approaches.
   In addition to presenting the most appealing re-       1.2    Collective behavior
sults from the quickly growing related literature we
also deliver a critical discussion of the emerging pic-   In a system consisting of many similar units (such
ture and summarize our present understanding of           as many molecules, but also, flocks of birds) the in-
flocking phenomena in the form of a systematic phe-       teractions between the units can be simple (attrac-
nomenological description of the results obtained so      tion/repulsion) or more complex (combinations of
far. In turn, such a description may become a good        simple interactions) and can occur between neigh-
starting point for developing a unified theoretical       bors in space or in an underlying network. Under
treatment of the main laws of collective motion.          some conditions, transitions can occur during which
                                                          the objects adopt a pattern of behavior almost com-
                                                          pletely determined by the collective effects due to the
1.1    The basic questions we address                     other units in the system. The main feature of col-
Are these observed motion patterns system specific?       lective behavior is that an individual unit’s action is
Such a conclusion would be quite common in biol-          dominated by the influence of the “others” – the unit
ogy. Or, alternatively, are there only a few typical      behaves entirely differently from the way it would
classes which all of the collective motion patterns be-   behave on its own. Such systems show interesting or-
long to? This would be a familiar thought for a sta-      dering phenomena as the units simultaneously change
tistical physicist dealing with systems of an enormous    their behavior to a common pattern (see, e.g., Vicsek
number of molecules in equilibrium. In fact, collec-      [2001b]). For example, a group of feeding pigeons
tive motion is one of the manifestations of a more        randomly oriented on the ground will order them-
general class of phenomena called collective behavior     selves into an orderly flying flock when leaving the
[Vicsek, 2001a]. The studies of the latter have iden-     scene after a big disturbance.
tified a few general laws related to how new, more           Understanding new phenomena (in our case, the
complex qualitative features emerge as many simpler       transitions in systems of collectively moving units)
units are interacting. Throughout this review we con-     is usually achieved by relating them to known ones:
sider collective motion as a phenomenon occurring in      a more complex system is understood by analyz-
collections of similar, interacting units moving with     ing its simpler variants. In the 1970s, there was
about the same absolute velocity. In this interpreta-     a breakthrough in statistical physics in the form of
tion the source of energy making the motion possible      the ‘renormalization group method’ [Wilson, 1975b]
(the ways the units gain momentum) and the condi-         which gave physicists a deep theoretical understand-
tions ensuring the similar absolute velocities are not    ing of a general type of phase transition. The theory
relevant.                                                 showed that the main features of transitions in equi-
   There is an amazing variety of systems made of         librium systems are insensitive to the details of the
such units bridging over many orders of magnitude         interactions between the objects in a system.
in size. In addition, the nature of the entities in such
systems can be purely physical, chemical as well as 1.3 The main difference between equi-
biological. Will they still exhibit the same motion
                                                            librium and self-propelled systems
patterns? If yes, what are these patterns and are
there any underlying universal principles predicting The essential difference between collective phenom-
that this has to be so (e.g., non-conservation of mo- ena in standard statistical physics and biology is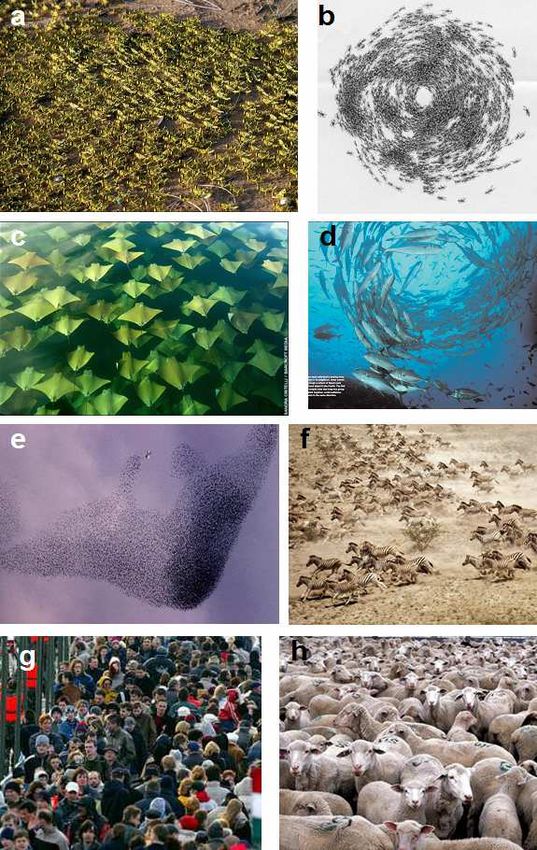
4                                                                                         1   INTRODUCTION

                                                          that the “collision rule” is principally altering in the
                                                          two kinds of systems: in the latter ones it does not
                                                          preserve the momenta (the momentum of two self-
                                                          propelled particles before and after their interaction
                                                          is not the same), assuming that the we consider only
                                                          the system made of the self-propelled particles ex-
                                                          clusively (i.e., we do not consider the changes in the
                                                          environment). Here the expression “collision rule”
                                                          stands for specifying how the states (velocities) of two
                                                          individual units change during their interaction. In
                                                          particular, the momentum dissipated to the medium
                                                          and within the medium itself in the realistic systems
                                                          we consider cannot be neglected. In equilibrium sys-
                                                          tems, according to standard Newtonian mechanics
                                                          the total momentum is preserved and that is how the
                                                          well known Maxwellian velocity distribution is being
                                                          built up from arbitrary initial conditions in a closed
                                                          Galilean system. The mere condition of the units
                                                          maintaining an approximate absolute velocity can be
                                                          realized in an open system only and drives away the
                                                          driven particles from any kind of equilibrium behav-
                                                          ior.
                                                             Energy, sustaining self-propulsion, can be intro-
                                                          duced into the system in various ways: uniformly in
                                                          the bulk, for example in the case of or Janus par-
                                                          ticles, where the motion is ensured by a laser beam
                                                          which causes self-thermophoresis [Jiang et al., 2010],
                                                          at the boundaries (shaken rods), or at specific spatial
                                                          points in space and time (fish).
Figure 1: (Color) A gallery of images related to col-
                                                             Currents are bound to be generated and the overall
lective behavior. Among others, it illustrates the pos-
                                                          momentum is gradually increasing if the initial state
sible existence of very general behavioral patterns.
                                                          is random (in this case the initial momentum is very
(a) Wingless Locusts marching in the field. (b) A ro-
                                                          small because the moments of the oppositely mov-
tating colony of army ants. (c) A three-dimensional
                                                          ing particles cancel out). However, for this overall
array of golden rays. (d) Fish are known to produce
                                                          ordering to occur the random perturbations (acting
such vortices. (e) Before roosting, thousands of star-
                                                          against ordering) have to be small enough.
lings producing a fascinating aerial display. They are
also trying to avoid a predator bird close to the cen-       Most remarkably, however, in spite of this princi-
tral, finger-like structure. (f) A herd of zebra. (g)     pal difference, a number of deep analogies can still be
People spontaneously ordered into “traffic lanes” as      observed between equilibrium statistical physics sys-
they cross a pedestrian bridge in large numbers. (h)      tems and those made of self-propelled (living) units.
Although sheep are known to move very coherently,         In both only a few well defined macroscopic/collective
just as the corresponding theory predicts, when sim-      states occur and the transitions between these states
ply hanging around (no motion), well developed ori-       follow a similar scenario as well (discontinuity, alge-
entational patterns cannot emerge.                        braic divergences, etc).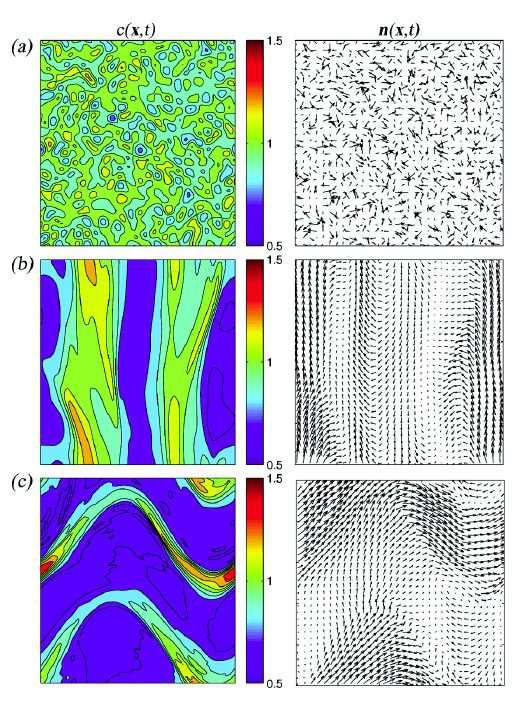
2.1 Principles and concepts                                                                                  5

1.4    Goals to be achieved                             give a somewhat more detailed list of features char-
                                                        acterizing flocking in general. Thus we assume that a
The approach of treating flocks, or even crowds, as system exhibiting collective motion is made of units
systems of particles naturally leads to the idea of ap-
plying the successful methods of statistical physics,      • that are rather similar
such as computer simulations or theories on scaling,
to the detailed description of the collective behavior     • moving with a nearly constant absolute velocity
of organisms. Naturally, for better progress, obser-         and are capable of changing their direction
vations/experiments and modeling have to be inti-
                                                           • interacting within a specific interaction range by
mately related. Indeed, over the past few decades, an
                                                             changing their direction of motion, in a way in-
increasingly growing number of significant attempts
                                                             volving an effective alignment
have been made to both observe and describe flocking
as well as modeling (simulation) the most conspicu-        • which are subject to a noise of a varying magni-
ous features of the observed natural systems ranging         tude
from molecules to groups of mammals.
   It would be quite an achievement if we could es-
tablish a systematic chart of the types of collective
                                                        2.1 Principles and concepts
motion, since many times understanding is achieved In a general sense, phase transition is a process, dur-
through classification. There are reasons and argu- ing which a system, consisting of a huge number of
ments for thinking that the same patterns of collec- interacting particles, undergoes a transition from one
tive motion apply to the collection of molecules up phase to another, as a function of one or more exter-
to groups of humans. There must be some – still to nal parameters. The most familiar phases in which
be discovered – laws of such systems from which the a physical system can be, are the solid, liquid and
above observation follows.                              gaseous phases, and the best known example for a
                                                        phase transition is the freezing of a fluid when the
                                                        temperature drops. In this case the temperature is
2 Basics of the statistical me- the external or “control” parameter.
      chanics of flocking                                  Phase transitions are defined by the change of one
                                                        or more specific system variables, called order param-
Throughout this overview the notion of flocking is eters. This name, order parameter, comes from the
used as a synonym of any kind of coherent motion observation that phase transitions usually involve an
of individual units. However, the notion of coher- abrupt change in a symmetry property of the system.
ent motion needs some further elaboration since, as For example, in the solid state of matter, the atoms
it turns out, it can be manifested in a number of have a well-defined average position on the sites of an
specific ways. In any case, coherent or ordered mo- ordered crystal lattice, whereas positions in the liq-
tion is assumed to be a counterpart of disordered, uid and gaseous phases are disordered and random.
random motion. In the various models of flocking it Accordingly, the order parameter refers to the degree
emerges through a kind of transition (from disorder of symmetry that characterizes a phase. Mathemat-
to order) as a function of the relevant parameter(s) of ically, this value is usually zero in one phase (in the
the models. To demonstrate more clearly this aspect disordered phase) and non-zero in the other (which is
of collective motion the best approach is to adopt a the ordered phase). In the case of collective motion
few related definitions motivated mainly by statisti- the most naturally (but not necessarily) chosen order
cal mechanics or statistical physics (the physics of parameter is the average normalized velocity ϕ,
many interacting molecules).                                                           N
   However, before we turn to the discussion of the                               1 X
                                                                           ϕ=             ~vi ,             (1)
statistical mechanics aspects of collective motion we                           N v0 i=1
6                                      2   BASICS OF THE STATISTICAL MECHANICS OF FLOCKING

where N is the total number of the units and v0 is         that the investigations on the various universal be-
the average absolute velocity of the units in the sys-     haviors that can be associated with non-equilibrium
tem. If the motion is disordered, the velocities of the    systems have by now grown into a sub-discipline with
individual units point in random directions and av-        its own language and formalism including specific
erage out to give a small magnitude vector, whereas        processes the related research concentrates on.
for ordered motion the velocities all add up to a vec-        In particular, most of the representative reviews
tor of absolute velocity close to N v0 (thus the order     on non-equilibrium phase transitions (see, e.g., Ódor
parameter for large N can vary from about zero to          [2004] or Henkel et al. [2009], Non-Equilibrium Phase
about 1).                                                  Transitions: Volume 1: Absorbing Phase Transi-
   If the order parameter changes discontinuously          tions) are centered on such features as i) absorbing
during the phase transition, we talk about a first or-     states of reaction-diffusion-type systems, ii) mapping
der transition. For example, water’s volume changes        to the universal behavior of interface growth mod-
like this (discontinuously) when it freezes to ice. In     els, iii) dynamical scaling in far-from-equilibrium re-
contrast, during second order (or continuous) phase        laxation behavior and ageing, iv) extension to non-
transition the order parameter changes continuously,       equilibrium systems by using directed percolation as
while its derivative, with respect to the control pa-      the main paradigm of absorbing phase transitions.
rameter, is discontinuous. Second order phase tran-        On the other hand, there are some specific features
sitions are always accompanied by large fluctuations       of collective motion such as giant number fluctuations
of some of the relevant quantities.                        (GNF, see below) or various unusual transitions (e.g.,
   During a phase transition a spontaneous symme-          to jamming) which obviously do not occur in systems
try breaking takes place, i.e., the symmetry of the        at equilibrium, but we still have to consider them in
system changes as we pass the critical value of the        this review. On balance, we find that the language
control parameter (e.g., temperature, pressure, etc.).     and the spectrum of the various aspects of equilib-
In the case of one of the simplest representations of      rium phase transitions is surprisingly suitable for in-
a continuous phase transition (the Ising model), the       terpreting most of the observed phenomena in the
spins are placed on a lattice, interact with their clos-   context of collective motion; and this is an important
est neighbors and can point up or down. For high           point we intend to make.
temperatures the spins point in random directions             A further important aspect of the phenomena tak-
(with a probability 1/2 either up or down), while          ing place during collective motion is that in contrast
for low temperatures (way below the critical point)        with the standard assumptions of statistical mechan-
most of them point in the same direction (which is         ics, the number of units involved in the collective be-
either up or down), selected spontaneously. This is        havior typically ranges from a few dozens to a few
an example for the up and down symmetry (high              thousands (in rare cases tens of thousands). On the
temperatures) breaking during the transition (one of       other hand, for example, phase transitions in the
the directions becomes dominant). If there are in-         framework of statistical mechanics are truly mean-
finitely many possible directions (continuous symme-       ingful only for very large system sizes (consisting a
try), during a transition a single preferred direction     number of units approaching infinity). Quantities like
can still emerge spontaneously.                            critical exponents cannot be properly interpreted for
   Phase transitions can occur in both equilibrium         flocks of even moderate sizes. However, a simple tran-
and non-equilibrium systems. In the context of col-        sition from a disordered to an ordered state can take
lective motion – although it is a truly non-equilibrium    place even in cases when the number of units is in
phenomenon – there are reasons for the preference          the range of a few dozens. Most of the real-life ob-
of the possible analogies with the equilibrium phase       servations and the experiments involve this so called
transitions rather than with those studied in the          “mesoscopic scale”. The states (e.g. rotation) and
framework common in the interpretation of non-             the transitions (e.g., from random to ordered motion)
equilibrium phenomena. One important reason is             we later describe can be associated with the phenom-
2.2 Definitions and expressions                                                                                    7

ena taking place in such mesoscopic systems.               equation is
                                                                                         β

                                                                               (1 − η/ηc )    for η < ηc
2.2    Definitions and expressions                                    ϕ∼
                                                                               0              for η > ηc
                                                                                                                 (6)
As for the definitions used in the statistical mechan-
ics approach, phenomena associated with a continu-           Regarding the relation between the order parame-
ous phase transition are often referred to as critical     ter ϕ and the external bias field h (“wind”), ϕ scales
phenomena because of their connection to a critical        as a function of h according to the power law
point at which the phase transition occurs. (“Criti-                               ϕ ∼ h1/δ                      (7)
cal”, because here the system is extremely sensitive to
small changes or perturbations.) Near to the critical         for η > ηc , where δ is the relevant critical exponent.
point, the behavior of the quantities describing the          Various similar expressions can be formulated in-
system (e.g., pressure, density, heat capacity, etc.)      volving further quantities as well as critical expo-
are characterized by the so called critical exponents.     nents. Interestingly, very different physical systems
For example the (isothermal) compressibility κT of         exhibiting seemingly different kind of phase transi-
a liquid substance, near to its critical point, can be     tions follow similar laws. For example the magne-
expressed by                                               tization M of a ferromagnetic material subject to a
                                                           phase transition near to a critical temperature called
                  κT ∼ |T − Tc |−γ ,                (2)    Curie point, obeys M ∼ (Tc − T )β .
where T is the temperature, Tc is the critical tem-           Another surprising observation is that these criti-
perature (at which the phase transition occurs), ∼         cal exponents are related to each other, that is, ex-
denotes proportionality and γ is the critical expo-        pressions like α + 2β + γ = 2 or δ = 1 + βγ can be
nent. In systems of self-propelled particles, noise        formulated, which hold independently of the physical
(η) plays the role of temperature (T ): an external        system the critical exponents (α, β, γ, δ) belong to.
parameter that endeavors to destroy order. Corre-          Note that this is a far from trivial observation! For
spondingly, the fluctuation of the order parameter,        more details on this topic see [Isihara, 1971, Pathria,
                2
σ 2 = ϕ2 − hϕi , is described as                           1996, Cardy, 1996], and for further analogies and dif-
                                                           ferences between ferromagnetic models and systems
                  σ ∼ |1 − η/ηc |
                                    −γ
                                         ,          (3)    of self-propelled particles see [Czirók et al., 1997].
                                                              Since from a mathematical point of view, many
where η is the noise, ηc is the critical noise that sep-   of the results of statistical mechanics are exact only
arates the ordered and disordered phases, and γ is         for infinitely large systems, structures are often de-
again the ‘susceptibility’ critical exponent. By intro-    scribed and analyzed in their “thermodynamic lim-
ducing χ = σ 2 L2 , where L is the linear size of the      its”. This limit means that the number of particles
system, we get                                             constituting the system tends to infinity. Accord-
                                                           ingly, finite structures do not have well defined phases
                    χ ∼ (η − ηc )−γ                 (4)    but only in their thermodynamic limit, where the
                                                           state-equations can develop singularities, and sharp
κT in Eq. (2) corresponds to χ in Eq. (4).
                                                           phase transitions can exist between these well-defined
  An other descriptive expressing the change in the
                                                           phases.
density between the liquid and the gas phases, ρl −ρg ,
                                                              Another phenomenon accompanying phase tran-
obeys to
                                                           sitions is the formation of clusters of units behav-
                                         β                 ing (e.g., being directed or moving) in the same
                ρl − ρg ∼ (Tc − T ) ,               (5)
                                                           way. Units which can be reached through neighboring
where β is the critical exponent. For systems of self-     units belong to the same cluster, where neighboring
propelled particles, when L → ∞, the corresponding         stands for a predefined proximity criterion. Thus,
8                                            2       BASICS OF THE STATISTICAL MECHANICS OF FLOCKING

the behavior of units in the same cluster is usually                                    Z   ∞
highly correlated. In general, correlation functions                          c(τ ) =             f1∗ (t)f2 (t + τ )dt     (9)
represent a very useful tool to characterize the level                                  τ =−∞
of order in a system.                                                Equation (9) shifts f2 along the horizontal axis
                                                                  (which is in this example the time-axis), and cal-
2.3     Correlation functions                                     culates the product at each time-step of the two
                                                                  functions. This value is maximal when f1 and f2
Generally speaking, two series of data (X and Y )                 are congruous, because when lumps (positives areas)
are correlated if there is some kind of relationship              are aligned, they contribute to making the integral
between their elements. A correlation function mea-               larger, and similarly, when the troughs (negative ar-
sures the similarity between the data-sequences, or,              eas) align, they also make a positive contribution to
in the continuous case, the similarity between two sig-           the expression, since the product of two negative val-
nals or functions. Auto-correlation is the correlation            ues is positive.
of a signal with itself, typically as a function of time.            With this introduction we can now formulate some
This is often used to reveal repeating patterns, such             specific correlation functions that are often used in
as the presence of a periodic signal covered by noise.            the field of collective motion.
If the two signals compared are different, we consider               The velocity-velocity correlation function, cvv , is an
cross-correlation.                                                auto-correlation function that shows how closely the
   For example, let us consider two real-valued data-             velocity of a particle (unit, individual, etc.) at time
series f1 and f2 , which differ only by a shift in the            t is correlated with the velocity at a reference time.
element-numbers, e.g., the 5th element in the first               It is defined as follows:
series is the same than the 12th in the second, the 6th
                                                                                               N
corresponds to the 13th, etc. In this case the shift is                                     1 X h~vi (t) · ~vi (0)i
                                                                              cvv (t) =                               ,   (10)
s = 7, that is, the first series has to be shifted with                                     N i=1 h~vi (0) · ~vi (0)i
7 elements in order to be congruous with the second
one. The corresponding (cross) correlation function               where ~vi (0) is the starting (reference) time and N is
will show a maximum at 7. Formally, for discrete                  the number of particles within the system and h. . .i
data-sequences f1 and f2 , the correlation function is            denotes taking an average over a set of starting times.
defined as:                                                       The way cvv (t) decays to zero shows how the veloci-
                                                                  ties at later times become independent of the initial
                       ∞
                       X                                          ones.
              c(s) =          f1∗ [n] f2 [n + s] ,         (8)       The pair correlation function, cp (r), (or radial dis-
                       n=−∞                                       tribution function, g(r)), depicted on Fig. 2, de-
                                                                  scribes how the unit density varies as a function of
   where ‘∗’ refers to the complex conjugate opera-
                                                                  the distance from one particular element. More pre-
tion1 .
                                                                  cisely, if there is a unit at the origin, and if n = N/V
   Accordingly, in continuous case, when f1 and f2                is the average number density (N is the number of
are continuous functions (or “signals”), the cross-               units in a system with volume V ), then the local den-
correlation function will reveal how much one of the              sity at distance r from the origin is ng(r). It can
functions must be shifted (along the horizontal axis)             be interpreted as a measure of local spatial ordering.
to become congruous with the other one. Formally,                 Equation 11 gives the exact formula.
   1 A pair of complex numbers are said to be complex conju-                                *                    +
gates if their real part is the same, but their imaginary parts                       V       XX
                                                                         cp (r) =                     δ(r − rij )      (11)
are of opposite signs. For example, 2 + 3i and 2 − 3i are com-                    4πr2 N 2     i
plex conjugates. It also follows, that the complex conjugate of                                      j6=i
a real number is itself.
2.3 Correlation functions                                                                                            9

Figure 2: Radial distribution function for the so
called Lennard-Jones model. It describes how the
unit density varies as a function of the distance from
one particular element in the case of an interaction
potential having both a shorter range, a strong re-
pulsive and a longer range attractive part.

  The directional correlation function,
             cij (τ ) = h~
                         vi (t) · v~j (t + τ )i ,   (12)
tells to what degree the velocity of the ith particle
at time t is correlated with that of particle j at time
t + τ . h. . .i denotes averaging over time, and v~i (t)   Figure 3: (Color online) Illustration for the direc-
is the normalized velocity of the ith SPP. (Note that      tional correlation function, which is a tool for de-
cij (τ ) = cji (−τ ).) The directional correlation de-     termining the leader-follower relationships within a
lay is primarily used to determine the leader-follower     flock or swarm. This example shows the case of a
relationship within a flock of birds, fish, or more gen-   bird-flock. (a) Determining the projected distance
eral, in a swarm of self-propelled particles (SPPs),       dij (t) of birds i and j onto the direction of motion of
as illustrated on Fig. 3 [Nagy et al., 2010]. The di-      the whole flock at time step t. Bird i is light gray on
rectional correlation delay for a pair of SPPs (i and      the draw, and bird j is dark. The v~j (t) arrows indi-
j, where i, j = 1, 2, . . . , N and N is the number of     cate the direction of bird j at each time step t. The
SPPs within the flock) is calculated according to Eq.      center of mass of the flock is denoted with a cross,
12. Then the maximum value of the cij (τ ) correla-        which moves with vf ~lock (t), the average velocity of
tion function is allocated, τij∗ . Negative value means    the flock. The relative position of the birds i and j is
that the direction of motion of the ith SPP is falling     projected onto vf~lock (t). The directional correlation
behind that of the jth one, so this can be interpreted     function for each i 6= j pair is defined by Eq. (12).
as j is leading. The directional correlation function      (b) Scalar products v~i (t) · v~j (t + τ ) of the normalized
for an SPP with respect to the rest of a given flock       velocity vectors of bird i at time t, and that of bird j
or swarm, is ci (τ ) = h~
                        vi (t) · v~j (t + τ )ii,j .        at time t + τ . On this example bird j follows bird i
   Further useful correlation functions were suggested     with correlation time τij∗ . (c) The directional correla-
in Cavagna et al. [2010] in order to characterize the      tion functions cij (τ ) during the flock flight depicted
response of a flock to external perturbation.              on Fig. 28. For better transparency only five of the
                                                           items are shown, the data belonging to birds A, M,
                                                           G, D and C. The solid symbols indicate the maxi-
                                                           mum value of the correlation functions, which have
                                                           been used to determine the leader-follower network,
                                                           depicted on 28 b. From Nagy et al. [2010].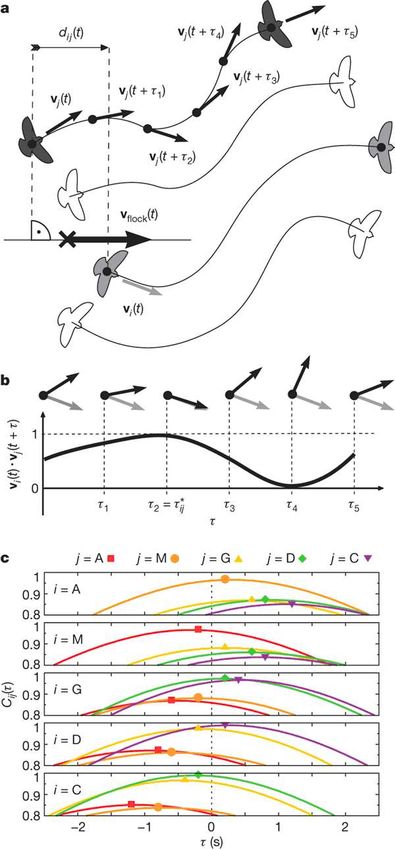
10                                                                         3   OBSERVATIONS AND EXPERIMENTS

   We end this Section with a brief discussion of two               of the main points in this review is that the kinds of
characteristic phenomena which occur in systems of                  systems and the types of collective motion patterns
self-propelled particles but have no direct analogy in              have a greater variety than originally thought of. Be-
processes occurring in equilibrium. Firstly, we point               low we give a – naturally incomplete – list of systems
out that in a confined geometry any group of persis-                in which collective motion has been observed (with
tently moving units having a finite size have a chance              only some of the representative references included):
to be trapped or jammed. The presence of walls
or even a too narrow “exit” would inevitably lead                     • Non-living systems: nematic fluids, shaken
to this phenomenon (see, e.g., [Kudrolli et al., 2008,                  metallic rods, nano swimmers, simple robots,
                                                                        boats, etc. [Kudrolli, 2010, Ibele et al., 2009,
Helbing et al., 2000]).
                                                                        Suematsu et al., 2010, Narayan et al., 2007]
   Another interesting feature is a very specific form
of density changes called as giant number fluctua-                    • Macromolecules         [Schaller et al.,    2010,
tions or GNF.This expression stands for the follow-                     Butt et al., 2010]
ing property of a system of self-propelled units: The
fluctuation of the number of units in an increasing                   • Bacteria colonies [Czirók et al., 1996, 2001,
area of the system scale with the number of units (N)                   Sokolov et al., 2007, Cisneros et al., 2007]
in this area linearly. In addition, these fluctuations
                                                                      • Amoeba [Kessler and Levine, 1993, Nagano,
relax anomalously slowly. This is in sharp contrast
                                                                        1998, Rappel et al., 1999]
with a theoretical result valid for equilibrium systems
according to which (along with the law of large num-                  • Cells [Szabó et al., 2006, Friedl and Gilmour,
bers) the fluctuations in the number of units grow as                   2009,      Arboleda-Estudillo et al.,     2010,
a square root of N . This interesting feature was first                 Belmonte et al., 2008]
pointed out in Narayan et al. [2007] for a system of
shaken elongated rods and subsequently commented                      • Insects [Buhl et al., 2006, Couzin and Franks,
upon by Aranson et al. [2008] showing that inelastic                    2003]
collisions can lead to GNF even for spherical parti-                  • Fish [Hemelrijk and Kunz, 2005, Parrish et al.,
cles.                                                                   2002, Becco et al., 2006, Ward et al., 2008]
   Since shaking introduces an average velocity and
nematic or inelastic collisions involve a tendency for                • Birds [Heppner, 1997, Ballerini et al., 2008,
the particles to align, all these findings are expected                 Hayakawa, 2010, Bajec and Heppner, 2009]
to occur (and will be later discussed) in a variety of
                                                                      • Mammals           [Fischhoff et al.,      2007,
systems with collective motion.
                                                                        Sueur and Petit, 2008, King et al., 2008]
                                                                      • Humans [Faria et al., 2010b, Helbing et al.,
3     Observations                    and          experi-              1997, 2000, Moussaı̈d et al., 2011]
      ments                                                            Although throughout the present review we pri-
It seems that collective motion (or flocking: these two             marily classified the observations and experiments
notions will be used synonymously in this review al-                based on the organizational complexity of the units
though in principle there are some subtle differences               constituting the systems, there are various other as-
in their meanings) is displayed by almost every living              pects as well, by which valid and meaningful catego-
system consisting of at least dozens of units. 2 One                rizations can be made, such as:
    2 In such small systems, we associate with “flocking” a state     • The patterns the units form (coherently moving
of the group in which the units assume an approximately com-            clusters, mills, stripes, etc)
mon direction (or orientation) developing through local com-
munications among the entities.                                       • From an energetic viewpoint:
3.1 Data collection techniques 11
– The way it is introduced to the system (uni- particles’. These particles are assumed to follow
formly, at the boundaries, at special points, the flow dynamics accurately, and it is their motion
etc.) that is then used to calculate velocity information.
– if the particles can preserve it (animals) Cisneros et al. [2007] applied this method in order to
or they dissipate it almost immediately evaluate the velocity filed of thousands of swimming
(shaken rods) bacteria. The task of tracing cells share many similar-
ities with the challenge of tracing the motion of bac-
• The way the units interact with each other. This teria. Czirók et al. [1998] used computer controlled
can be phase contrast video microscope system in order to
– physical, chemical (chemotaxis), visual or follow the collective motion of cells. The trajecto-
medium-mediated ries were recorded for several days to determine the
velocities of each cell of the types.
– isotropic or anisotropic
The movement of vertebrate flocks has been
– polar or apolar tracked mainly by camera-based techniques. Here,
– short or long-range (regarding its temporal the observed animals are bigger, but the space in
characteristics) which they move is often unconfined. The simpler
– through metric or topological distance case is when the group to be observed moves only
in two dimensions. In the ’70-es Sinclair [1977] used
aerial photos to investigate the individual’s spatial
3.1 Data collection techniques
positions within grazing African buffalo herds. Ex-
The main challenge during the implementation of ob- actly because of the difficulties of analyzing three
servations and/or experiments on collective motion, dimensional group motions, Becco et al. [2006] con-
is to keep a record on the individual trajectories of fined the motion of fish to two dimensions by putting
the group-members. This can easily turn out to be a them into a container which was “basically” two di-
difficult task, since (i) most of the colonies or groups mensional (in the sense that it was very shallow):
being investigated consist of many members which 40cm X 30cm X 2cm. This arrangement was con-
(ii) usually look very much alike (iii) and are often venient to track fish with a single video recorder. A
moving fast – just think of a flock of starlings. The homogeneous light source was placed above the con-
applied technology is chosen by considering two fac- tainer and a CCD camera recorded the fish from be-
tors: (i) the size of the moving units, and (ii) the size low. (Obviously, the usage of the container confined
and dimension of the space in which the group can the area of motion as well.)
move. Both parameters range through many scales: In order to reconstruct the three-dimensional posi-
bacteria and cells are subjects of such experiments as tions and orientations of the fish, Cullen et al. [1965]
well as African buffalos or whales. Also, the area in used the so called “shadow method”. With this tech-
which the observation is carried out can range from nology, Partridge et al. [1980] investigated position-
a Petri dish [Keller and Segel, 1971] to the Georges ing behavior in fish groups of up to 30 individuals.
Bank (a region separating the Gulf of Maine from the Parrish and Turchin [1997] recorded the trajectories
Atlantic Ocean, [Makris et al., 2009]). Accordingly, of fish in three dimensions with three orthogonally
there is a variety of technologies that have been ap- positioned video cameras.
plied during the last decades. Major and Dill. [1978] were the first to apply the
The method called “Particle Image Velocimetry”, stereo photography technique in order to record the
(PIV) [Raffel et al., 2002] is used to visualize the three dimensional positions of birds within flocks
motion of small particles moving in a well-confined of European starlings and dunlins. By using the
area. Originally it is an optical technique used to pro- same technique, recently Ballerini et al. [2008] recon-
duce the two dimensional instantaneous velocity vec- structed the three-dimensional positions of hundreds
tor field of fluids, by seeding the media with ‘tracer of starlings in airborne flocks with high precision.12 3 OBSERVATIONS AND EXPERIMENTS
The stereo photography method allowed the detailed lective motion in deionized water under UV illumi-
and accurate analysis of nearest neighbor distances nation. The autonomous motion these particles ex-
in large flocks, but still did not make the trajectory hibit under the above circumstances (deionized wa-
reconstruction of the individual flock members possi- ter and UV light) is due to their asymmetric photo-
ble. decomposition, and the spatial self-organization is
As technology advances, newer and newer methods due to the ions which are secreted by the AgCl par-
and ideas show up with the purpose of studying col- ticles as they move.
lective motion. Here we mention two of these: The re- Various experiments on non-living self propelled
cently developed OWARIS (“Acoustic Waveguide Re- particles (SPPs) possessing diverse features advo-
mote Sensing”) exploits the wave propagation prop- cate that the shape and symmetry of the SPPs
erties of the ocean environment [Makris et al., 2006], play an important role in their collective dynam-
and makes the instantaneous imaging and continu- ics, and that large-scale inhomogeneity and coher-
ous monitoring of fish populations possible, covering ent motion can appear in a system in which parti-
thousands of square kilometers, that is, an area tens cles do not communicate except by contact. Sym-
of thousands to millions of times greater than that metric (or “apolar”) rods on vibrating surfaces have
of conventional methods. The other new method is been observed to form nematic order and under cer-
based on the usage of the “Global Positioning Sys- tain conditions found to exhibit persistent swirling
tem”, commonly known as GPS. The idea is to put as well [Narayan et al., 2006, Galanis et al., 2006].
small GPS devices on moving animals by which the Narayan et al. [2007] have also investigated symmet-
problem of trajectory-recording is basically solved. ric macroscopic rods and have found giant number
With this method the trajectory of flock members fluctuations lasting long, decaying only as a logarith-
can be collected with high temporal resolution in mic function of time (see Fig. 6). This finding is
their natural environment. The limits of this tech- in obtrusive contrast with the expected behaviour,
nique at this moment are on the one hand the grow- since the the central limit theorem predicts number
ing cost of the research with the growing number of fluctuations proportional to the square root of the
tracked flock members, and on the other hand the particle number, in the homogeneous ordered phase
limited accuracy of the devices. Biro et al. [2006] of equilibrium systems, away from the transition. By
and Nagy et al. [2010] analyzed GPS logged flight conducting complementary experiments with spheri-
tracks of homing pigeon pairs in order to investigate cal particles, Aranson et al. [2008] demonstrated that
hierarchical leadership relations inside the group and the giant number fluctuation phenomenon can arise
Dell’Ariccia et al. [2008] used this method to study either from dynamic inelastic clustering or from per-
the homing efficiency of a pigeon group consist of 6 sistent density inhomogenity as well.
birds. Periodically, vertically vibrated granular rods form
vortex patterns [Blair et al., 2003]. Above a critical
3.2 Physical, chemical and biomolec- packing fraction, the ordered domains – consisting of
nearly vertical rods – spontaneously form and coex-
ular systems
ist with horizontal rods (see Fig. 4). The vortices
Along with the accumulating observations and exper- nucleate and grow as a function of time. Exper-
iments clarified the recognition, that flocking – collec- iments performed in an annulus with a single row
tive motion – emerges not only in systems consisting of rods revealed that the rod motion was generated
of living beings, but also among interacting physical when these objects were inclined from the vertical,
objects, based on mere physical interactions without and was always in the direction of the inclination (see
communication. A very simple system has been de- Fig. 5). The relationship between the covered area
scribed by Ibele et al. [2009] who reported about sim- fraction and the diffusion properties in the case of
ple autonomous micromotors, which are micrometer- self-propelled rods was also studied [Kudrolli, 2010].
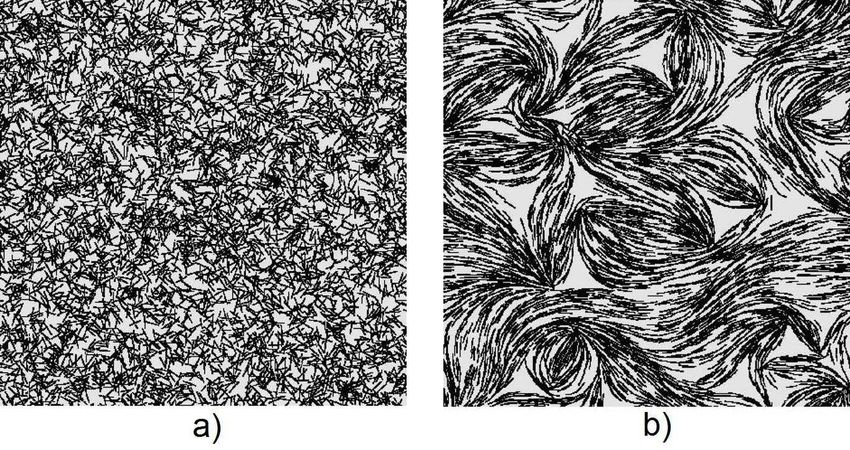
sized silver chloride (AgCl) particles exhibiting col- Kudrolli et al. [2008] have made experiments with3.2 Physical, chemical and biomolecular systems 13
Figure 4: Periodically, vertically vibrated granular
rods spontaneously form vortices which grow with
Figure 6: A snapshot of the nematic order assumed
time. From Blair et al. [2003]
by 2820 rods which are sinusoidally vibrated perpen-
dicularly to the plane of the image. The large density
fluctuations take several minutes to relax and to form
elsewhere. From Narayan et al. [2007].
ordered and ordered motion, depending on the noise
level. They also found that a few steerable boats –
acting as leaders – were able to determine the di-
rection of the group. For this end, it was enough
to manipulate 5 − 10 % of the boats. In a some-
Figure 5: Experiments performed in an annulus with what similar experiments, the collective motion of
a single row of rods reveal that the rod motion is camphor boats were studied, interacting through the
generated when these objects are inclined from the chemical field, swimming in an annular water chan-
vertical, and is always in the direction of the inclina- nel. Here too, several patterns were observed, such as
tion. From Blair et al. [2003] homogeneous state, cluster flow and congestion flow
[Suematsu et al., 2010].
Tinsley et al. [2008] presented an experimen-
polar (non-symmetric) rods on a vibrating surface. tal study on interacting particle-like waves (see
Their rods had a symmetric shape, but a non- more about the design of wave propagation in
symmetrical mass distribution which caused them to Sakurai et al. [2002]) and suggested this method
move toward their lighter end. They have observed as an opportunity to investigate small groups of
local ordering, aggregation at the side walls, and clus- SPPs in laboratory environment. The stabilized
tering behavior. Apolar, but round-shaped disks have wave-segments they have used were those appearing
also been studied [Deseigne et al., 2010]. By shaking in the light-sensitive Belousov-Zhabotinsky reaction
a monolayer of these small objects with variable am- [Zaikin and Zhabotinsky, 1970]. These constant-
plitude, large-scale collective motion and giant num- velocity chemical waves can be interpreted as self-
ber fluctuations could be observed. propelled particles which are linked to each other via
Another experiment studying inanimate objects appropriate interaction potentials.
used radio-controlled boats moving in an annular Along with the accumulation of the experimental
pool, interacting through inelastic collisions only results, the assumption that only a few parameters
[Tarcai et al., 2011]. The team recorded various and factors play a crucial role in the emergence of
kinds of patterns, such as jamming, clustering, dis- the ubiquitous phenomena of collective motion has14 3 OBSERVATIONS AND EXPERIMENTS
Figure 7: (Color online) The setup of the experiment
designed to investigate the effect of density on the
collective motion of actin filaments. (a) Filament- Figure 8: (Color online) Motion of actin filaments
motion is visualized by the usage of fluorescently la- in a motility assay. (a) The individual filaments
beled reporter filaments. The ratio of labeled to unla- were tracked automatically and the positions (de-
beled molecules is around 1:200. (b) For low filament noted by circles) were used to estimate their (color
densities a disordered structure is found, where the coded) direction of motion. (b) The color coded (as
bio-molecules perform persistent random walk with- above) paths plotted as a continuous track to high-
out directional preference. Scale bar represents 50 light the trajectory of each filament. The tracks
µm. From Schaller et al. [2010]. shown are from a 100-frame video sequence recorded
at 25 frames/s. Adapted from Butt et al. [2010].
been increasingly supported. Particle–density turns
out to be one of these parameters, or more precisely, randomly oriented myosin molecules (Fig. 8). Ac-
the density of the objects or living beings that exhibit cording to their observations, domains of oriented fil-
collective motion. aments formed spontaneously and were separated by
The essential role of the density has been demon- distinct boundaries. The authors suggested that the
strated in a set of elegant experiments on persis- self-alignment of actin filaments might make an im-
tently moving biomolecules. In these investigations portant contribution to cell polarity and provide a
– involving the smallest, experimentally realized self- mechanism by which cell migration direction might
propelled particles so far – the so called in vitro motil- respond to chemical cues. At almost the same time,
ity assay is utilized to study the emergence of collec- Schaller et al. [2010] undertook a very similar study,
tive motion on a molecular level. In such an assay but in a somewhat different context of active mat-
actin filaments and fluorescently labeled reporter fil- ter and using extensive evaluation and computational
aments are propelled by immobilized molecular mo- techniques to characterize the phenomenon. They
tors (myosin molecules) attached to a planar surface, also found that the onset of collective motion was
as depicted on Fig. 7. In a recent study, Butt et al. a result of increased filament density. In particu-
[2010] were the first to observe the bulk alignment lar, for low filament densities a disordered phase has
of the actin filaments sliding movement for high con- been discerned, in which individual filaments per-
centration values even though they were powered by formed random walk without any directional pref-3.3 Bacterial colonies 15
3.3 Bacterial colonies
Since microorganism colonies (such as bacteria
colonies) are one of the simplest systems consist-
ing of many interacting organisms, yet exhibiting a
non-trivial macroscopic behavior, a number of stud-
ies have focused on the experimental and theoretical
aspects of colony formation and on the related collec-
tive behavior [Shapiro and Dworkin, 1997, Alt et al.,
Figure 9: (Color online) The typical behavior of the 1997, Vicsek, 2001a].
bio-molecule actin filament in the function of den- The first investigations date back to the early
sity. The disordered structure (a) becomes ordered 1970-es, when Keller and Segel [1971] studied the
(b) above a certain density ρ∗ , which is around 0.8 motion of Escherichia coli bands and developed
filaments per µm2 . In this high density regime, wave- a corresponding phenomenological theory as well.
like structures can be observed. Above 0.2 filaments They used partial differential equations describ-
per µm2 , spirals or swirls can be observed as well ing the consumption of the substrate and the
(c), which are characterized by huge angular velocity change in bacterial density due to random mo-
gradients destabilizing the swirl. This limited stabil- tion and to chemotaxis. Since than, many ob-
ity is visible near to the central region of the pat- servations have been made [Childress et al., 1975,
tern, where crushing events of the filament current Fujikawa and Matsushita, 1989, Vicsek et al., 1990,
are likely to develop. Scale bar is 50 µm. Adapted Ben-Jacob et al., 1994], and it has become evident
from Schaller et al. [2010]. that the bacteria within the colonies growing on wet
agar surfaces produce an exciting variety of collec-
tive motion patterns: among others, motions sim-
erence. Above a certain density, which was around ilar to super-diffusing particles, highly correlated
0.2 filaments per µm2 , in an intermediate regime, turbulent as well as rotating states have been ob-
the disordered phase became unstable and small clus- served, and colony formations exhibiting various pat-
ters of coherently moving filaments emerged. Further terns including those reminiscent of fractals. A spe-
concentration-increase caused growth in the cluster- cial category are those studies which contain not
sizes, but the bunches remained homogeneous. Then, only an observation or a theoretical model, but
above 0.8 filaments per µm2 (signed with ρ∗ on Fig. a matching pair of them: detailed description of
9), persistent density fluctuations occurred, leading an observation together with a computational or
to the formation of wave-like structures. The au- mathematical model that accounts for the obser-
thors also identified the weak and local alignment- vations [Keller and Segel, 1971, Czirók et al., 1996,
interactions to be essential for the formation of the Wu et al., 2009, 2007, Czirók et al., 2001].
patterns and their dynamics. A simulation model Czirók et al. [1996] were the first to interpret an
was used to interpret the interplay between the un- experimentally observed complex behavior through a
derlying microscopic dynamics and the emergence of many-particle-type simulation, incorporating realis-
global patterns in a good agreement with the obser- tic rules. They have investigated the intricate colony
vations. formation and collective motion (formation of rotat-
The collective behavior and pattern formation ing dense aggregates, migration of bacteria in clus-
in granular, biological, and soft matter sys- ters, etc.) of a morphotype of Bacillus subtilis using
tems have been reviewed by Aranson and Tsimring control parameters, such as the concentration of agar
[2006], and more recently in their book as well, and peptone, which was the source of nutrient. Under
[Aranson and Tsimring, 2009], including both exper- standard (favorable) conditions bacterium colonies
iments and theoretical concepts. do not exhibit a high level of organization. How-16 3 OBSERVATIONS AND EXPERIMENTS
Figure 10: (Color online) A typical colony of the vor-
tex morphotype of Bacillus subtilis. The black discs Figure 11: Swimming Bacillus subtilis cells exhibit-
contain thousands of bacteria circling together as the ing collective dynamics. On a large scale, response to
discs themselves glide outward on the surface during chemical gradients (oxygen, in this case) can initiate
colony growth. Courtesy of E. Ben-Jacob. behavior that results in striking hydrodynamic flows.
From Cisneros et al. [2007].
ever, under certain hostile environmental conditions ticity field. By simultaneously measuring the posi-
(like limited nutrient source or hard agar surface) the tions, velocities and orientations of around one thou-
complexity of the colony as a whole increases, charac- sand bacteria, Zhang et al. [2010] demonstrated that
terized by the appearance of cell-differentiation and under specific conditions, colonies of wild-type Bacil-
long-range information transmission [Shapiro, 1988]. lus subtilis exhibit giant number fluctuations. More
For describing the observed hydrodynamics (vortex- specifically, they found that the number of bacteria
formation, migration of clusters) of the bacteria in per unit area shows fluctuations far larger than those
an intermediate level, Czirók et al. [1996] proposed for populations in thermal equilibrium.
a simpler model of self-propelled particles, and more The collective behavior of motile aerobic bacte-
complex ones – taking into account further biologi- ria (“aerobic” are those bacteria which need the
cal details – to capture the more elaborated collective presence of oxygen for their survival), primarily in
behaviors, like the vortex and colony formation (see high cell-concentration, is governed by the inter-
Sec. 5.1.3). Figure 10 depicts a typical bacterium play between buoyancy, oxygen consumption, mix-
colony formed by the vortex morphotype. ing and hydrodynamic interactions. The pattern-
This kind of bacterium, Bacillus subtilis, when formation of these bacteria is often governed by an-
the cells are very concentrated (nearly close-packed), other physical mechanism as well, called bioconvec-
forms a special kind of collective phase called “Zoom- tion [Pedley and Kessler, 1992], which appears on
ing BioNematics” (ZBN) [Cisneros et al., 2007]. This fluid medium having a surface open to the air. The
phase is characterized by large scale orientational co- authors argued that the patterns appear because bac-
herence, analogous to the molecular alignment of ne- teria, which are denser than the fluid they swim
matic liquid crystals, in which the cells assemble to- in, gather at the surface creating a heavy layer on
gether into co-directionally swimming clusters, which the top of a lighter medium. When the density of
often move at speeds larger then the average speed the bacteria-cells exceed a certain threshold, this ar-
of single bacteria. Figure 11 shows a snapshot of rangement becomes unstable resulting in a large-scale
swimming Bacillus subtilis cells exhibiting collective cell circulation (or convection).
dynamics, and Fig. 12 depicts the corresponding vor- Sokolov et al. [2009] have investigated the onset of3.3 Bacterial colonies 17
Figure 12: (Color) A snapshot of the vorticity field of
the swimming bacteria Bacillus subtilis (depicted on Figure 13: The edge of the expanding colony of bacte-
Fig. 11). The small arrows indicate the correspond- ria M. xanthus. Some individual cells and slime traits
ing velocity field. The color bar indicates vorticity in are labeled, along with some multicellular “rafts” and
seconds−1 . The turbulent motion of the suspension mounds. The colony is expanding in the radial di-
is well-observable. The regions of aligned motility are rection, which is to the right in this image. From
hundreds of times larger than the size of the bacteria, Wu et al. [2009].
remaining coherent for the order of magnitude of a
second. From Cisneros et al. [2007].
authors constructed a detailed computational model
that took into account both the behavior and the cell
large-scale collective motion of aerobic bacteria swim- biology of the bacteria M. xanthus. The most in-
ming in a thin fluid, a ‘film’, which had adjustable teresting result was revealed by the model, namely,
thickness. They have demonstrated the existence of that these reversals generate a more orderly swarm
a clear transition between a quasi-two-dimensional with more cells oriented in parallel, making the cells
collective motion state and a three-dimensional tur- less likely to collide with each other. Without these
bulent state that occurs at a certain fluid-thickness. turn-backs the cells would become disordered and as
In the turbulent state – which is qualitatively differ- a whole, would move at a slower rate while finally
ent from bioconvection – an enhanced diffusivity of coming to a standstill. The model predicts that the
bacteria and oxygen can be observed, which – suppos- swarm expands at the greatest rate when cells reverse
edly – serves the better survival of bacteria colonies their direction approximately every eight minutes –
under harsh conditions. which is in exact match with the observations. Fig-
In another remarkable recent paper, while seeking ure 13 shows a snapshot of the expanding colony of
to understand how certain bacteria colonies are able bacteria M. xanthus.
to spread so efficiently, Wu et al. [2009] reported on Wild-type (“normal”) Myxococcus xanthus has two
a completely unexpected phenomenon: they found different kinds of engines to move itself: a pilus at
that members of a certain kind of bacteria (Myxococ- its front end which pulls the cell, and a slime se-
cus xanthus) regularly reverse their direction, head- cretion engine at its rear that pushes the bacterium
ing back to the colony which they have just came forward. Wu et al. [2007] have investigated the coor-
from, which is – seemingly – only a waste of time dinated motion and social interactions of this bacteria
and energy. Motivated by these observations, the by using mutants: bacteria that were void of eitherYou can also read